. 2024 Sep 30;16(9):5860-5877.
doi: 10.21037/jtd-24-569. Epub 2024 Sep 26.

Prognostic model of lung adenocarcinoma based on immunoprognosis-related genes and related drug prediction

Affiliations

Prognostic model of lung adenocarcinoma based on immunoprognosis-related genes and related drug prediction

Zihao Shen et al. J Thorac Dis. .

Abstract

Background: Lung cancer (LC) is the most common malignant tumor in the world, and lung adenocarcinoma (LUAD) is the most common type of LC. Immune microenvironment plays a critical role in cancer from onset to relapse. We aimed to identify an effective immune-related prediction model for assessing prognosis and predicting the relevant tumor therapeutic drugs.

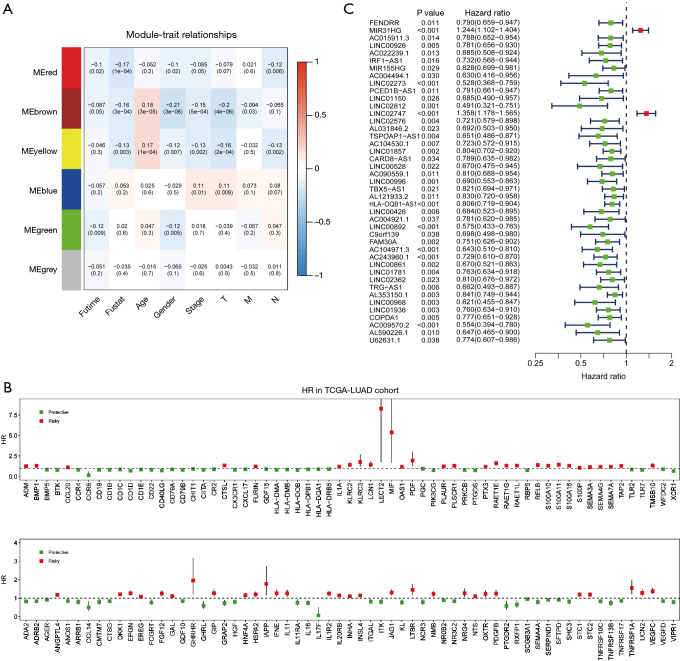
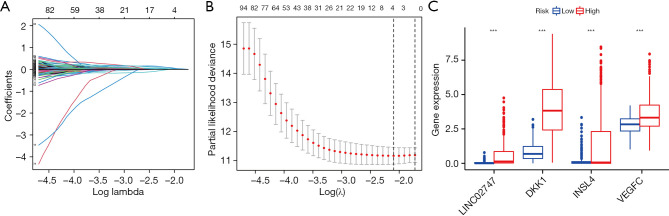
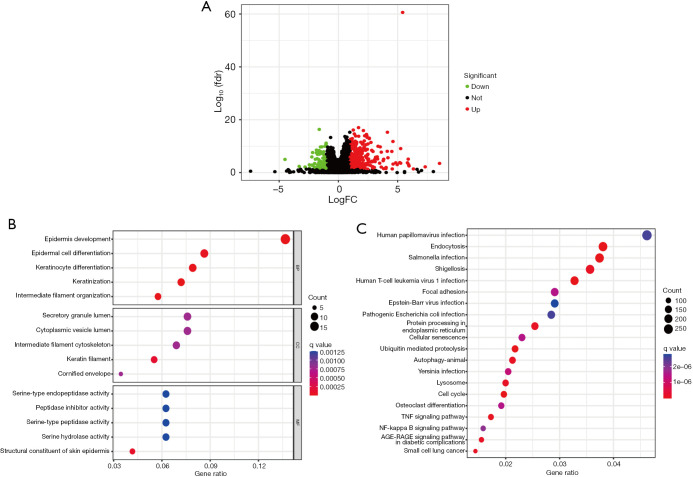
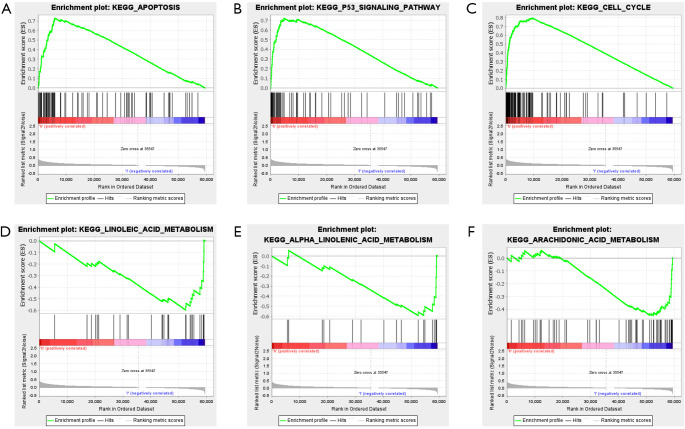
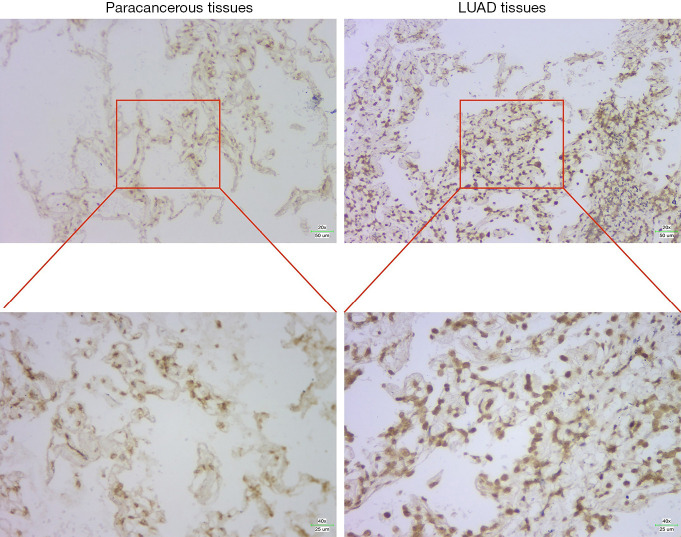
Methods: According to the RNA sequencing data of LUAD transcriptome in The Cancer Genome Atlas (TCGA) database and the immune-related genes obtained from IMMPORT (The Immunology Database and Analysis Portal) database, immune prognosis-related genes were screened. Weighted gene co-expression network analysis (WGCNA) identified hub genes in differentially expressed immune-related genes (DEIRGs). Least absolute shrinkage and selection operator (LASSO) Cox and ten rounds of cross-validation were used to screen core genes to establish a prognostic model, and in situ hybridization was used to verify the expression of core genes in LUAD. Then the patients from the TCGA database were divided into high-risk group and low-risk group. The survival, tumor microenvironment (TME) and immune cell infiltration of different groups were further analyzed, and the differential genes between the two groups were analyzed by gene ontology (GO), Kyoto Encyclopedia of Genes and Genomes (KEGG) and Gene Set Enrichment Analysis (GSEA) enrichment analyses. Finally, the small molecular drugs that can inhibit the prognosis of LUAD were screened by Connectivity Map (CMAP), and the therapeutic mechanism of small molecular drug oxibendazole was verified by Cell Counting Kit-8 (CCK-8) experiment.

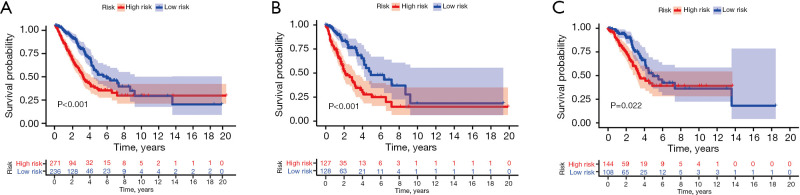
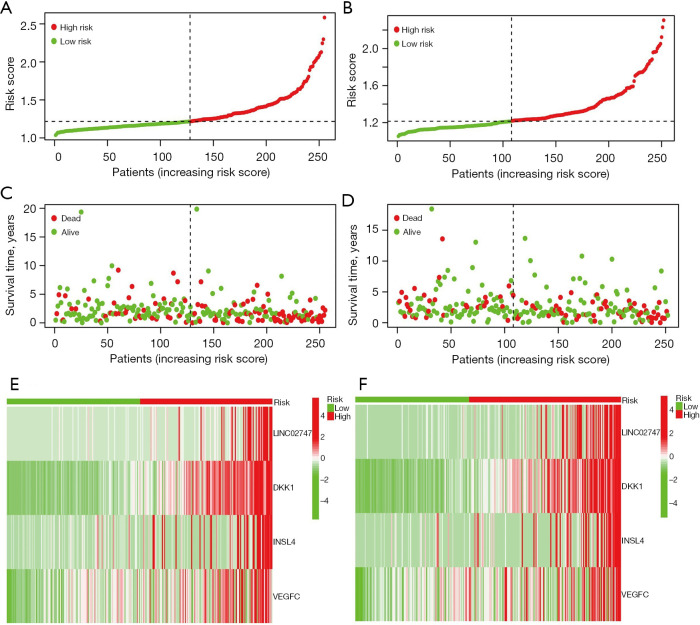
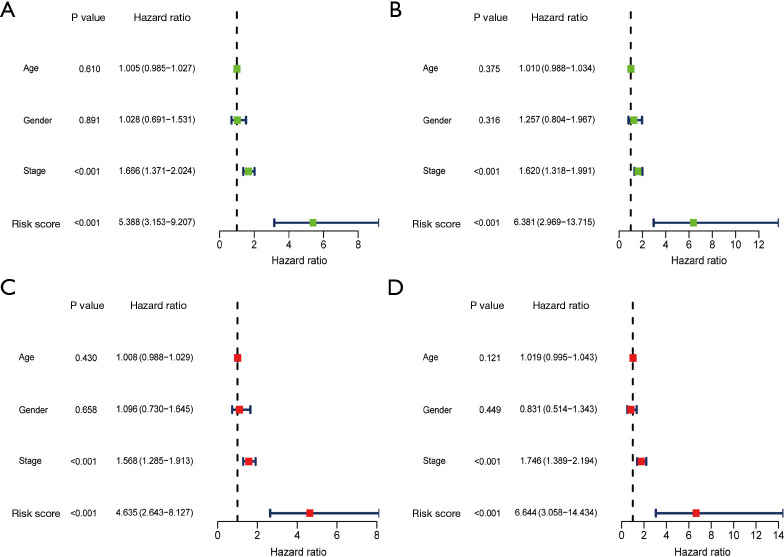
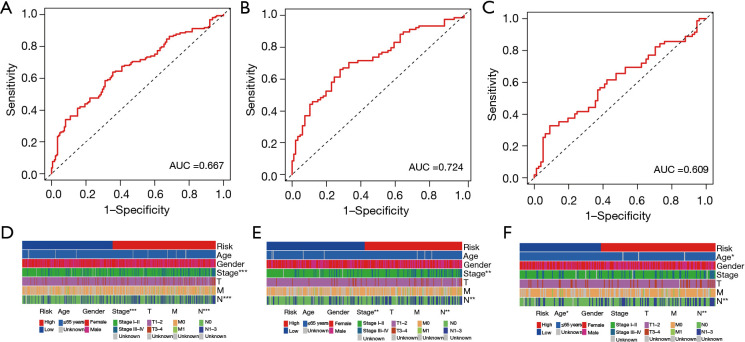
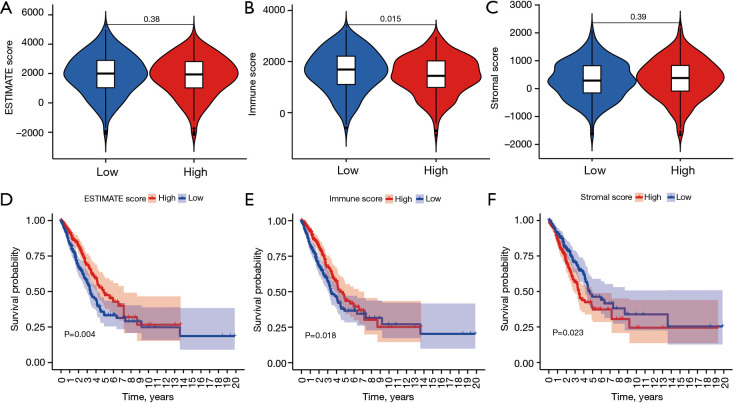
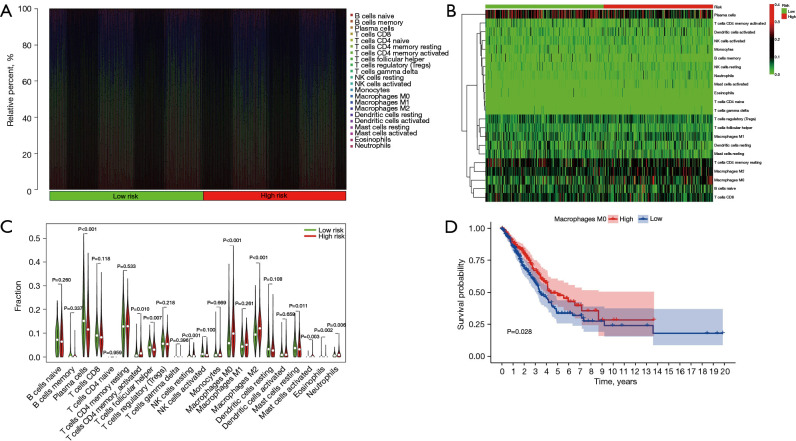
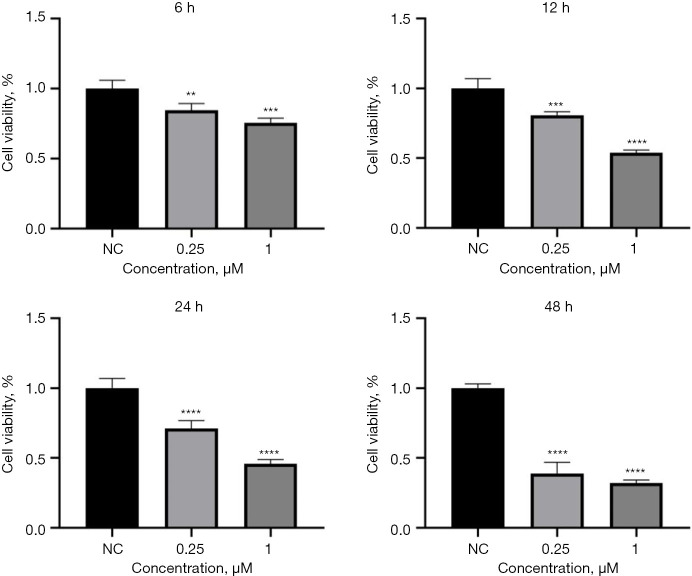
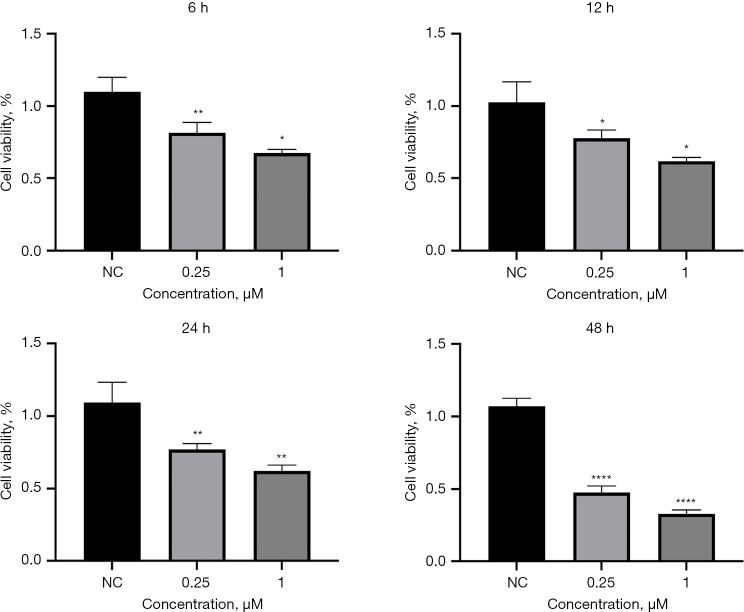
Results: A four-immunoprognosis-related gene model was established to forecast the overall survival (OS) of LUAD through LASSO Cox regression and ten rounds of cross-validation analysis. This prognostic model stratified LUAD patients into low-risk and high-risk groups. According to the findings of the survival analysis, the low-risk group had a greater OS than the high-risk group and the content of immune cells in LUAD was corrected with the survival prognosis of patients. Univariate and multivariate Cox regression also revealed that the prognostic model was an independent prognosis factor in LUAD. Five kinds of small molecular drugs which can inhibit the prognosis of LUAD were screened by CMAP. As shown by CCK-8 test, the small molecular drug "oxibendazole" can effectively inhibit the proliferation of LUAD cells.

Conclusions: Based on immune-related prognostic genes, a new prognostic model for LUAD was constructed. Oxibendazole can inhibit the proliferation of LUAD cells, which provides a new idea for the treatment of LUAD.

Keywords: Oxibendazole; The Cancer Genome Atlas (TCGA); immunoprognostic genes; lung adenocarcinoma (LUAD); prognostic model.


Conflict of interest statement

Conflicts of Interest: All authors have completed the ICMJE uniform disclosure form (available at https://jtd.amegroups.com/article/view/10.21037/jtd-24-569/coif). Y.J. reports that this project was supported by National Natural Science Foundation of China, Youth Science Foundation Project (No. 82300412). The other authors have no conflicts of interest to declare.

Figures

Figure 1
Figure 1
Immune mRNAs and immune LncRNAs related to the prognosis. (A) The WGCNA module genes of the prognostic-related genes. (B) Forest plot of the immune genes implicated in survival, P≤0.05. (C) Forest plot of the immune LncRNAs related to survival, P≤0.01. ME, module eigengene; T, tumor; N, node; M, metastasis; HR, hazard ratio; TCGA-LUAD, The Cancer Genome Atlas-lung adenocarcinoma; mRNA, messenger RNAs; LncRNAs, long non-coding RNAs; WGCNA, weighted gene co-expression network analysis.
Figure 2
Figure 2
Construction of the prognostic model. (A) The LASSO Cox regression algorithm was used to identify the prognostic genes. (B) The set of four genes was screened by 10 rounds of cross-validation. (C) Differences in the expression of the genes involved in the prognostic model construction between the high-risk and low-risk groups. ***, P≤0.001. LASSO, least absolute shrinkage and selection operator.
Figure 3
Figure 3
Kaplan-Meier survival analysis of the high and low risk groups. (A) Combined set; (B) training set; (C) validation set.
Figure 4
Figure 4
Evaluation of the prognostic model. (A,C,E) The distribution of patient risk scores, corresponding survival status and heatmap of the expression of prognostic model genes for risk scores in the training set. (B,D,F) The distribution of patient risk scores, corresponding survival status and heatmap of the expression of prognostic model genes for risk scores in the validation set.
Figure 5
Figure 5
Prognostic model evaluation. (A) Univariate Cox regression analysis of the prognostic model in the training set. (B) Univariate Cox regression analysis of the prognostic model in the validation set. (C) Multivariate Cox regression analysis of the prognostic model in the training set. (D) Multivariate Cox regression analysis of the validation set prognostic model.
Figure 6
Figure 6
Prognostic model evaluation. (A) Analysis of ROC over time in the combined set (AUC =0.667). (B) Analysis of ROC over time in the training set (AUC =0.724). (C) Analysis of ROC over time in the validation set (AUC =0.609). (D) Differential expression of the combined set between the high-risk group and the low-risk group. (E) Differential expression of the training set between the high-risk group and the low-risk group. (F) Differential expression of the validation set between the high-risk group and the low-risk group. ***, P≤0.001; **, P≤0.01; *, P≤0.05. AUC, area under the curve; T, tumor; N, node; M, metastasis; ROC, receiver operating characteristic curve.
Figure 7
Figure 7
Analysis of the tumor microenvironment. (A-C) Estimation of STromal and Immune cells in MAlignant Tumor tissues using Expression data (ESTIMATE) score, Immune score and Stromal score in the high-risk and low-risk groups. (D-F) Kaplan-Meier survival analysis of the high-risk and low-risk groups.
Figure 8
Figure 8
Analysis of the immune infiltration. (A,B) Heat maps of immune cell infiltration in the high-risk and low-risk groups. (C) The Violin diagram shows the different expression of immune cells between the high-risk and low-risk groups; red: high-risk group; green: low-risk group. (D) Kaplan-Meier survival analysis showed that the low M0 macrophages expressing group had better survival than the high M0 macrophages expressing group, P=0.028. NK, natural killer.
Figure 9
Figure 9
Risk differential gene analysis. (A) DEGs between the high-risk and low-risk groups, log|FC| ≥1, FDR <0.05. (B) GO enrichment analysis. (C) KEGG enrichment analysis. FDR, false discovery rate; FC, fold change; BP, biological process; CC, cellular component; MF, molecular function; DEGs, differentially expressed genes; GO, gene ontology; KEGG, Kyoto Encyclopedia of Genes and Genomes.
Figure 10
Figure 10
Differential gene analysis. (A-C) Several pathways in the high-risk group. (D-F) Several pathways in the low-risk group.
Figure 11
Figure 11
Microscopy results of in situ hybridization experiment LINC02747 in adjacent/cancerous tissues by DAB Horseradish Peroxidase Color Development Kit. LUAD, lung adenocarcinoma.
Figure 12
Figure 12
A549 cells were treated with 0.25 and 1.0 µM oxibendazole, and cell counts were collected at the indicated times. Each reported value represents the mean ± standard deviation (SD) from three independent experiments. **, P<0.01; ***, P<0.001; ****, P<0.0001, for the vs. noncancerous (NC) group.
Figure 13
Figure 13
H1299 cells were treated with 0.25 and 1.0 µM oxibendazole, and cell counts were collected at the indicated times. Each reported value represents the mean ± standard deviation (SD) from three independent experiments. *, P<0.05; **, P<0.01; ****, P<0.0001, for the vs. noncancerous (NC) group.

Similar articles

References

    1. Thai AA, Solomon BJ, Sequist LV, et al. Lung cancer. Lancet 2021;398:535-54. 10.1016/S0140-6736(21)00312-3 - DOI - PubMed
    1. Nicholson AG, Tsao MS, Beasley MB, et al. The 2021 WHO Classification of Lung Tumors: Impact of Advances Since 2015. J Thorac Oncol 2022;17:362-87. 10.1016/j.jtho.2021.11.003 - DOI - PubMed
    1. Cheng TY, Cramb SM, Baade PD, et al. The International Epidemiology of Lung Cancer: Latest Trends, Disparities, and Tumor Characteristics. J Thorac Oncol 2016;11:1653-71. 10.1016/j.jtho.2016.05.021 - DOI - PMC - PubMed
    1. Hayashi T, Takamochi K, Kohsaka S, et al. Transformation from EGFR/PTEN co-mutated lung adenocarcinoma to small cell carcinoma in lymph node metastasis. Pathol Int 2020;70:295-9. 10.1111/pin.12919 - DOI - PubMed
    1. Herbst RS, Morgensztern D, Boshoff C. The biology and management of non-small cell lung cancer. Nature 2018;553:446-54. 10.1038/nature25183 - DOI - PubMed

LinkOut - more resources