. 2024 Sep 30;16(9):5591-5603.
doi: 10.21037/jtd-24-544. Epub 2024 Sep 6.

Lung field-based severity score (LFSS): a feasible tool to identify COVID-19 patients at high risk of progressing to critical disease

Affiliations

Lung field-based severity score (LFSS): a feasible tool to identify COVID-19 patients at high risk of progressing to critical disease

Xin'ang Jiang et al. J Thorac Dis. .

Abstract

Background: Coronavirus disease 2019 (COVID-19) still poses a threat to people's physical and mental health. We proposed a new semi-quantitative visual classification method for COVID-19, and this study aimed to evaluate the clinical usefulness and feasibility of lung field-based severity score (LFSS).

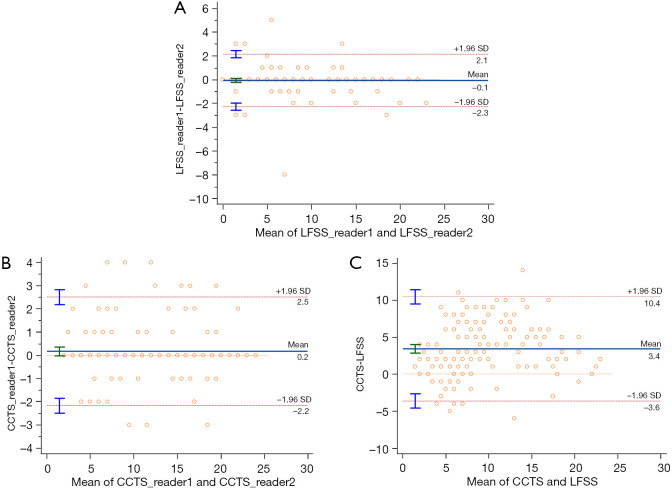
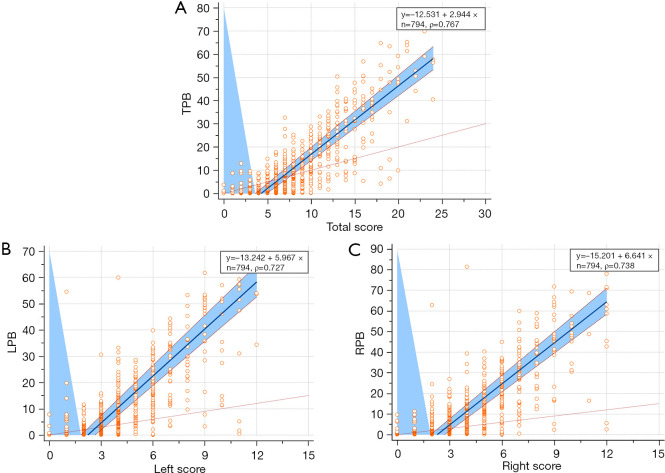
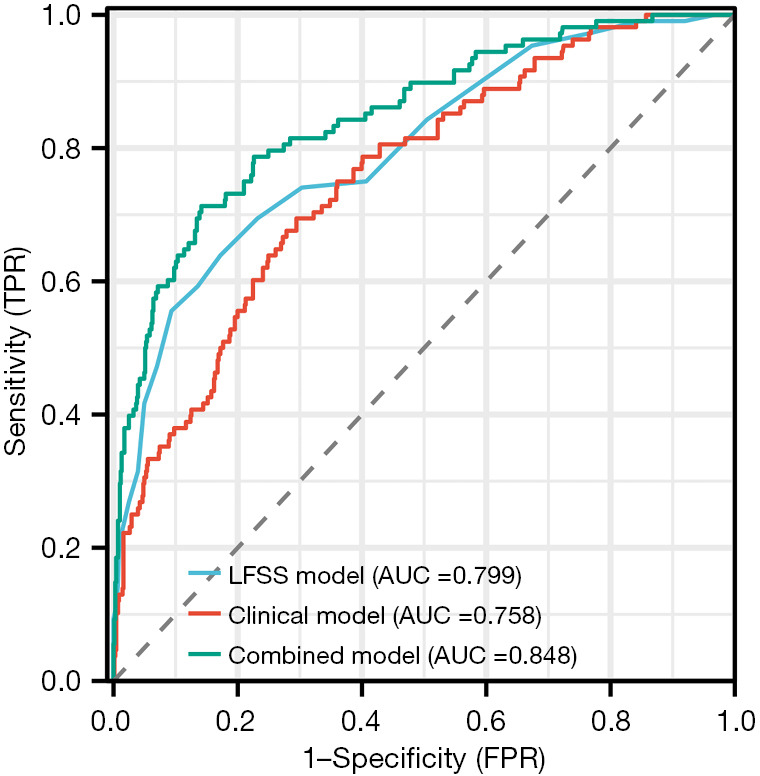
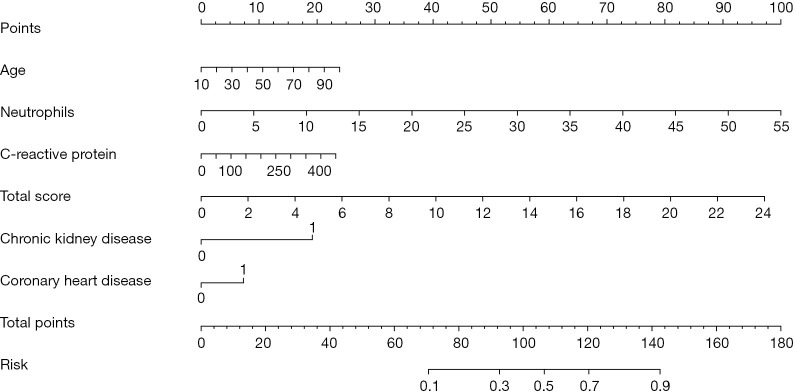
Methods: This retrospective study included 794 COVID-19 patients from two hospitals in China between December 2022 and January 2023. Six lung fields on the axial computed tomography (CT) were defined. LFSS and eighteen clinical characteristics were evaluated. LFSS was based on summing up the parenchymal opacification involving each lung field, which was scored as 0 (0%), 1 (1-24%), 2 (25-49%), 3 (50-74%), or 4 (75-100%), respectively (range of LFSS from 0 to 24). Total pneumonia burden (TPB) was calculated using the U-net model. The correlation between LFSS and TPB was analyzed. After performing logistic regression analysis, an LFSS-based model, clinical-based model and combined model were developed. Receiver operating characteristic curves were used to evaluate and compare the performance of three models.

Results: LFSS, age, chronic liver disease, chronic kidney disease, white blood cell, neutrophils, lymphocytes and C-reactive protein differed significantly between the non-critical and critical group (all P<0.05). There was a strong positive correlation of LFSS and TPB (Pearson correlation coefficient =0.767, P<0.001). The area under curves of LFSS-based model, clinical-based model and combined model were 0.799 [95% confidence interval (CI): 0.770-0.827], 0.758 (95% CI: 0.727-0.788), and 0.848 (95% CI: 0.821-0.872), respectively.

Conclusions: The LFSS derived from chest CT may be a potential new tool to help identify COVID-19 patients at high risk of progressing to critical disease.

Keywords: Coronavirus disease 2019 (COVID-19); computed tomography (CT); prediction.


Conflict of interest statement

Conflicts of Interest: All authors have completed the ICMJE uniform disclosure form (available at https://jtd.amegroups.com/article/view/10.21037/jtd-24-544/coif). The authors have no conflicts of interest to declare.

Figures

Figure 1
Figure 1
Bland-Altman plots for consistency assessment. SD, standard deviation; CCTS, chest computed tomography score; LFSS, lung field-based severity score.
Figure 2
Figure 2
Scatter plot and regression line between pneumonia burden and the corresponding lung field-based severity score. (A) Correlation between TPB and total score. (B) Correlation between LPB and left score. (C) Correlation between RPB and right score. TPB, total pneumonia burden; LPB, left pneumonia burden; RPB, right pneumonia burden.
Figure 3
Figure 3
Receiver operating characteristic curves for three models. TPR, true positive rate; FPR, false positive rate; AUC, area under the curve; LFSS, lung field-based severity score.
Figure 4
Figure 4
Corresponding nomogram for the combined model. The nomogram is constructed by combining age, neutrophils, C-reactive protein, total score, chronic kidney disease and coronary heart disease. On the point scale axis, each variable was assigned a score. The overall score was calculated by adding each score. We were able to determine the probability of critical disease using the whole-point scale.
Figure 5
Figure 5
The dynamic nomogram was applied to two examples. (A-C) A 64-year-old non-critical female patient, the dynamic nomogram shows the total points were 150, and the corresponding prediction probability of progressing to critical disease was 0.04. (D-F) A 72-year-old critical male patient, the dynamic nomogram shows the total points were 214, and the corresponding prediction probability of progressing to critical disease was 0.83.

Similar articles

Cited by

References

    1. Chen N, Zhou M, Dong X, et al. Epidemiological and clinical characteristics of 99 cases of 2019 novel coronavirus pneumonia in Wuhan, China: a descriptive study. Lancet 2020;395:507-13. 10.1016/S0140-6736(20)30211-7 - DOI - PMC - PubMed
    1. Wu Z, McGoogan JM. Characteristics of and Important Lessons From the Coronavirus Disease 2019 (COVID-19) Outbreak in China: Summary of a Report of 72 314 Cases From the Chinese Center for Disease Control and Prevention. JAMA 2020;323:1239-42. 10.1001/jama.2020.2648 - DOI - PubMed
    1. Zhang N, Xu X, Zhou LY, et al. Clinical characteristics and chest CT imaging features of critically ill COVID-19 patients. Eur Radiol 2020;30:6151-60. 10.1007/s00330-020-06955-x - DOI - PMC - PubMed
    1. Chung M, Bernheim A, Mei X, et al. CT Imaging Features of 2019 Novel Coronavirus (2019-nCoV). Radiology 2020;295:202-7. 10.1148/radiol.2020200230 - DOI - PMC - PubMed
    1. Song F, Shi N, Shan F, et al. Emerging 2019 Novel Coronavirus (2019-nCoV) Pneumonia. Radiology 2020;295:210-7. 10.1148/radiol.2020200274 - DOI - PMC - PubMed

LinkOut - more resources