. 2024 Sep 30;16(9):5663-5674.
doi: 10.21037/jtd-24-733. Epub 2024 Sep 13.

Signature stemmed from two transcription factor families determines histological fate and regulates immune infiltration in patients with lung cancer

Affiliations

Signature stemmed from two transcription factor families determines histological fate and regulates immune infiltration in patients with lung cancer

Qian Hong et al. J Thorac Dis. .

Abstract

Background: Earlier research has reported that transcription factors play a crucial role in the anti-tumorigenic immune response of lung cancer patients. The aim of this study is to determine the relationship between post-translational modifications of transcription factors and histological fate and patient prognosis.

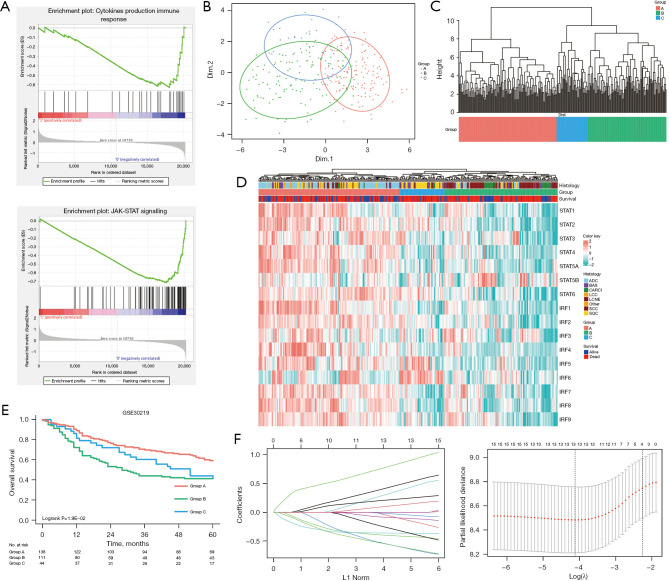
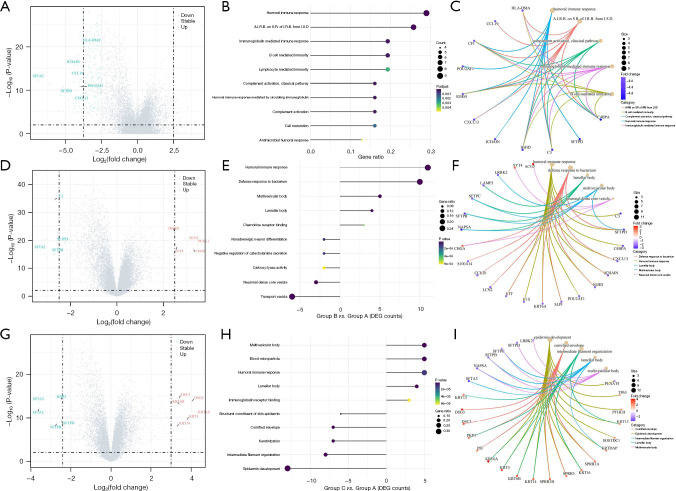
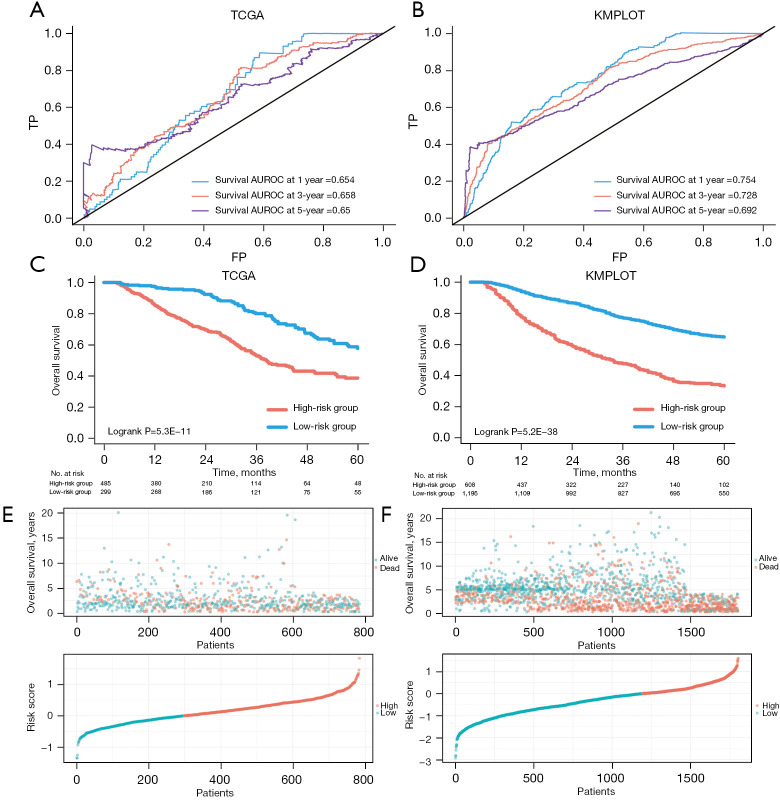
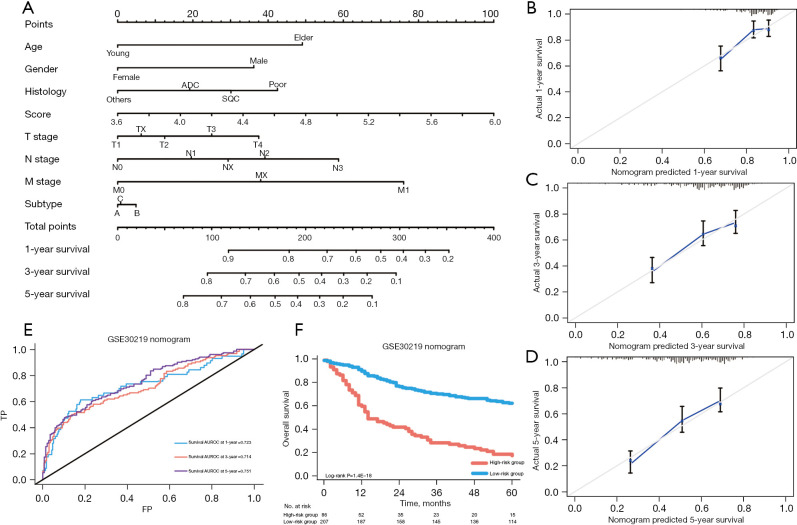
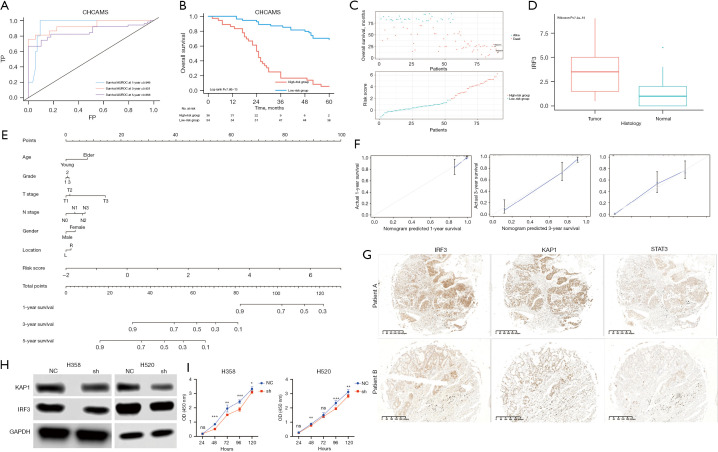
Methods: Based on the information of 293 lung cancer patients in the Gene Expression Omnibus (GEO) database, differentially expressed genes (DEGs) related to the interferon regulatory factor (IRF) and signal transducer and activator of transcription (STAT) families between patients experiencing early death and those with long-term survival were identified and characterized. A survival prediction model was established by incorporating 7 STAT genes and 9 IRF genes into the least absolute shrinkage and selection operator (LASSO) algorithm. Gene Ontology (GO) enrichment analysis indicated that these two transcription factor families can govern lung cancer tissue differentiation and predict patient prognosis. Moreover, the Cox proportional hazards regression model was applied to select the genes with the highest predictive capability to construct a gene-based signature. Lastly, the data of 1,803 and 784 lung cancer patients from the Kaplan-Meier plotter (KMPLOT) and The Cancer Genome Atlas (TCGA) databases were used to evaluate the accuracy and sensitivity of the model.

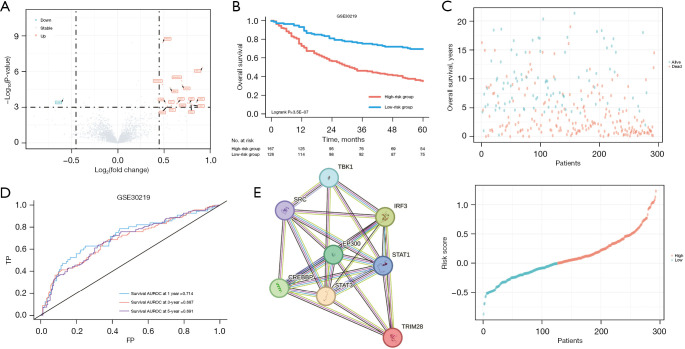
Results: Based on the minimum criterion, TRIM28, IRF3, and STAT3 were employed to generate the prognostic model. The 1-, 3-, and 5-year area under the curve (AUC) values of the three-gene-based signature showed consistent results, signifying that the model had excellent accuracy and sensitivity in predicting overall survival (OS) for patients with lung cancer. Finally, the three-gene signature and tumor-node-metastasis (TNM) staging system were combined to construct a nomogram for evaluating the OS of lung cancer patients. TRIM28 may affect the stability of IRF3. Encouragingly, the predicted OS was highly consistent with the observed OS in multiple cohorts.

Conclusions: Taken together, these findings implied that the predictive model based on the three-gene signature showed robust discriminatory performance.

Keywords: Lung cancer; biomarkers; immunology; transcriptomics.


Conflict of interest statement

Conflicts of Interest: All authors have completed the ICMJE uniform disclosure form (available at https://jtd.amegroups.com/article/view/10.21037/jtd-24-733/coif). The authors have no conflicts of interest to declare.

Figures

Figure 1
Figure 1
Concentration on IRF and STAT transcription factor family through unsupervised learning in GSE30219. (A) Lung cancer patients with different prognoses enriched into the IRF and STAT families through GSEA. (B) PCA based on two transcription factor families. (C) Hierarchical cluster on account of 16 IRF and STAT genes. (D) The expression pattern of IRF and STAT families and clinicopathological features of patients from GSE30219. (E) Kaplan-Meier survival curves of OS for three unsupervised groups in the GSE30219 cohort. (F) LASSO and partial likelihood deviance coefficient profiles of the selected genes. Dim, dimension; STAT, signal transducer and activator of transcription; IRF, interferon regulatory factor; ADC, adenocarcinoma; BAS, basaloid squamous cell carcinoma; CARCI, carcinoids; LCC, large cell carcinoma; LCNE, large cell neuroendocrine carcinoma; SCC, small cell carcinoma; SQC, squamous cell carcinoma; GSE, gene series; GSEA, gene set enrichment analysis; PCA, principal component analysis; OS, overall survival; LASSO, least absolute shrinkage and selection operator.
Figure 2
Figure 2
Differential expression and GO pathway enrichment analysis between three unsupervised groups. (A) DEGs in group A relative to group B and group C. (B) Significantly upregulated pathways in group A, which are associated with better prognosis in lung cancer patients. (C) Cnetplot of upregulated genes in group A. (D) DEGs in group A relative to group B. (E) Significantly upregulated pathways in group A and group B. (F) Cnetplot of upregulated genes in group A and group B. (G) DEGs in group A relative to group C. (H) Significantly upregulated pathways in group A and group C. (I) Cnetplot of upregulated genes in group A and group C. AIRB, adaptive immune response based; SR, somatic recombination; IRB, immune receptors built; ISD, immunoglobulin superfamily domains; DEGs, differentially expressed genes; GO, Gene Ontology.
Figure 3
Figure 3
Identification and establishment of three-gene signature combined with performance and functional analysis. (A) TRIM28, the most significant differential gene. (B) Kaplan-Meier survival curves of OS between high-risk and low-risk patients in the GSE30219 cohort. (C) The distributions of the risk score and survival status of lung cancer patients. (D) AUC values of ROC predicted 1-, 3- and 5-year OS of the signature in the GSE30219 cohort. (E) Predicting protein-protein interactions based on STRING database. TP, true positive; FP, false positive; OS, overall survival; GSE, gene series; AUC, area under the curve; ROC, receiver operating characteristic.
Figure 4
Figure 4
Validation of the predictive performance of the three-gene signature in the TCGA and KMPLOT cohorts. (A) Time-dependent ROC curves at the OS time of 1, 3, and 5 years in the TCGA cohort. (B) Time-dependent ROC curves at the OS time of 1, 3, and 5 years in the KMPLOT cohort. (C) Kaplan-Meier survival curves of OS between high-risk and low-risk patients in the TCGA cohort. (D) Kaplan-Meier survival curves of OS between high-risk and low-risk patients in the KMPLOT cohort. (E) The distributions of the risk score and survival time and status in the TCGA cohort. (F) The distributions of the risk score and survival time and status in the KMPLOT cohort. TCGA, The Cancer Genome Atlas; KMPLOT, Kaplan-Meier plotter; TP, true-positive; FP, false-positive; AUROC, area under the ROC curve; ROC, receiver operating characteristic; OS, overall survival.
Figure 5
Figure 5
Establishing a prognostic prediction model by combining clinical and transcriptome information. (A) Nomograms convey the results of prognostic models using the three-gene signature and TNM staging system to predict OS of patients with lung cancer. (B) The calibration curve for predicting patients’ OS at 1-year. (C) The calibration curve for predicting patients’ OS at 3-year. (D) The calibration curve for predicting patients’ OS at 5-year. (E) Time-dependent ROC analysis to assess the predictive function of the nomogram at 1, 3, and 5 years. (F) Kaplan-Meier survival curves of OS between high-risk and low-risk patients classified by nomogram in the GSE30219 cohort. ADC, adenocarcinoma; SQC, squamous cell carcinoma; GSE, gene series; AUROC, area under the ROC curve; ROC, receiver operating characteristic; TP, true-positive; FP, false-positive; OS, overall survival; TNM, tumor-node-metastasis.
Figure 6
Figure 6
Validation of the predictive performance and molecular biology functions of the three-gene signature in the CHCAMS cohorts. (A) Time-dependent ROC curves of prognostic models constructed by IHC scores at 1, 3, and 5 years. (B) Kaplan-Meier survival curves of OS between high-risk and low-risk patients using TMA. (C) The distributions of the risk score and survival time and status in our cohort. (D) The boxplot of IRF3 expression in cancer and adjacent tissues. (E) Nomogram prediction of OS in lung adenocarcinoma patients based on three-gene signature and clinical features. (F) The calibration curve for predicting patients’ OS at 1, 3, and 5 years. (G) Representative IHC images of high-risk group patient A and B. (H) Western blotting analysis of IRF3 and TRIM28 (KAP1) protein levels in two NSCLC cell lines. (I) CCK-8 assay to analyze the proliferative capacity of different cell lines. *, P<0.05; **, P<0.01; **, P<0.001. ns, no significance; CHCAMS, Cancer Hospital Chinese Academy of Medical Sciences; TP, true-positive; FP, false-positive; AUROC, area under the ROC curve; ROC, receiver operating characteristic; IRF, interferon regulatory factor; IHC, immunohistochemistry; OS, overall survival; TMA, tissue microarray; NC, negative control; sh, small hairpin RNA; CCK-8, cell counting kit‐8; NSCLC, non-small cell lung cancer; OD, optical density.

References

    1. Dejima H, Hu X, Chen R, et al. Immune evolution from preneoplasia to invasive lung adenocarcinomas and underlying molecular features. Nat Commun 2021;12:2722. 10.1038/s41467-021-22890-x - DOI - PMC - PubMed
    1. Allemani C, Matsuda T, Di Carlo V, et al. Global surveillance of trends in cancer survival 2000-14 (CONCORD-3): analysis of individual records for 37 513 025 patients diagnosed with one of 18 cancers from 322 population-based registries in 71 countries. Lancet 2018;391:1023-75. 10.1016/S0140-6736(17)33326-3 - DOI - PMC - PubMed
    1. O'Neill LA, Golenbock D, Bowie AG. The history of Toll-like receptors - redefining innate immunity. Nat Rev Immunol 2013;13:453-60. 10.1038/nri3446 - DOI - PubMed
    1. Zhao B, Du F, Xu P, et al. A conserved PLPLRT/SD motif of STING mediates the recruitment and activation of TBK1. Nature 2019;569:718-22. 10.1038/s41586-019-1228-x - DOI - PMC - PubMed
    1. Danaher P, Warren S, Lu R, et al. Pan-cancer adaptive immune resistance as defined by the Tumor Inflammation Signature (TIS): results from The Cancer Genome Atlas (TCGA). J Immunother Cancer 2018;6:63. 10.1186/s40425-018-0367-1 - DOI - PMC - PubMed

LinkOut - more resources