. 2024 Oct 3:14:1419528.
doi: 10.3389/fonc.2024.1419528. eCollection 2024.

Conserved allomorphs of MR1 drive the specificity of MR1-restricted TCRs

Affiliations

Conserved allomorphs of MR1 drive the specificity of MR1-restricted TCRs

Terri V Cornforth et al. Front Oncol. .

Abstract

Background: Major histocompatibility complex class-1-related protein (MR1), unlike human leukocyte antigen (HLA) class-1, was until recently considered to be monomorphic. MR1 presents metabolites in the context of host responses to bacterial infection. MR1-restricted TCRs specific to tumor cells have been described, raising interest in their potential therapeutic application for cancer treatment. The diversity of MR1-ligand biology has broadened with the observation that single nucleotide variants (SNVs) exist within MR1 and that allelic variants can impact host immunity.

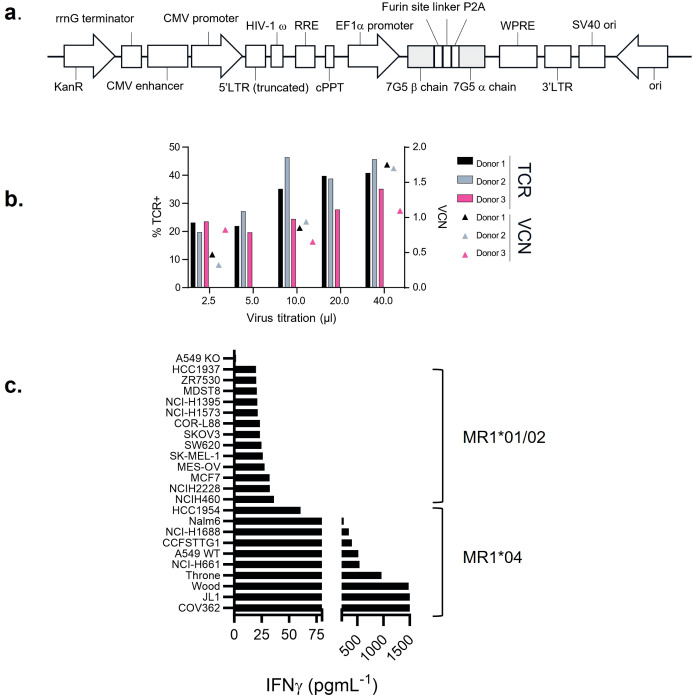
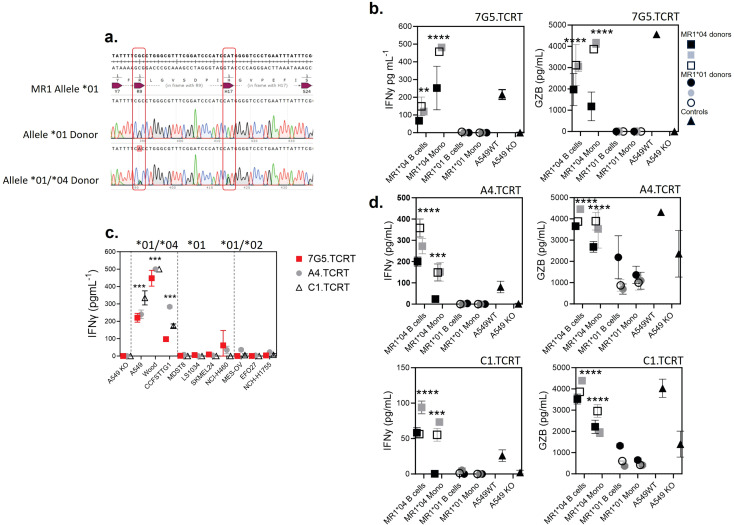
Methods: The TCR from a MR1-restricted T-cell clone, MC.7.G5, with reported cancer specificity and pan-cancer activity, was cloned and expressed in Jurkat E6.1 TCRαβ- β2M- CD8+ NF-κB:CFP NFAT:eGFP AP-1:mCherry cells or in human donor T cells. Functional activity of 7G5.TCR-T was demonstrated using cytotoxicity assays and by measuring cytokine release after co-culture with cancer cell lines with or without loading of previously described MR1 ligands. MR1 allele sequencing was undertaken after the amplification of the MR1 gene region by PCR. In vivo studies were undertaken at Labcorp Drug Development (Ann Arbor, MI, USA) or Epistem Ltd (Manchester, UK).

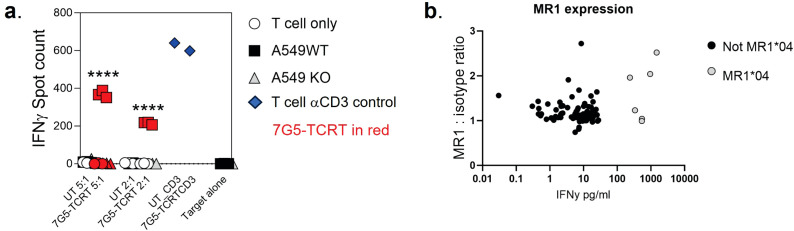
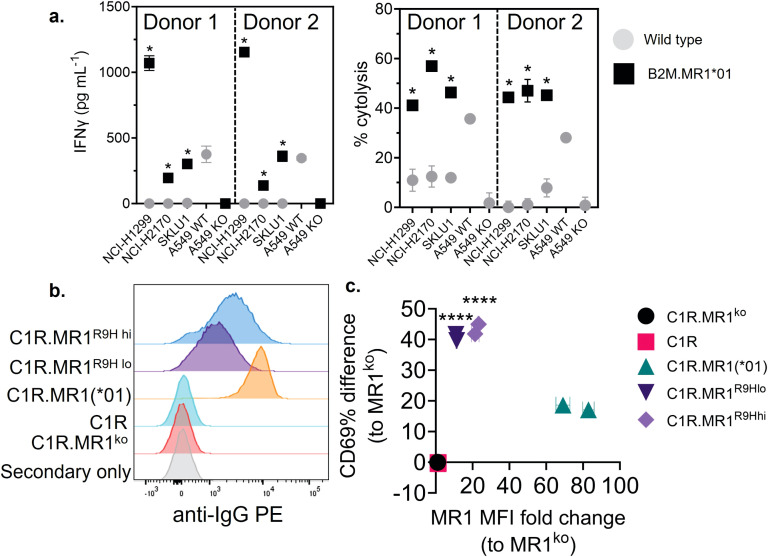
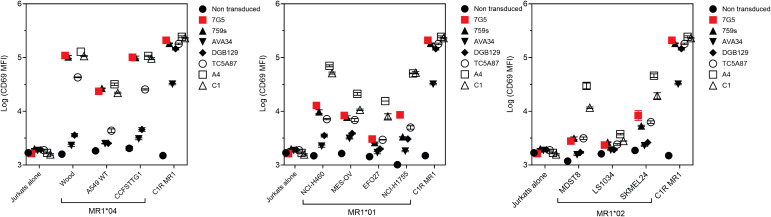
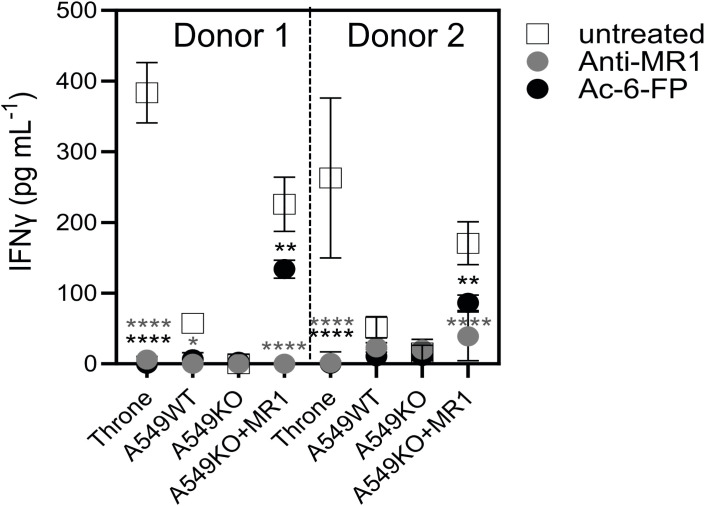
Results: The TCR cloned from MC.7.G5 retained MR1-restricted functional cytotoxicity as 7G5.TCR-T. However, activity was not pan-cancer, as initially reported with the clone MC.7.G5. Recognition was restricted to cells expressing a SNV of MR1 (MR1*04) and was not cancer-specific. 7G5.TCR-T and 7G5-like TCR-T cells reacted to both cancer and healthy cells endogenously expressing MR1*04 SNVs, which encode R9H and H17R substitutions. This allelic specificity could be overcome by expressing supraphysiological levels of the wild-type MR1 (MR1*01) in cell lines.

Conclusions: Healthy individuals harbor T cells reactive to MR1 variants displaying self-ligands expressed in cancer and benign tissues. Described "cancer-specific" MR1-restricted TCRs need further validation, covering conserved allomorphs of MR1. Ligands require identification to ensure targeting MR1 is restricted to those specific to cancer and not normal tissues. For the wider field of immunology and transplant biology, the observation that MR1*04 may behave as an alloantigen warrants further study. .

Keywords: (TCR) T-cell receptor; MR1; T-cell; alloreactive; cancer.


Conflict of interest statement

Authors TC, NM, SC, EL, TL, RW, AL, KW, ED, GM, PQY, CM, SD, SK, JS, LW, SP, DH, JD were employed by Enara Bio Ltd. The remaining authors declare that the research was conducted in the absence of any commercial or financial relationships that could be construed as a potential conflict of interest. JLN declared that they were an editorial board member of Frontiers at the time of submission. This had no impact on the peer review process and the final decision.

Figures

Figure 1
Figure 1
7G5.TCR-T preferentially targets cancer cells bearing allelic variant MR1*04. (A) Features of the lentiviral vector (LVV) used to transduce the 7G5.TCR into primary T cells. The 7G5.TCR used murine constant regions to enhance chain pairing and cell surface expression in primary T cells. A detailed map is shown in Supplementary Figure S1 . (B) Transduction efficiency of 7G5-encoding LVV in healthy CD8 T cells derived from PBMC. Staining of 7G5.TCR-T for TCRBV25 was used to assess 7G5 expression. x-Axis indicates the volume of LVV supernatant used per transduction. The right y-axis indicates the viral copy number (VCN). (C) Reactivity of 7G5.TCR-T to 24 cancer cell lines (of 133 analyzed, Supplementary Table S1 ) ranked as measured by IFN-γ ELISA at 48 h following co-culture of 20,000 target cells and 60,000 7G5-TCR-T; E:T ratio: 3:1.
Figure 2
Figure 2
(A) Potency of 7G5.TCR-T against MR1-expressing NSCLC line A549 or A549 MR1 knockout cells. ELISpot assays were used to measure IFN-γ secretion by 7G5.TCR-T cells in response to the targets at the indicated effector-to-target ratios. Representative IFN-γ ELISpot showing reactivity of 7G5.TCR-T to MR1 wild-type or MR1 knockout A549 cells. The data shown in (A) is representative of at least six biological replicates. **** p < 0.0001 statistical difference between reactivity seen with 7G5.TCR-T against A549WT cells versus A549.MR1KO, by one-way ANOVA with Tukey’s multiple comparison test. (B) MR1 expression on cancer cell lines as compared to isotype control, plotted against 7G5.TCR-T reactivity data from one donor (IFNy data expression is normalized to a response from nontransduced T cells). Data are shown as IFN-γ production from T cells following co-culture with cancer cell lines. Each point is an individual cancer cell line. Grey circles are MR1*04 cell lines, and black circles are non-MR1*04. There is no significant correlation between IFN-γ production and MR1 expression datasets as computed using nonparametric Spearman’s correlation and a two-tailed t-test (p = 0.58).
Figure 3
Figure 3
Overexpression of MR1*01 is required for reactivity of 7G5.TCR-T to cells lacking MR1*04. (A) Left panel: Mean (± SD, n = 3) IFN-γ concentration measured by ELISA in the supernatant 18–24 h following co-culture of 20,000 WT or β2m. MR1-expressing cancer lines (x-axis) and 100,000 7G5-TCR-T (E:T ratio: 5:1). MR1 haplotypes of the cells investigated; NCI-H1299 and NCI-H2170: MR1*01; SKLU1: MR1*02; A549: MR1*04/*01 heterozygous. Right: Mean (± SD, n = 3) percentage cytolysis above the background of WT or β2m. MR1-expressing cancer cell lines (x-axis) by 7G5.TCR-T cells from two donors after 24 h of co-culture. Cell numbers varied depending on target but effector-to-target ratios (E:T) remained at 5:1. * p < 0.05—significant difference between the B2M.MR1*01 and wild-type groups, as assessed by a two-tailed Wilcoxon matched-pairs signed rank test. (B) MR1 expression of C1R derivatives. Cells were stained with 8F2.F9 hybridoma supernatant, followed by antimouse IgG-PE. (C) Activation of Jurkat.β2mko.7G5 measured as %CD69hi (after subtraction of the mean %CD69hi on stimulation with C1R.MR1ko cells) vs. fold change of the median fluorescence intensity of MR1 expressed by the stimulating APC compared to C1R.MR1ko. Data are from two independent experiments. Each point represents the mean (± SD) of three in-experiment replicates for CD69 and two in-experiment replicates for MR1. ****Both C1R.MR1R9Hlo and C1R.MR1R9Hhi significantly different from C1RMR1 (*01) p < 0.0001 assessed by two-way ANOVA with Tukey’s multiple comparisons test.
Figure 4
Figure 4
Comparison of MR1 allele restriction and ligand reactivity of 7G5.TCR-T with other MR1 reactive TCRs. Log median fluorescence intensity values of CD69 surface levels on Jurkat cells expressing one of seven T-cell receptors (y-axes) after 24-h incubation with MR1*01-, MR1*02-, or MR1*04-expressing cancer cell lines (x-axes). Jurkat cells were incubated alone or with C1R cells overexpressing MR1*01 as negative and positive controls, respectively. Geometric mean (n = 3) values are plotted. Data are representative of two experimental repeats.
Figure 5
Figure 5
7G5.TCR-T function is inhibited by the bacterial ligand 6-acetyl-formylpterin. Reactivity of 7G5.TCR-T derived from two donors to cancer lines expressing MR1*04, or A549-MR1KO-negative control cells in the presence or absence of Ac-6-FP or blocking anti-MR1 antibody IFN-γ were measured by ELISA at 18 h following co-culture of 20,000 target cells and 60,000 7G5-TCR-T (E:T ratio: 3:1). Two-way ANOVA was performed with Dunnett’s multiple comparisons post-hoc test. Statistical significance compared to the untreated uncontrol is indicated as * p < 0.05, ** p < 0.01, or **** p < 0.0001.
Figure 6
Figure 6
T cells transduced with 7G5 and 7G5-like TCRs are activated by MR1*04 expressing healthy cells. (A) Sanger sequencing of the MR1 locus of two of 200 blood donors analyzed. The MR1*01 allele and MR1*04 allele differ by two nucleotide substitutions leading to R9H/H17R substitutions in the MR1*04 allele. The lower row shows a donor heterozygous for MR1*01/*04, note the miscalling of the mixed nucleotides at both positions. (B) Reactivity of one representative donor of three 7G5.TCR-T donors to monocytes and B cells derived from PBMC from three MR1*01/*04 heterozygous blood donors, and three MR1*01 homozygous donors. IFN-γ (left) and granzyme B (right) were measured by ELISA at 48 h following the co-culture of 40,000 PBMC-derived cells and 200,000 7G5.TCR-T (E:T ratio: 5:1). Grey, black, and white squares represent monocytes and B cells from three MR1*01/*04 donors. Grey, black, and white circles represent monocytes and B cells from three MR1*01 donors. Black triangles represent the positive and negative controls A549 and A549.MR1KO, respectively, one donor with nine technical replicates. ** p < 0.01 and **** p < 0.0001—significant differences between reactivity to MR1*04 targets vs. MR1*01. (C) Reactivity of the 7G5.TCR-T (red) and TCR-T expressing the 7G5-like TCRs A4 and C1 to cancer cell lines homozygous for MR1*01 or heterozygous for MR1*01 and MR1*02 or MR1*04. Reactivity was measured with IFN-γ ELISA at 48 h following the co-culture of 20,000 cancer cells and 60,000 7G5.TCR-T (E:T ratio: 3:1), and data shown are representative of two biological repeats with two separate donors for TCR-T. *** p < 0.001 by one-way ANOVA with Tukey’s multiple comparison test indicating significant differences between 7G5 and 7G5-like TCR reactivity to MR1*04 expressing targets compared to MR1*04-negative cells. (D) A4-TCR-T and C1-TCR-T reactivity of one representative of three TCR-T donors to monocytes and B cells derived from PBMC from three MR1*01/*04 heterozygous blood donors and three MR1*01 homozygous donors. IFN-γ and granzyme B were measured by ELISA at 48 h following the co-culture of 40,000 PBMC-derived cells and 200,000 7G5-TCR-T (E:T ratio: 5:1). Grey, black, and white squares represent monocytes and B cells from three MR1*01/*04 donors. Grey, black, and white circles represent monocytes and B cells from three MR1*01 donors. Black triangles represent the positive and negative controls A549 and A549.MR1KO, respectively, from one donor with nine technical replicates. *** p < 0.001 and **** p < 0.0001—significant difference between reactivity to MR1*04 targets vs. MR1*01.

Similar articles

Cited by

References

    1. Kjer-Nielsen L, Patel O, Corbett AJ, Le Nours J, Meehan B, Liu L, et al. . MR1 presents microbial vitamin B metabolites to MAIT cells. Nature. (2012) 491:717–23. doi: 10.1038/nature11605 - DOI - PubMed
    1. Corbett AJ, Eckle SBG, Birkinshaw RW, Liu L, Patel O, Mahony J, et al. . T-cell activation by transitory neo-antigens derived from distinct microbial pathways. Nature. (2014) 509:361–5. doi: 10.1038/nature13160 - DOI - PubMed
    1. Hashimoto K, Hirai M, Kurosawa Y. A gene outside the human MHC related to classical HLA class I genes. Science. (1995) 269:693–5. doi: 10.1126/science.7624800 - DOI - PubMed
    1. Legoux F, Salou M, Lantz O. Unconventional or preset αβ T cells: evolutionarily conserved tissue-resident T cells recognizing nonpeptidic ligands. Annu Rev Cell Dev Biol. (2017) 33:511–35. doi: 10.1146/annurev-cellbio-100616-060725 - DOI - PubMed
    1. Godfrey DI, Uldrich AP, McCluskey J, Rossjohn J, Moody DB. The burgeoning family of unconventional T cells. Nat Immunol. (2015) 16:1114–23. doi: 10.1038/ni.3298 - DOI - PubMed

LinkOut - more resources