. 2024 Sep 12;35(4):102332.
doi: 10.1016/j.omtn.2024.102332. eCollection 2024 Dec 10.

Engineered AAV capsid transport mutants overcome transduction deficiencies in the aged CNS

Affiliations

Engineered AAV capsid transport mutants overcome transduction deficiencies in the aged CNS

Ivette M Sandoval et al. Mol Ther Nucleic Acids. .

Abstract

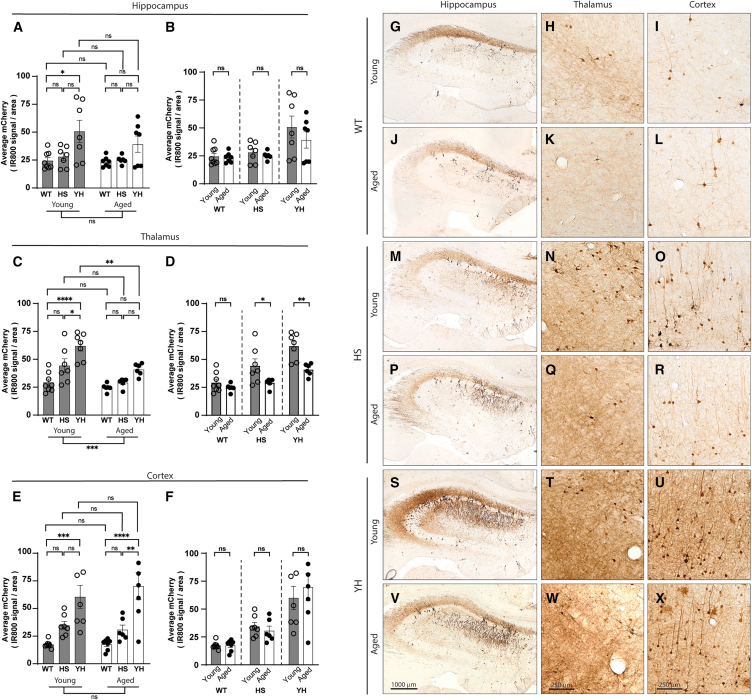
Adeno-associated virus (AAV)-based gene therapy has enjoyed great successes over the past decade, with Food and Drug Administration-approved therapeutics and a robust clinical pipeline. Nonetheless, barriers to successful translation remain. For example, advanced age is associated with impaired brain transduction, with the diminution of infectivity depending on anatomical region and capsid. Given that CNS gene transfer is often associated with neurodegenerative diseases where age is the chief risk factor, we sought to better understand the causes of this impediment. We assessed two AAV variants hypothesized to overcome factors negatively impacting transduction in the aged brain; specifically, changes in extracellular and cell-surface glycans, and intracellular transport. We evaluated a heparin sulfate proteoglycan null variant with or without mutations enhancing intracellular transport. Vectors were injected into the striatum of young adult or aged rats to address whether improving extracellular diffusion, removing glycan receptor dependence, or improving intracellular transport are important factors in transducing the aged brain. We found that, regardless of the viral capsid, there was a reduction in many of our metrics of transduction in the aged brain. However, the transport mutant was less sensitive to age, suggesting that changes in the cellular transport of AAV capsids are a key factor in age-related transduction deficiency.

Keywords: AAV; CNS; MT: Delivery Strategies; aging; capsid mutation; diffusion; receptor; retrograde transduction; transport.


Conflict of interest statement

I.M.S.: Co-founder of nVector. Has received financial support from Aspen Neurosciences. F.P.M.: Co-founder of nVector Therapeutics, CavGene Therapeutics, and Neuralina Therapeutics. Has received financial support from Regenex Bio, Aspen Neurosciences, Seelos Therapeutics. K.S.-C.: Co-founder of CavGene Therapeutics, Inc, which holds intellectual property in CaV1.3 gene silencing and has received financial support from Regenex Bio. S.E.B.: Co-founder of Atsena Therapeutics. S.L.B.: Co-founder of Atsena Therapeutics. M.D.: Co-founder of rAAVEN. D.J.M.: Has received financial support from FujiFilm Cellular Dynamics Inc and Aspen Neurosciences. Currently an employee of Biogen. I.M.S., F.P.M., S.E.B., S.L.B., and M.D. hold patents related to AAV technology.

Figures

None
Graphical abstract
Figure 1
Figure 1
Striatal transduction is negatively impacted by advanced age Young adult or aged Sprague-Dawley rats received an intrastriatal injection of WT AAV2, AAV2 HS, or AAV2 YH (2 μL of 1.0 × 1012 vg/mL). One month later, animals were euthanized, and the number of striatal transgene-positive cells were enumerated using a combination of AI-based enumeration and stereological principles. (A–F) Representative images of striatal immunoreactivity in young animals injected with WT (A; n = 8), HS (C; n = 7), and YH (E; n = 7) and aged animals injected with WT (B; n = 8), HS (D; n = 6), and YH (F; n = 7). (G) Enumeration of the total number of transduced cells in the striatum analyzed with a two-way ANOVA show a main effect of age (p = 0.001) and vector (p < 0.00001) with significantly higher transduction with either mutant. Individual comparisons correspond to post hoc Tukey HSD test. (H) When analyzed using a simple t test with age as the only independent variable, the only age-related effect was seen with HS with lesser immunoreactive cells in the aged brain. (∗p < 0.05, ∗∗p = 0.001, ∗∗∗p < 0.0005, ∗∗∗∗p < 0.0001). Scale bar in (A), 2500 μm and applies to all histograms.
Figure 2
Figure 2
Volumetric distribution In order to better understand the influence of age on striatal vector transduction we utilized the distribution of immunolabeling to outline an area of transduction and used this to calculate volume. Further we mapped transduction along the striatal rostro-caudal axis. (A) We did not observe an effect due to age, but again, both mutants transduced a much larger volume than WT. (B) No age-related effects were found when each vector was analyzed with a t test. (C) Schematic of striatum (shaded red) inside the rat brain (shaded cyan) is represented in three planes: coronal, horizontal, and sagittal. Striatum was spatially defined using reference from rat brain atlas. (D) Area transduced per section and (E) mCherry+ cells per section along the rostro-caudal axis. (F–H) Transduction represented as a heatmap for visual comparison. (F) Color scale for total mCherry+ cell counts. (G) Schematic of total mCherry+ cells per section (represented by color assigned by heatmap scale on the right) overlaid across a dorsal view of the striatum. (H) transduction distribution in striatum combined per vector (top panel) or per age (bottom panel).
Figure 3
Figure 3
Striatal transgene expression is reduced with old age Since enumeration of transgene+ cells is binary and not a full measure of infectivity, we also measured the level of transgene expression in the striatum using densitometry of near-infrared imaging. (A) To measure transgene signal, first the full striatum was outlined using TH immunoreactivity in the 680 channel, then area of mCherry+ expression was outlined using a heatmap scale in the 800 channel (B–H). Representative images of mCherry expression in young WT (C), HS (D), YH (E), and aged WT (F), HS (G), YH (H). A two-way ANOVA showed a main effect of age on both total (I) and average (signal/area; K). (J) and (L) Individual t tests showed that age negatively impacted expression in both variants but not WT. ∗p < 0.05, ∗∗p < 0.01, ∗∗∗p < 0.001, ∗∗∗∗p < 0.0001.
Figure 4
Figure 4
Transduction in the midbrain is significantly impacted by age: combination of anterograde transport of transgene to terminals and retrograde transduction of nigral cells The midbrain region containing the SN is an important target in PD. Accordingly we quantified the total level of transgene in this area. (A) A two-way ANOVA showed a main effect of age on mCherry expression, and individual t tests (B) showed that this age-related impairment in transduction was significant across all the capsid variants. Representative images of mCherry immunoreactivity in the SN (low magnification; left panels), SNc (middle panels), and SNr (right panels) from Young WT (C–E), Aged WT (F–H), Young HS (I–K), Aged HS (L–N), Young YH (O–Q), and Aged YH (R–T). ∗p < 0.05, ∗∗p < 0.01, ∗∗∗∗p < 0.0001. Scale bar in (R), 500 μm and applies to (C), (F), (I), (L), (O), and (R). Scale bars in (S) and (T), 50 μm and applies to (D), (E), (G), (H), (J), (K), (M), (N), (P), (Q), (S), and (T).
Figure 5
Figure 5
Retrograde transduction is significantly impacted by advanced age Although our main anatomical target was the striatum, we also wanted to better understand the degree of infection of striatal projection areas. To that end, we outlined transduced areas of the thalamus, hippocampus (HC), and cortex (CTX) and quantified expression levels using LI-COR-assisted near-infrared densitometry. We observed a main effect of age in the thalamus (A), but not hippocampus (C) or cortex (E). Individual t tests showed a significant reduction in transgene expression in the aged thalamus across all mutant capsids (D), an effect that was not seen in the hippocampus (B) or cortex (F). Representative images of mCherry immunoreactivity in the dorsal hippocampus (left panels), medial thalamus (middle panels), and somatosensory cortex (right panels). ∗p < 0.05, ∗∗p < 0.01, ∗∗∗p < 0.001, ∗∗∗∗p < 0.0001. Scale bar in (V), 1000 μm and applies to (G), (J), (M), (P), (S), and (V). Scale bars in (W) and (X), 250 μm and applies to (H), (I), (K), (L), (N), (O), (Q), (R), (T), (U), (W), and (X).
Figure 6
Figure 6
In situ hybridization of viral genomes Striatal tissue sections for each one of the groups were processed for detection of AAV viral genomes (ISH- brown puncta) and counterstained with thionin for identification of nuclei (blue). Representative images at low and high magnification, respectively, are shown, arranged as follows: WT Young (A and B), WT Aged (C and D), HS Young (E and F), HS Aged (G and H), YH Young (I and J), YH Aged (K and L). Low-magnification images depict distribution of AAV genomes across the striatum. High-magnification images show localization of AAV genomes relative to nuclei. Black arrows indicate examples of single AAV inside a nucleus, red arrowheads indicate examples multiple genomes inside a single nucleus, and yellow arrowheads indicate examples of non-nuclear viral genomes. Scale bar in (A), 100 μm, applies to all low-magnification images (C, E, G, I, and K). Scale bar in B, 10 μm, applies to all high-magnification insets (B, D, F, H, and J).

References

    1. Al-Zaidy S., Pickard A.S., Kotha K., Alfano L.N., Lowes L., Paul G., Church K., Lehman K., Sproule D.M., Dabbous O., et al. Health outcomes in spinal muscular atrophy type 1 following AVXS-101 gene replacement therapy. Pediatr. Pulmonol. 2019;54:179–185. doi: 10.1002/ppul.24203. - DOI - PMC - PubMed
    1. Bartus R.T., Herzog C.D., Chu Y., Wilson A., Brown L., Siffert J., Johnson E.M., Jr., Olanow C.W., Mufson E.J., Kordower J.H. Bioactivity of AAV2-neurturin gene therapy (CERE-120): differences between Parkinson's disease and nonhuman primate brains. Mov. Disord. 2011;26:27–36. doi: 10.1002/mds.23442. - DOI - PMC - PubMed
    1. Chu Y., Bartus R.T., Manfredsson F.P., Olanow C.W., Kordower J.H. Long-term post-mortem studies following neurturin gene therapy in patients with advanced Parkinson's disease. Brain. 2020;143:960–975. doi: 10.1093/brain/awaa020. - DOI - PMC - PubMed
    1. Marks W.J., Jr., Bartus R.T., Siffert J., Davis C.S., Lozano A., Boulis N., Vitek J., Stacy M., Turner D., Verhagen L., et al. Gene delivery of AAV2-neurturin for Parkinson's disease: a double-blind, randomised, controlled trial. Lancet Neurol. 2010;9:1164–1172. doi: 10.1016/S1474-4422(10)70254-4. - DOI - PubMed
    1. Fischer D.L., Gombash S.E., Kemp C.J., Manfredsson F.P., Polinski N.K., Duffy M.F., Sortwell C.E. Viral Vector-Based Modeling of Neurodegenerative Disorders: Parkinson's Disease. Methods Mol. Biol. 2016;1382:367–382. doi: 10.1007/978-1-4939-3271-9_26. - DOI - PubMed

LinkOut - more resources