. 2024 Nov 5;96(44):17789-17799.
doi: 10.1021/acs.analchem.4c04162. Epub 2024 Oct 24.

Exploring the Impact of In Vitro-Transcribed mRNA Impurities on Cellular Responses

Affiliations

Exploring the Impact of In Vitro-Transcribed mRNA Impurities on Cellular Responses

Julien Camperi et al. Anal Chem. .

Abstract

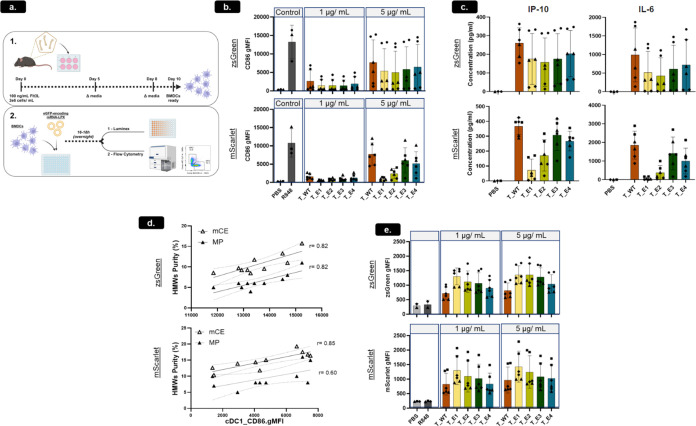
Advances in mRNA technology have enabled mRNA-based therapies to enter a new era of medicine. Such therapies benefit from a single, standardized in vitro transcription (IVT) manufacturing process applicable to a wide range of targets. This process includes several downstream purification steps, which aim to eliminate impurities that potentially affect safety and efficacy. However, it is not fully understood which impurities are the most critical; hence, some efforts are still needed to establish the correlation between RNA impurities and their role in limiting therapeutic efficacy. To study this relationship, we produced in vitro-transcribed mRNAs using several bacteriophage T7 RNA polymerases, including one wild-type and four engineered variants. Important attributes of the mRNA such as integrity, purity, and functional activity were then measured using advanced physicochemical and cellular assays. For impurities including abortive transcripts, mRNAs containing partial poly(A) tails, and double-stranded (ds)RNA byproducts, structure-function relationships have been established by tracking cellular responses (i.e., protein expression, reactogenicity) in multiple cell models. By varying the T7 RNA polymerase, different levels of sense-antisense dsRNA byproducts were measured by mass photometry, contributing directly to immunological reactogenicity in bone marrow-derived dendritic cells. T7 RNA polymerase differences with regard to short (<20 nucleotides) 3'-loopback dsRNA byproducts were also further investigated using native mass spectrometry by precisely resolving these impurities at the nucleotide level. Overall, this study highlights the importance of developing sensitive and advanced analytical methods to characterize IVT mRNA impurities and understand their interaction with cellular machinery in order to ensure quality control of RNA-based therapies.


Conflict of interest statement

The authors declare no competing financial interest.

Figures

Figure 1
Figure 1
Impact of mRNA purity on translation efficiency. Purity determination of zsGreen mRNAs produced using five different T7 RNAPs (one wild-type, T_WT; four engineered, T_E) by CGE-LIF (a, top) and IP-RP HPLC/UV (a, bottom) methods. (b) For each RNAP T7 polymerase (each represented by a different color), two batches of mRNA have been synthesized. Prepeak, main peak, and postpeak regions are represented by dotted, plained, and stripped histograms, respectively, for both CGE-LIF (b, top) and IP-RP HPLC/UV (b, bottom). (c) The zsGreen protein expression levels obtained from Hu moDCs (gMFI) are represented with histograms (N = 2 donors). (d) Representation of correlation between the IP-RP HPLC purity (prepeak %, solid triangles, and main peak %, open triangles) according to the zsGreen protein expression level (gMFI). (e) IP-RP HPLC purity (%) for eGFP mRNA samples with different poly(A) tail lengths (90, 110, and 160 adenosine residues) are represented with histograms (prepeak, main peak, and postpeak regions are represented by dotted, plained, and stripped histograms, respectively). Each eGFP mRNA sample is represented by a color. Panel (f) represents the eGFP protein expression (%) for the mRNA with different poly(A) tail sizes over time (from 0 to 14 days). Histograms show mean ± SEM for N = 2. Correlations are defined by using the Pearson correlation coefficient (r).
Figure 2
Figure 2
Analysis of HMWs and their impact on protein expression. (a) Mass photometry profiles are obtained for zsGreen mRNA synthesized using the five T7 RNAPs, including a stress T_WT sample (70 °C, 10 min, black-stripped profile). (b) HMW species (%) are represented for MP (two panels on the left) and mCE (two panels on the right) and for two mRNA sequences: zsGreen and mScarlet (top and bottom panels, respectively). (c, d) Human CD8+ T cells (N = 2 donors: donor#1 is represented on the left and donor#2 on the right) have been transfected with heated (70 °C, 10 min) or nonheated mRNA samples (T_WT, T_E1, T_E2, T_E3, and T_E4). The levels of zsGreen protein expression (% positive cells) are reported over time (from day 1 to day 15). Histograms show mean ± SEM for N = 2.
Figure 3
Figure 3
Functional analysis of the different mRNAs derived from different T7 RNAP using the mRNA-LPX complex in BMDCs. (a) Experimental schema showing BMDC, mRNA-LPX preparation, and analytic measurements. See Figure S6 for the gating strategy. (b) Protein expression of the cell surface activation marker CD86 measured on cDC1 BMDCs by flow cytometry (gMFI denotes the geometric mean fluorescence intensity). PBS indicates nontreated BMDC control. The small molecule TLR7/8 agonist R848 was included as a positive control for innate immune activation via an RNA-sensing pattern recognition receptor. (c) Cytokines measured in the cell culture supernatant by Luminex. N = 6 in 3 independent experiments; data points with shared symbols indicate mRNA technical replicates. (d) Scatter plots demonstrating the correlation between innate immune activation indicated by CD86 expression on BMDCs (x-axis) and HMW purity measured by MP or mCE (y-axis). Top, zsGreen; bottom, mScarlet. Representative data from 2 of 3 experiments. (e) Median fluorescence intensity (MFI) of zsGreen (top) or mScarlet (bottom) among fluorescent-protein-expressing cDC2 BMDCs.
Figure 4
Figure 4
Determination of 3′-heterogeneity and 3′-loopback dsRNA byproducts by native mass spectrometry. (a) Superposition of the deconvoluted spectra of mRNA_T without poly(A) synthesized by 5 different T7 polymerases, showing the presence of n + 1/n + 2 3′-heterogeneity transcript in blue and the presence of 3′-loopback dsRNA in orange with a mass difference of 2517 and 5074 Da corresponding to 8 and 16 nucleotide residues. (b) 3′-Heterogeneity transcripts (AU) are represented for the five different mRNA (n, n + 1, and n + 2 are represented as white, gray, and black dots, respectively). (c) 3′-Loopback dsRNA (AU) are represented (open triangles) for the five different mRNAs.

References

    1. Androsavich J. R. Frameworks for Transformational Breakthroughs in RNA-Based Medicines. Nat. Rev. Drug Discovery 2024, 23 (6), 421–444. 10.1038/s41573-024-00943-2. - DOI - PubMed
    1. Wolff J. A.; Malone R. W.; Williams P.; Chong W.; Acsadi G.; Jani A.; Felgner P. L. Direct Gene Transfer into Mouse Muscle in Vivo. Science 1990, 247 (4949), 1465–1468. 10.1126/science.1690918. - DOI - PubMed
    1. Sahin U.; Karikó K.; Türeci Ö. mRNA-Based Therapeutics—Developing a New Class of Drugs. Nat. Rev. Drug Discovery 2014, 13 (10), 759–780. 10.1038/nrd4278. - DOI - PubMed
    1. Kowalski P. S.; Rudra A.; Miao L.; Anderson D. G. Delivering the Messenger: Advances in Technologies for Therapeutic mRNA Delivery. Mol. Ther. 2019, 27 (4), 710–728. 10.1016/j.ymthe.2019.02.012. - DOI - PMC - PubMed
    1. Parhiz H.; Atochina-Vasserman E. N.; Weissman D. mRNA-Based Therapeutics: Looking beyond COVID-19 Vaccines. Lancet 2024, 403 (10432), 1192–1204. 10.1016/S0140-6736(23)02444-3. - DOI - PubMed

LinkOut - more resources