

Pooled analysis of oral microbiome profiles defines robust signatures associated with periodontitis
- PMID: 39445812
- PMCID: PMC11575188
- DOI: 10.1128/msystems.00930-24
Pooled analysis of oral microbiome profiles defines robust signatures associated with periodontitis
Abstract
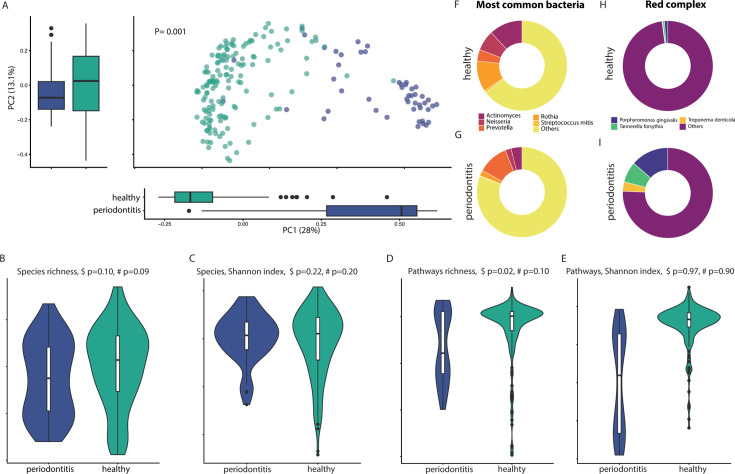
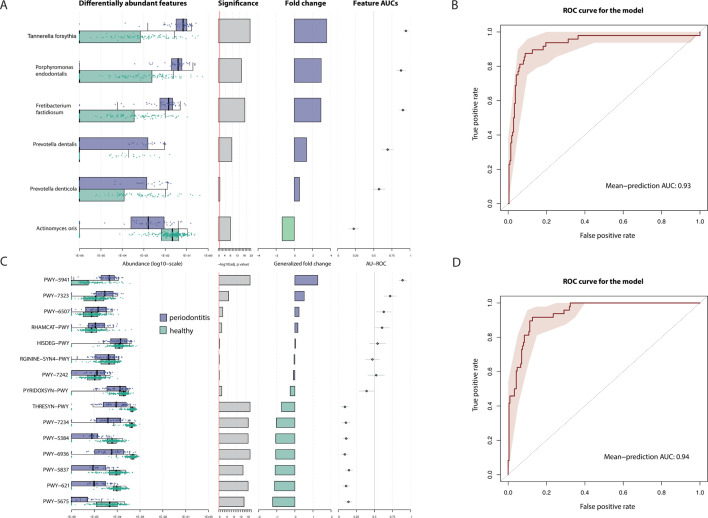
Oral microbial dysbiosis has been associated with periodontitis in studies using 16S rRNA gene sequencing analysis. However, this technology is not sufficient to consistently separate the bacterial species to species level, and reproducible oral microbiome signatures are scarce. Obtaining these signatures would significantly enhance our understanding of the underlying pathophysiological processes of this condition and foster the development of improved therapeutic strategies, potentially personalized to individual patients. Here, we sequenced newly collected samples from 24 patients with periodontitis, and we collected available oral microbiome data from 24 samples in patients with periodontitis and from 214 samples in healthy individuals (n = 262). Data were harmonized, and we performed a pooled analysis of individual patient data. By metagenomic sequencing of the plaque microbiome, we found microbial signatures for periodontitis and defined a periodontitis-related complex, composed by the most discriminative bacteria. A simple two-factor decision tree, based on Tannerella forsythia and Fretibacterium fastidiosum, was associated with periodontitis with high accuracy (area under the curve: 0.94). Altogether, we defined robust oral microbiome signatures relevant to the pathophysiology of periodontitis that can help define promising targets for microbiome therapeutic modulation when caring for patients with periodontitis.
Importance: Oral microbial dysbiosis has been associated with periodontitis in studies using 16S rRNA gene sequencing analysis. However, this technology is not sufficient to consistently separate the bacterial species to species level, and reproducible oral microbiome signatures are scarce. Here, using ultra-deep metagenomic sequencing and machine learning tools, we defined a simple two-factor decision tree, based on Tannerella forsythia and Fretibacterium fastidiosum, that was highly associated with periodontitis. Altogether, we defined robust oral microbiome signatures relevant to the pathophysiology of periodontitis that can help define promising targets for microbiome therapeutic modulation when caring for patients with periodontitis.
Keywords: dysbiosis; microbiome; periodontitis; signature.
Conflict of interest statement
The authors declare no conflict of interest.
Figures


References
MeSH terms
Substances
Grants and funding
LinkOut - more resources
Full Text Sources
