

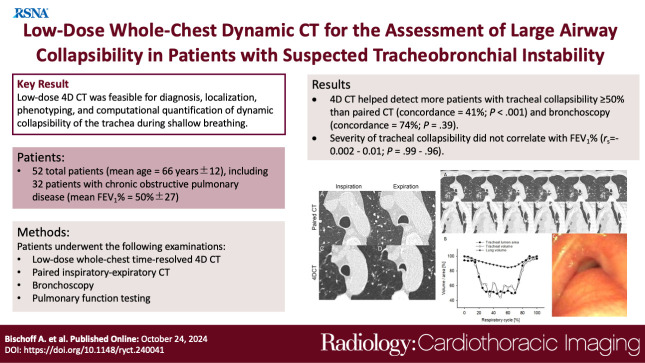
Low-Dose Whole-Chest Dynamic CT for the Assessment of Large Airway Collapsibility in Patients with Suspected Tracheobronchial Instability
- PMID: 39446043
- PMCID: PMC11540292
- DOI: 10.1148/ryct.240041
Low-Dose Whole-Chest Dynamic CT for the Assessment of Large Airway Collapsibility in Patients with Suspected Tracheobronchial Instability
Abstract
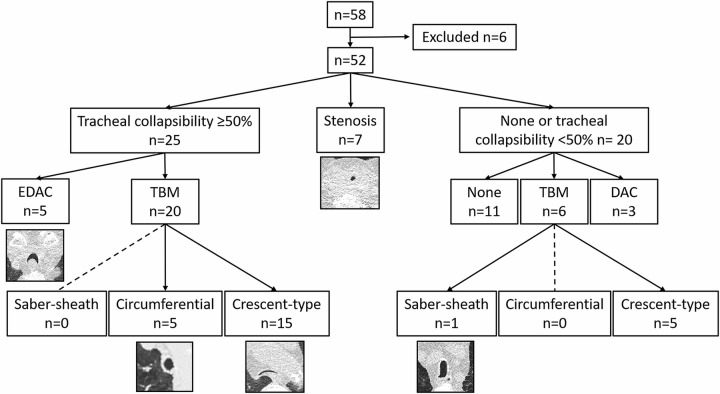
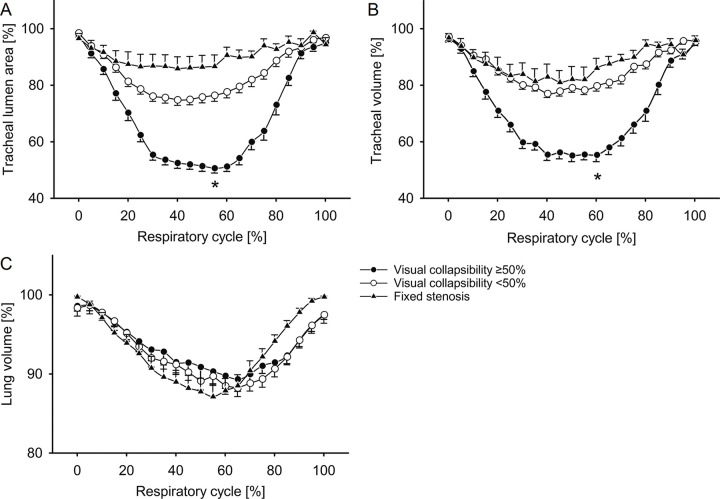
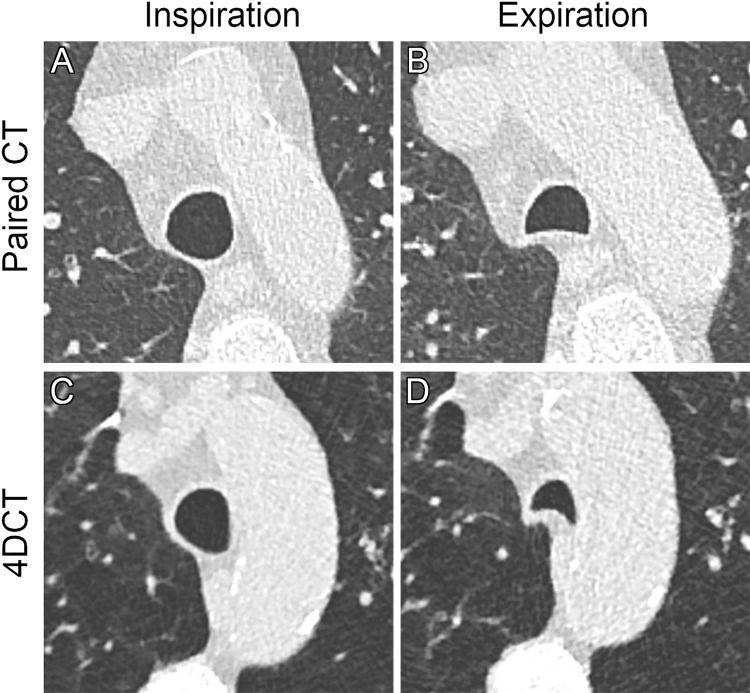
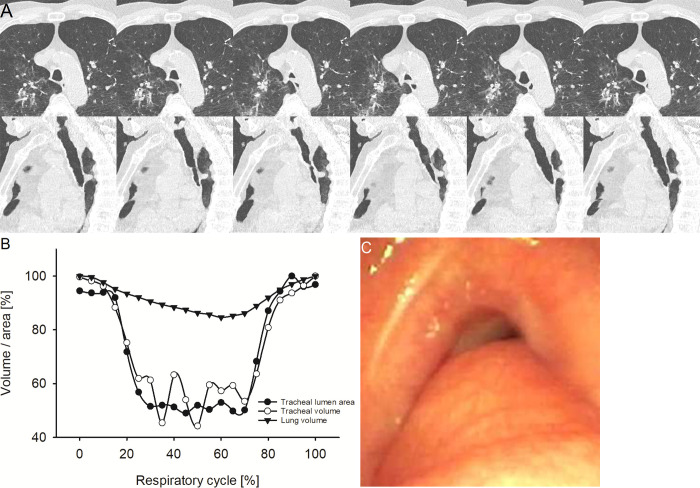
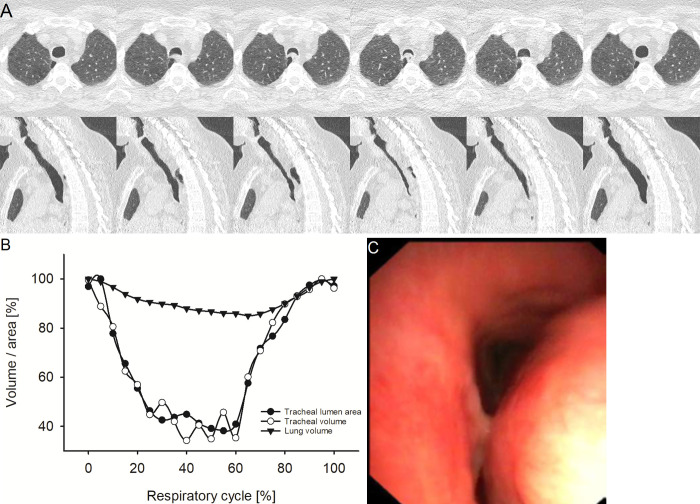
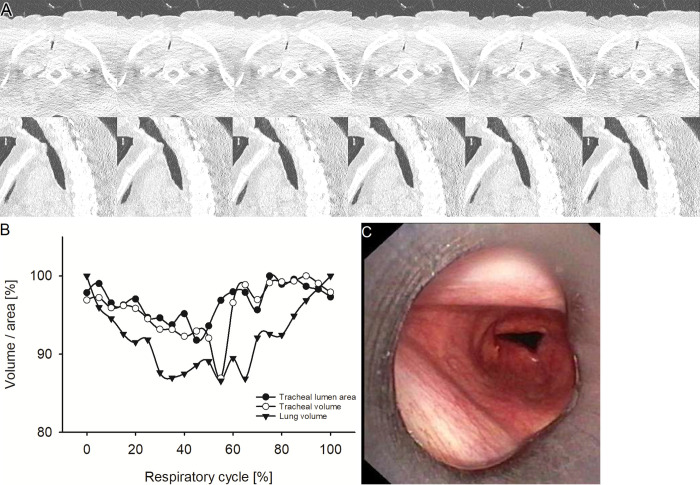
Purpose To quantify tracheal collapsibility using low-dose four-dimensional (4D) CT and to compare visual and quantitative 4D CT-based assessments with assessments from paired inspiratory-expiratory CT, bronchoscopy, and spirometry. Materials and Methods The authors retrospectively analyzed 4D CT examinations (January 2016-December 2022) during shallow respiration in 52 patients (mean age, 66 years ± 12 [SD]; 27 female, 25 male), including 32 patients with chronic obstructive pulmonary disease (mean forced expiratory volume in 1 second percentage predicted [FEV1%], 50% ± 27), with suspected tracheal collapse. Paired CT data were available for 27 patients and bronchoscopy data for 46 patients. Images were reviewed by two radiologists in consensus, classifying patients into three groups: 50% or greater tracheal collapsibility, less than 50% collapsibility, or fixed stenosis. Changes in minimal tracheal lumen area, tracheal volume, and lung volume from inspiration to expiration were quantified using YACTA software. Tracheal collapsibility between groups was compared employing one-way analysis of variance (ANOVA). For related samples within one group, ANOVA with repeated measures was used. Spearman rank order correlation coefficient was calculated for collapsibility versus pulmonary function tests. Results At 4D CT, 25 of 52 (48%) patients had tracheal collapsibility of 50% or greater, 20 of 52 (38%) less than 50%, and seven of 52 (13%) had fixed stenosis. Visual assessment of 4D CT detected more patients with collapsibility of 50% or greater than paired CT, and concordance was 41% (P < .001). 4D CT helped identify more patients with tracheal collapsibility of 50% or greater than did bronchoscopy, and concordance was 74% (P = .39). Mean collapsibility of tracheal lumen area and volume at 4D CT were higher for 50% or greater visually assessed collapsibility (area: 53% ± 9 and lumen: 52% ± 10) compared with the less than 50% group (27% ± 9 and 26% ± 6, respectively) (P < .001), whereas both tracheal area and volume were stable for the fixed stenosis group (area: 16% ± 12 and lumen: 21% ± 11). Collapsibility of tracheal lumen area and volume did not correlate with FEV1% (rs = -0.002 to 0.01, P = .99-.96). Conclusion The study demonstrated that 4D CT is feasible and potentially more sensitive than paired CT for central airway collapse. Expectedly, FEV1% was not correlated with severity of tracheal collapsibility. Keywords: CT-Quantitative, Tracheobronchial Tree, Chronic Obstructive Pulmonary Disease, Imaging Postprocessing, Thorax Supplemental material is available for this article. © RSNA, 2024.
Keywords: CT-Quantitative; Chronic Obstructive Pulmonary Disease; Imaging Postprocessing; Thorax; Tracheobronchial Tree.
Conflict of interest statement
Figures
References
-
- Aquino SL , Shepard JA , Ginns LC , et al . Acquired tracheomalacia: detection by expiratory CT scan . J Comput Assist Tomogr 2001. ; 25 ( 3 ): 394 – 399 . - PubMed
-
- Boiselle PM , Litmanovich DE , Michaud G , et al . Dynamic expiratory tracheal collapse in morbidly obese COPD patients . COPD 2013. ; 10 ( 5 ): 604 – 610 . - PubMed
-
- Kauczor HU , Wielpütz MO , Owsijewitsch M , Ley-Zaporozhan J . Computed tomographic imaging of the airways in COPD and asthma . J Thorac Imaging 2011. ; 26 ( 4 ): 290 – 300 . - PubMed
MeSH terms
LinkOut - more resources
Full Text Sources
