Review
. 2024 Oct;6(5):e240142.
doi: 10.1148/ryct.240142.

Impactful Cardiac CT and MRI Articles from 2023

Affiliations
Review

Impactful Cardiac CT and MRI Articles from 2023

Fionn Coughlan et al. Radiol Cardiothorac Imaging. 2024 Oct.

Abstract

Cardiac imaging is important in diagnosing, treating, and predicting prognosis in patients with cardiovascular disease. Imaging protocols and analysis are consistently evolving, and the implementation of artificial intelligence-based applications is of increasing interest. This review presents recent advancements in noninvasive cardiac imaging, specifically focusing on cardiac CT and MRI, from notable publications across multidisciplinary journals in 2023 of interest to both radiologists and referring clinicians in the field. The discussion encompasses the latest trials of CT fractional flow reserve and the performance of the newest generation of photon-counting detector CT, particularly in coronary stenosis quantification. Additionally, it addresses coronary plaque quantification using artificial intelligence applications and their implications from large patient cohorts, alongside prognostic outcomes, and the value of coronary artery calcification scores. Various aspects of CT trials, such as anatomic planning before revascularization, high-risk plaque features, outcomes, and pericoronary fat index, are evaluated. New insights from cardiac MRI trials for cardiomyopathies, including cardiac amyloidosis, dilated cardiomyopathy, hypertrophic cardiomyopathy, myocarditis, and valvular disease, are also outlined. The review concludes by highlighting impactful societal statements and guidelines. Keywords: CT Angiography, MR Imaging, Transcatheter Aortic Valve Implantation/Replacement (TAVI/TAVR), Cardiac, Coronary Arteries, Heart, Left Ventricle © RSNA, 2024.

Keywords: CT Angiography; Cardiac; Coronary Arteries; Heart; Left Ventricle; MR Imaging; Transcatheter Aortic Valve Implantation/Replacement (TAVI/TAVR).


Conflict of interest statement

Disclosures of conflicts of interest: F.C. No relevant relationships. S.F. No relevant relationships. A.H. No relevant relationships. S.C. No relevant relationships. J.A.L. Consulting fees from HeartFlow, Arineta, and Circle CVI; stock or stock options in HeartFlow and Circle CVI; deputy editor for Radiology: Cardiothoracic Imaging. J.D.D. Associate editor for Radiology; member of the Radiology: Cardiothoracic Imaging editorial board; author in the Stat-Dx book “Series Diagnostic Imaging - Cardiovascular” and the text book “CT and MRI in Cardiology” (Elsevier).

Figures

Images in a 66-year-old male individual after percutaneous coronary
intervention of the left anterior descending artery. (A, B) On coronary CT
angiogram, edge of stent and calcified and noncalcified plaque all appear
sharper using (B) super-resolution deep learning reconstruction (SR-DLR)
than using (A) conventional deep learning reconstruction (C-DLR). (C)
Invasive coronary angiogram (ICA) demonstrates mild stenosis in the left
anterior descending artery. The study highlights the improving capabilities
of SR-DLRs to improve coronary image reading. (Reprinted, with permission,
from reference 2.)
Figure 1:
Images in a 66-year-old male individual after percutaneous coronary intervention of the left anterior descending artery. (A, B) On coronary CT angiogram, edge of stent and calcified and noncalcified plaque all appear sharper using (B) super-resolution deep learning reconstruction (SR-DLR) than using (A) conventional deep learning reconstruction (C-DLR). (C) Invasive coronary angiogram (ICA) demonstrates mild stenosis in the left anterior descending artery. The study highlights the improving capabilities of SR-DLRs to improve coronary image reading. (Reprinted, with permission, from reference .)
The Prospective Randomized Trial of the Optimal Evaluation of Cardiac
Symptoms and Revascularization (PRECISE) study evaluated the clinical
utility of CT in the stable chest pain setting evaluating whether a combined
CT and CT-FFR strategy would impact catheterization laboratory efficiency
and incident major adverse clinical events (MACE) compared with the usual
testing pathways. Each phase of the PRECISE trial is outlined in A, a key
point being that the low pretest probability group (20.2%) underwent
deferred testing. Kaplan-Meier curves at a median of 11.8 months show (B)
the primary composite end point (death from any cause, nonfatal myocardial
infarction [MI], invasive catheterization without obstructive coronary
artery disease [CAD]) and (C) death or nonfatal MI. The insets show the same
data on an enlarged y-axis. The most important results were that
catheterization without obstructive CAD was improved using CT-FFR and there
was no statistically significant impact on safety (death, nonfatal MI) at 1
year. CT-FFR = CT fractional flow reserve, PMRS = Prospective Multicenter
Imaging Study for Evaluation of Chest Pain minimal risk score. (Adapted,
with permission under a CC BY-NC-ND 4.0 license, from reference
3.)
Figure 2:
The Prospective Randomized Trial of the Optimal Evaluation of Cardiac Symptoms and Revascularization (PRECISE) study evaluated the clinical utility of CT in the stable chest pain setting evaluating whether a combined CT and CT-FFR strategy would impact catheterization laboratory efficiency and incident major adverse clinical events (MACE) compared with the usual testing pathways. Each phase of the PRECISE trial is outlined in A, a key point being that the low pretest probability group (20.2%) underwent deferred testing. Kaplan-Meier curves at a median of 11.8 months show (B) the primary composite end point (death from any cause, nonfatal myocardial infarction [MI], invasive catheterization without obstructive coronary artery disease [CAD]) and (C) death or nonfatal MI. The insets show the same data on an enlarged y-axis. The most important results were that catheterization without obstructive CAD was improved using CT-FFR and there was no statistically significant impact on safety (death, nonfatal MI) at 1 year. CT-FFR = CT fractional flow reserve, PMRS = Prospective Multicenter Imaging Study for Evaluation of Chest Pain minimal risk score. (Adapted, with permission under a CC BY-NC-ND 4.0 license, from reference .)
(A) Artificial Intelligence–Enabled Quantitative Coronary
Plaque Analysis (AI-QCPA; HeartFlow) at CT in a study of 11 808
patients provides age- and sex-stratified percentile nomograms for coronary
plaque volumes from quantitative coronary analysis for reference. (B)
Distribution of total plaque volume reported in deciles by age and total
population. (C) Percentage of calcified plaque and noncalcified plaque
volumes by age in the entire population. (D) Prevalence of calcified plaque
and noncalcified plaque and of noncalcified plaque without coronary
calcifications by age in the entire population. (Adapted, with permission
under a CC BY-NC-ND 4.0 license, from reference 8.)
Figure 3:
(A) Artificial Intelligence–Enabled Quantitative Coronary Plaque Analysis (AI-QCPA; HeartFlow) at CT in a study of 11 808 patients provides age- and sex-stratified percentile nomograms for coronary plaque volumes from quantitative coronary analysis for reference. (B) Distribution of total plaque volume reported in deciles by age and total population. (C) Percentage of calcified plaque and noncalcified plaque volumes by age in the entire population. (D) Prevalence of calcified plaque and noncalcified plaque and of noncalcified plaque without coronary calcifications by age in the entire population. (Adapted, with permission under a CC BY-NC-ND 4.0 license, from reference .)
Through 10-year follow-up, artificial intelligence–guided
coronary CT angiography (AI-QCT)–guided plaque staging based on
percentage atheroma volume (PAV) (left) showed important prognostic value
for atherosclerotic cardiovascular disease (CVD) (middle) and provided
important reclassification benefit compared with clinical risk
characteristics and coronary artery calcium scoring (CACS) (right). AUC =
area under the receiver operating characteristic curve, CAD = coronary
artery disease, MACE = major adverse cardiac events, NRI = net
reclassification improvement. (Adapted, with permission under a CC BY-NC-ND
4.0 license, from reference 9.)
Figure 4:
Through 10-year follow-up, artificial intelligence–guided coronary CT angiography (AI-QCT)–guided plaque staging based on percentage atheroma volume (PAV) (left) showed important prognostic value for atherosclerotic cardiovascular disease (CVD) (middle) and provided important reclassification benefit compared with clinical risk characteristics and coronary artery calcium scoring (CACS) (right). AUC = area under the receiver operating characteristic curve, CAD = coronary artery disease, MACE = major adverse cardiac events, NRI = net reclassification improvement. (Adapted, with permission under a CC BY-NC-ND 4.0 license, from reference .)
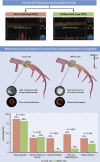
The Precise Percutaneous Coronary Intervention Plan (P3) trial
evaluated the relationship between atherosclerotic plaque phenotypes and
focal and diffuse coronary artery disease (CAD) defined by coronary
hemodynamics. The study included patients with hemodynamically significant
CAD based on fractional flow reserve (FFR), with plaque characterization
based on CT and optical coherence tomography (OCT). Using an OCT pullback
pressure gradient (PPG) index, patients were divided into focal (PPG
> 0.66) or diffuse (PPG ≤ 0.66) CAD (upper panel). Plaque
phenotypes were subsequently analyzed at CT and OCT (middle panel). The
graph shows vessels with focal CAD (red bars) had a higher plaque burden and
predominantly lipid-rich plaque with a high prevalence of high-risk thin-cap
fibroatheroma, whereas calcifications were the hallmark of vessels with
diffuse disease (green bars). The study highlights the different plaque
subtypes in focal versus diffuse disease, which may influence therapeutic
pathways. (Adapted, with permission under a CC BY-NC-ND 4.0 license, from
reference 10.)
Figure 5:
The Precise Percutaneous Coronary Intervention Plan (P3) trial evaluated the relationship between atherosclerotic plaque phenotypes and focal and diffuse coronary artery disease (CAD) defined by coronary hemodynamics. The study included patients with hemodynamically significant CAD based on fractional flow reserve (FFR), with plaque characterization based on CT and optical coherence tomography (OCT). Using an OCT pullback pressure gradient (PPG) index, patients were divided into focal (PPG > 0.66) or diffuse (PPG ≤ 0.66) CAD (upper panel). Plaque phenotypes were subsequently analyzed at CT and OCT (middle panel). The graph shows vessels with focal CAD (red bars) had a higher plaque burden and predominantly lipid-rich plaque with a high prevalence of high-risk thin-cap fibroatheroma, whereas calcifications were the hallmark of vessels with diffuse disease (green bars). The study highlights the different plaque subtypes in focal versus diffuse disease, which may influence therapeutic pathways. (Adapted, with permission under a CC BY-NC-ND 4.0 license, from reference .)
Kuneman et al evaluated the association between pericoronary adipose
tissue (PCAT) and culprit plaques by using CT. Patients with acute coronary
syndrome (ACS) within 2 years after CT were identified and compared with
controls. The PCAT at CT was defined as tissue with attenuation between
−190 and −30 HU and within a radial distance from the vessel
wall equal to the vessel diameter. (A) Multiplanar reconstructions of CT
scans show mixed plaques in the proximal (right) and middle (left) left
anterior descending coronary artery, with surrounding PCAT (orange-yellow
colored areas) across a precursor of a culprit lesion in a patient who
developed an ACS (left) and across a lesion in a patient with stable
coronary artery disease (CAD) (right). (B) Mean PCAT attenuation across
precursors of culprit lesions versus nonculprit lesions in patients who
developed ACS versus lesions in patients with stable CAD. The study
highlights the evolving role of inflammatory pericoronary fat evaluation as
an additional prognostic imaging biomarker of high-risk coronary plaque in
predicting subsequent events. (Adapted, with permission under a CC BY-NC-ND
4.0 license, from reference 12.)
Figure 6:
Kuneman et al evaluated the association between pericoronary adipose tissue (PCAT) and culprit plaques by using CT. Patients with acute coronary syndrome (ACS) within 2 years after CT were identified and compared with controls. The PCAT at CT was defined as tissue with attenuation between −190 and −30 HU and within a radial distance from the vessel wall equal to the vessel diameter. (A) Multiplanar reconstructions of CT scans show mixed plaques in the proximal (right) and middle (left) left anterior descending coronary artery, with surrounding PCAT (orange-yellow colored areas) across a precursor of a culprit lesion in a patient who developed an ACS (left) and across a lesion in a patient with stable coronary artery disease (CAD) (right). (B) Mean PCAT attenuation across precursors of culprit lesions versus nonculprit lesions in patients who developed ACS versus lesions in patients with stable CAD. The study highlights the evolving role of inflammatory pericoronary fat evaluation as an additional prognostic imaging biomarker of high-risk coronary plaque in predicting subsequent events. (Adapted, with permission under a CC BY-NC-ND 4.0 license, from reference .)
Kinoshita et al evaluated patients who underwent both CT and optical
coherence tomography (OCT) to analyze high-risk plaque features at CT
(positive remodeling, low-attenuation plaque, napkin ring sign, and spotty
calcification) that correlated with vulnerable OCT plague features.
Statistically significant associations between multiple high-risk plaque
(HRP) features and each OCT feature of vulnerability are depicted by
highlighted dots and lines connecting features. Positive remodeling was the
most foundational HRP feature and associated with all six OCT features of
plaque vulnerability. The others have more specific associations with
individual OCT features of vulnerability. The prevalence of each OCT feature
is represented as follows: +++ indicates ≥75%, ++ indicates
50%–74%, + indicates 25%–49%, and – indicates
<25%. The prevalence pattern was similar among the four HRP CT
features. In the representative images of each HRP feature, positive
remodeling is indicated by green arrowheads, low-attenuation plaque by
yellow dotted outlines, napkin ring sign by orange arrowheads, and spotty
calcification by a white arrow. Yellow arrowheads indicate the labeled
representative OCT feature of vulnerability. TCFA = thin-cap fibroatheroma.
(Adapted, with permission, from reference 15.)
Figure 7:
Kinoshita et al evaluated patients who underwent both CT and optical coherence tomography (OCT) to analyze high-risk plaque features at CT (positive remodeling, low-attenuation plaque, napkin ring sign, and spotty calcification) that correlated with vulnerable OCT plague features. Statistically significant associations between multiple high-risk plaque (HRP) features and each OCT feature of vulnerability are depicted by highlighted dots and lines connecting features. Positive remodeling was the most foundational HRP feature and associated with all six OCT features of plaque vulnerability. The others have more specific associations with individual OCT features of vulnerability. The prevalence of each OCT feature is represented as follows: +++ indicates ≥75%, ++ indicates 50%–74%, + indicates 25%–49%, and – indicates <25%. The prevalence pattern was similar among the four HRP CT features. In the representative images of each HRP feature, positive remodeling is indicated by green arrowheads, low-attenuation plaque by yellow dotted outlines, napkin ring sign by orange arrowheads, and spotty calcification by a white arrow. Yellow arrowheads indicate the labeled representative OCT feature of vulnerability. TCFA = thin-cap fibroatheroma. (Adapted, with permission, from reference .)
Ioannou et al performed a retrospective analysis of patients with a
confirmed diagnosis of immunoglobulin light chain amyloidosis (AL),
transthyretin amyloidosis (ATTR), apolipoprotein A-I amyloidosis (AApoAI),
and apolipoprotein A-IV amyloidosis (AApoAIV) at the National Amyloidosis
Center database in the United Kingdom over a 21-year period. Diagram
illustrates key clinical and imaging features that should raise the
suspicion of the different forms of cardiac amyloidosis. Top left, AApoAI
cardiac amyloidosis can manifest with laryngeal involvement, multiorgan
involvement, and a strong family history. Echocardiograms demonstrate
right-sided disease with thickening of the tricuspid valve and tricuspid
regurgitation. Cardiac MR image demonstrates right atrial and right
ventricular thickening and right atrial and right ventricular late
gadolinium enhancement (LGE). Top right, AApoAIV cardiac amyloidosis has a
male predominance and can manifest with renal involvement. Echocardiograms
demonstrate biventricular wall thickening and a typical apical-sparing
strain pattern. Cardiac MR image demonstrates left ventricular wall
thickening, biventricular transmural LGE, and an elevated extracellular
volume (ECV). Bottom left, immunoglobulin AL can manifest with macroglossia,
multisystem involvement, and nephrotic syndrome. Echocardiograms demonstrate
biventricular wall thickening. Cardiac MR image demonstrates diffuse
biventricular transmural LGE and an elevated ECV. Bottom right,
transthyretin (ATTR) cardiac amyloidosis has a male predominance and can
manifest with polyneuropathy and a strong family history. Echocardiograms
demonstrate biventricular wall thickening. Cardiac MR image demonstrates
diffuse biventricular transmural LGE and an elevated ECV. hATTR = hereditary
ATTR. (Adapted, with permission under a CC BY-NC-ND 4.0 license, from
reference 20.)
Figure 8:
Ioannou et al performed a retrospective analysis of patients with a confirmed diagnosis of immunoglobulin light chain amyloidosis (AL), transthyretin amyloidosis (ATTR), apolipoprotein A-I amyloidosis (AApoAI), and apolipoprotein A-IV amyloidosis (AApoAIV) at the National Amyloidosis Center database in the United Kingdom over a 21-year period. Diagram illustrates key clinical and imaging features that should raise the suspicion of the different forms of cardiac amyloidosis. Top left, AApoAI cardiac amyloidosis can manifest with laryngeal involvement, multiorgan involvement, and a strong family history. Echocardiograms demonstrate right-sided disease with thickening of the tricuspid valve and tricuspid regurgitation. Cardiac MR image demonstrates right atrial and right ventricular thickening and right atrial and right ventricular late gadolinium enhancement (LGE). Top right, AApoAIV cardiac amyloidosis has a male predominance and can manifest with renal involvement. Echocardiograms demonstrate biventricular wall thickening and a typical apical-sparing strain pattern. Cardiac MR image demonstrates left ventricular wall thickening, biventricular transmural LGE, and an elevated extracellular volume (ECV). Bottom left, immunoglobulin AL can manifest with macroglossia, multisystem involvement, and nephrotic syndrome. Echocardiograms demonstrate biventricular wall thickening. Cardiac MR image demonstrates diffuse biventricular transmural LGE and an elevated ECV. Bottom right, transthyretin (ATTR) cardiac amyloidosis has a male predominance and can manifest with polyneuropathy and a strong family history. Echocardiograms demonstrate biventricular wall thickening. Cardiac MR image demonstrates diffuse biventricular transmural LGE and an elevated ECV. hATTR = hereditary ATTR. (Adapted, with permission under a CC BY-NC-ND 4.0 license, from reference .)
Kidoh et al explored the diagnostic performances of the traditional
MRI ECV method and the newer method of myocardium to lumen R1 ratio on
postcontrast T1 maps, which has the advantage of not requiring a native T1
map and hematocrit levels. (A) Example of region of interest placement on
postcontrast T1 maps in a patient with cardiac amyloidosis. The ratio of
myocardial R1 to luminal R1 on the postcontrast T1 map was defined as
postcontrast myocardium to lumen R1 ratio. (B) Postcontrast T1 map in a
70-year-old male individual with suspected cardiac amyloidosis. The mean R1
values of the septal wall were higher than those of the lumen (postcontrast
myocardium to lumen R1 ratio = 1.36). The ECV value was 78% (abnormally
high). Wild-type transthyretin amyloidosis (ATTRwt) was confirmed using
genetic testing. (C) Receiver operating characteristic curves for the
detection of patients with cardiac amyloidosis. The highest area under the
receiver operating characteristic curve (AUC) was attained with ECV (0.99
[95% CI: 0.97, 1.00], P < .001), followed by Λ (0.98 [95% CI:
0.96, 0.99], P < .001), and then, postcontrast myocardium-to-lumen R1
ratio (0.98 [95% CI: 0.95, 0.99], P < .001). There was no evidence of
a difference in AUC between ECV and postcontrast myocardium to lumen R1
ratio (P = .10) or between Λ and postcontrast myocardium to lumen R1
ratio (P = .19). ECV = extracellular volume fraction. (Adapted, with
permission, from reference 21.)
Figure 9:
Kidoh et al explored the diagnostic performances of the traditional MRI ECV method and the newer method of myocardium to lumen R1 ratio on postcontrast T1 maps, which has the advantage of not requiring a native T1 map and hematocrit levels. (A) Example of region of interest placement on postcontrast T1 maps in a patient with cardiac amyloidosis. The ratio of myocardial R1 to luminal R1 on the postcontrast T1 map was defined as postcontrast myocardium to lumen R1 ratio. (B) Postcontrast T1 map in a 70-year-old male individual with suspected cardiac amyloidosis. The mean R1 values of the septal wall were higher than those of the lumen (postcontrast myocardium to lumen R1 ratio = 1.36). The ECV value was 78% (abnormally high). Wild-type transthyretin amyloidosis (ATTRwt) was confirmed using genetic testing. (C) Receiver operating characteristic curves for the detection of patients with cardiac amyloidosis. The highest area under the receiver operating characteristic curve (AUC) was attained with ECV (0.99 [95% CI: 0.97, 1.00], P < .001), followed by Λ (0.98 [95% CI: 0.96, 0.99], P < .001), and then, postcontrast myocardium-to-lumen R1 ratio (0.98 [95% CI: 0.95, 0.99], P < .001). There was no evidence of a difference in AUC between ECV and postcontrast myocardium to lumen R1 ratio (P = .10) or between Λ and postcontrast myocardium to lumen R1 ratio (P = .19). ECV = extracellular volume fraction. (Adapted, with permission, from reference .)
Heydari et al sought to evaluate sex-specific prognostic performance
in a multicenter Stress CMR Perfusion Imaging in the United States [SPINS]
Study registry of 2349 patients. The primary outcome measure was a composite
of cardiovascular death and nonfatal myocardial infarction. At the 5.4-year
median follow-up, female individuals with normal stress cardiac MRI findings
had a low annualized rate of primary composite outcome similar to male
individuals (P value was nonsignificant). In contrast, female individuals
with abnormal cardiac MRI findings were at higher risk for the primary
outcome compared with female individuals with normal cardiac MRI findings.
Presence of abnormal stress cardiac MRI findings was an independent
predictor for the primary outcome measure. There was no effect modification
for sex. Female individuals had lower rates of invasive coronary angiography
and downstream costs at 90 days following cardiac MRI. There was no effect
of sex on diagnostic image quality. (Reprinted, with permission, from
reference 22.)
Figure 10:
Heydari et al sought to evaluate sex-specific prognostic performance in a multicenter Stress CMR Perfusion Imaging in the United States [SPINS] Study registry of 2349 patients. The primary outcome measure was a composite of cardiovascular death and nonfatal myocardial infarction. At the 5.4-year median follow-up, female individuals with normal stress cardiac MRI findings had a low annualized rate of primary composite outcome similar to male individuals (P value was nonsignificant). In contrast, female individuals with abnormal cardiac MRI findings were at higher risk for the primary outcome compared with female individuals with normal cardiac MRI findings. Presence of abnormal stress cardiac MRI findings was an independent predictor for the primary outcome measure. There was no effect modification for sex. Female individuals had lower rates of invasive coronary angiography and downstream costs at 90 days following cardiac MRI. There was no effect of sex on diagnostic image quality. (Reprinted, with permission, from reference .)
Some nonischemic dilated cardiomyopathies (DCMs) have late gadolinium
enhancement (LGE) localized only at the right ventricular (RV) insertion
points (IP-LGE). Claver et al sought to evaluate the prognostic implications
of IP-LGE, as well as LGE present at both the RV insertion points and left
ventricle, in 1165 patients with DCM. Representative cardiac MR images in a
patient with IP-LGE: (A) cine left ventricular short-axis view, (B) LGE
magnitude, and (C) phase-sensitive inversion recovery, all synchronized at
the same phase of the cardiac cycle. The LGE sequences show a prominent area
of inferior IP-LGE. The study found that insertion point LGE did not affect
outcomes among patients with DCM. (Adapted, with permission, from reference
25.)
Figure 11:
Some nonischemic dilated cardiomyopathies (DCMs) have late gadolinium enhancement (LGE) localized only at the right ventricular (RV) insertion points (IP-LGE). Claver et al sought to evaluate the prognostic implications of IP-LGE, as well as LGE present at both the RV insertion points and left ventricle, in 1165 patients with DCM. Representative cardiac MR images in a patient with IP-LGE: (A) cine left ventricular short-axis view, (B) LGE magnitude, and (C) phase-sensitive inversion recovery, all synchronized at the same phase of the cardiac cycle. The LGE sequences show a prominent area of inferior IP-LGE. The study found that insertion point LGE did not affect outcomes among patients with DCM. (Adapted, with permission, from reference .)
Sherrid et al evaluated the imaging and physiologic features of mid
left ventricle (LV) obstruction and its frequency in hypertrophic
obstructive cardiomyopathy apical aneurysms. The upper panel shows a
hypertrophied LV from end diastole to end systole, obstructing the papillary
muscle (PM) (red arrow). Relatively apical insertion of the PM causes
obstruction at the apical-to-mid level, with a resulting small aneurysm
(white arrow). The subvalvular apparatus (SVA) is long (orange double
arrow). The schematic on the left side of the lower panel shows mid-LV
obstruction, short SVA (double arrow), and large apical aneurysm with
hypertrophic involvement of the PM. The right-hand schematic shows
apical-mid obstruction, long SVA (double arrow), and a small apical
aneurysm. (Reprinted, with permission, from reference 27.)
Figure 12:
Sherrid et al evaluated the imaging and physiologic features of mid left ventricle (LV) obstruction and its frequency in hypertrophic obstructive cardiomyopathy apical aneurysms. The upper panel shows a hypertrophied LV from end diastole to end systole, obstructing the papillary muscle (PM) (red arrow). Relatively apical insertion of the PM causes obstruction at the apical-to-mid level, with a resulting small aneurysm (white arrow). The subvalvular apparatus (SVA) is long (orange double arrow). The schematic on the left side of the lower panel shows mid-LV obstruction, short SVA (double arrow), and large apical aneurysm with hypertrophic involvement of the PM. The right-hand schematic shows apical-mid obstruction, long SVA (double arrow), and a small apical aneurysm. (Reprinted, with permission, from reference .)
The predominant pattern of late gadolinium enhancement (LGE) in HCM is
intramural, but other patterns such as subendocardial and right ventricular
insertion point (RVIP) can be seen. Yang et al examined 497 consecutive
patients with HCM for subendocardial and RVIP LGE patterns by using cardiac
MRI. (A) A four-chamber LGE sequence (left) shows subendocardial enhancement
along the interventricular septum yet no obstructive coronary lesion at
invasive coronary angiography (right). (B) A short-axis LGE sequence with
RVIP LGE. Subendocardium-involved LGE and RVIP LGE were observed in 184
(37.0%) and 414 (83.3%), respectively, of the cohort. Red circle:
endocardial border, green circle: epicardial border, yellow patches: LGE,
blue circle: normal reference myocardium. (C) Kaplan-Meier curves show
event-free rates for various combinations of LGE extent and subendocardial
pattern. In patients with nonextensive LGE, subendocardium-involved LGE
rather than LGE extent was independently associated with adverse outcomes
(HR: 2.12, P = .03). HCM = hypertrophic cardiomyopathy, HR = hazard ratio.
(Adapted, with permission, from reference 28.)
Figure 13:
The predominant pattern of late gadolinium enhancement (LGE) in HCM is intramural, but other patterns such as subendocardial and right ventricular insertion point (RVIP) can be seen. Yang et al examined 497 consecutive patients with HCM for subendocardial and RVIP LGE patterns by using cardiac MRI. (A) A four-chamber LGE sequence (left) shows subendocardial enhancement along the interventricular septum yet no obstructive coronary lesion at invasive coronary angiography (right). (B) A short-axis LGE sequence with RVIP LGE. Subendocardium-involved LGE and RVIP LGE were observed in 184 (37.0%) and 414 (83.3%), respectively, of the cohort. Red circle: endocardial border, green circle: epicardial border, yellow patches: LGE, blue circle: normal reference myocardium. (C) Kaplan-Meier curves show event-free rates for various combinations of LGE extent and subendocardial pattern. In patients with nonextensive LGE, subendocardium-involved LGE rather than LGE extent was independently associated with adverse outcomes (HR: 2.12, P = .03). HCM = hypertrophic cardiomyopathy, HR = hazard ratio. (Adapted, with permission, from reference .)
Vidula et al retrospectively analyzed 1047 patients, from 18
international sites, with confirmed COVID-19 infection who underwent cardiac
MRI. (A) Example cardiac MR images in a patient with acute myocarditis
linked to a recent COVID-19 infection show subepicardial late gadolinium
enhancement (LGE) in the midinferior and inferoseptal walls (left image,
indicated by white arrow). There are also elevated native T2 times (middle
image, white arrow) and native T1 times (right image, white arrow) in the
midinferior wall. (B) Example cardiac MR images in a patient after a
complicated COVID-19 hospitalization reveal nonacute, nonischemic injury.
There is extensive midmyocardial LGE in the septum (left image, white arrow)
and subepicardial LGE in the inferior and inferolateral walls visible on the
short-axis view (left image, red arrow). The midmyocardial LGE in the septum
is also seen on the four-chamber view (middle image, white arrow), and
subepicardial LGE in the inferior wall appears on the two-chamber view
(right image, white arrow). (Reprinted, with permission, from reference
29.)
Figure 14:
Vidula et al retrospectively analyzed 1047 patients, from 18 international sites, with confirmed COVID-19 infection who underwent cardiac MRI. (A) Example cardiac MR images in a patient with acute myocarditis linked to a recent COVID-19 infection show subepicardial late gadolinium enhancement (LGE) in the midinferior and inferoseptal walls (left image, indicated by white arrow). There are also elevated native T2 times (middle image, white arrow) and native T1 times (right image, white arrow) in the midinferior wall. (B) Example cardiac MR images in a patient after a complicated COVID-19 hospitalization reveal nonacute, nonischemic injury. There is extensive midmyocardial LGE in the septum (left image, white arrow) and subepicardial LGE in the inferior and inferolateral walls visible on the short-axis view (left image, red arrow). The midmyocardial LGE in the septum is also seen on the four-chamber view (middle image, white arrow), and subepicardial LGE in the inferior wall appears on the two-chamber view (right image, white arrow). (Reprinted, with permission, from reference .)

References

    1. Simon J , Hrenkó Á , Kerkovits NM , et al. . Photon-counting detector CT reduces the rate of referrals to invasive coronary angiography as compared to CT with whole heart coverage energy-integrating detector . J Cardiovasc Comput Tomogr 2024. ; 18 ( 1 ): 69 – 74 . - PubMed
    1. Takafuji M , Kitagawa K , Mizutani S , et al. . Super-resolution deep learning reconstruction for improved image quality of coronary CT angiography . Radiol Cardiothorac Imaging 2023. ; 5 ( 4 ): e230085 . - PMC - PubMed
    1. Douglas PS , Nanna MG , Kelsey MD , et al. . Comparison of an initial risk-based testing strategy vs usual testing in stable symptomatic patients with suspected coronary artery disease: The PRECISE randomized clinical trial . JAMA Cardiol 2023. ; 8 ( 10 ): 904 – 914 . - PMC - PubMed
    1. SCOT-HEART Investigators ; Newby DE , Adamson PD , et al. . Coronary CT angiography and 5-year risk of myocardial infarction . N Engl J Med 2018. ; 379 ( 10 ): 924 – 933 . - PubMed
    1. Douglas PS , Hoffmann U , Patel MR , et al. . Outcomes of anatomical versus functional testing for coronary artery disease . N Engl J Med 2015. ; 372 ( 14 ): 1291 – 1300 . - PMC - PubMed

MeSH terms

LinkOut - more resources