. 2024 Oct 30;165(12):bqae141.
doi: 10.1210/endocr/bqae141.

Targeted Deletion of Fibroblast Growth Factor 23 Rescues Metabolic Dysregulation of Diet-induced Obesity in Female Mice

Affiliations

Targeted Deletion of Fibroblast Growth Factor 23 Rescues Metabolic Dysregulation of Diet-induced Obesity in Female Mice

Min Young Park et al. Endocrinology. .

Abstract

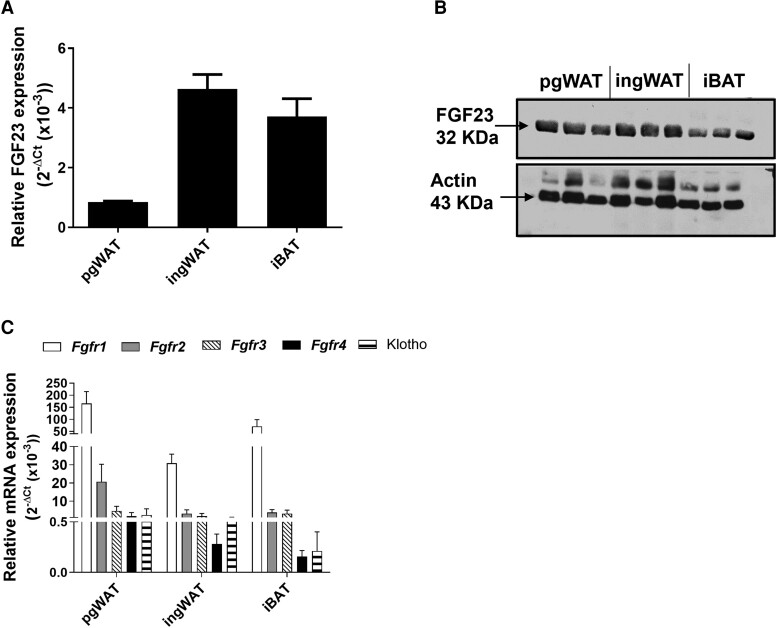
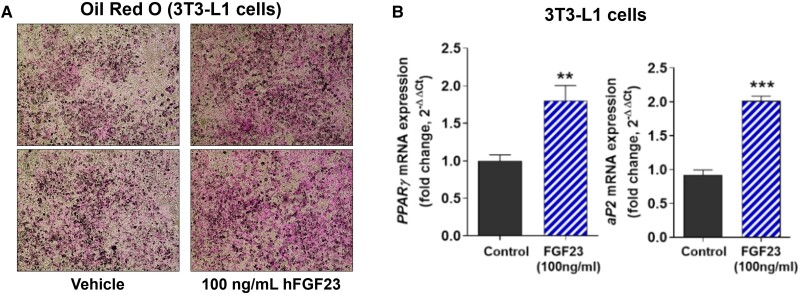
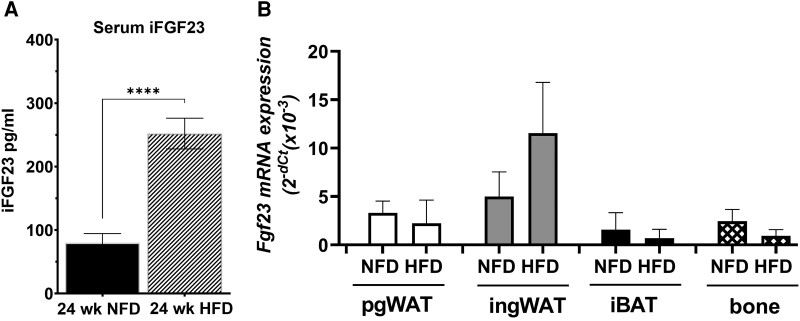
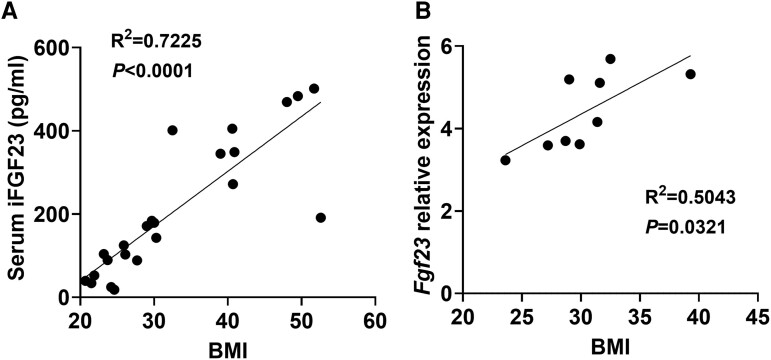
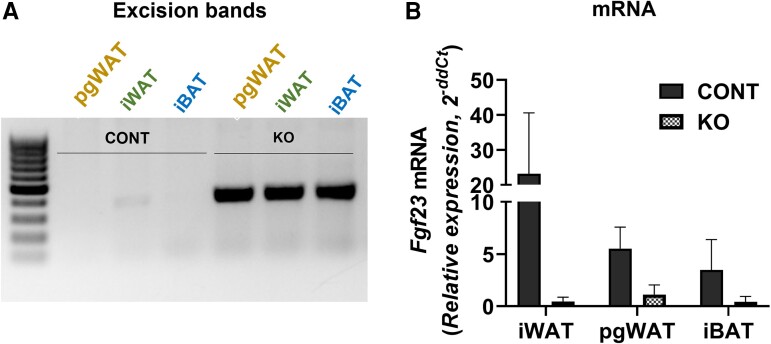
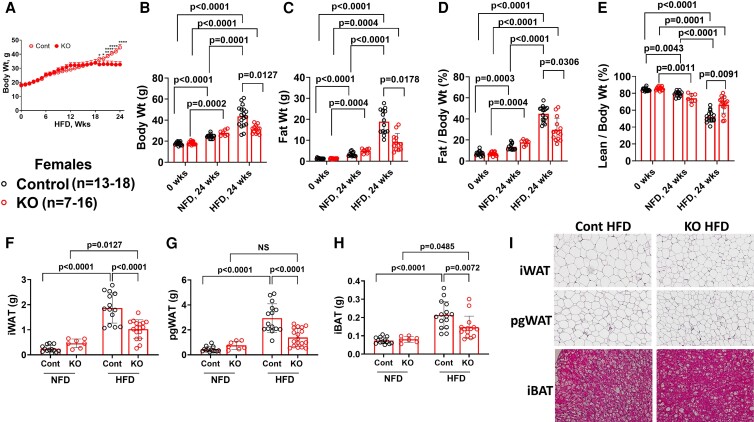
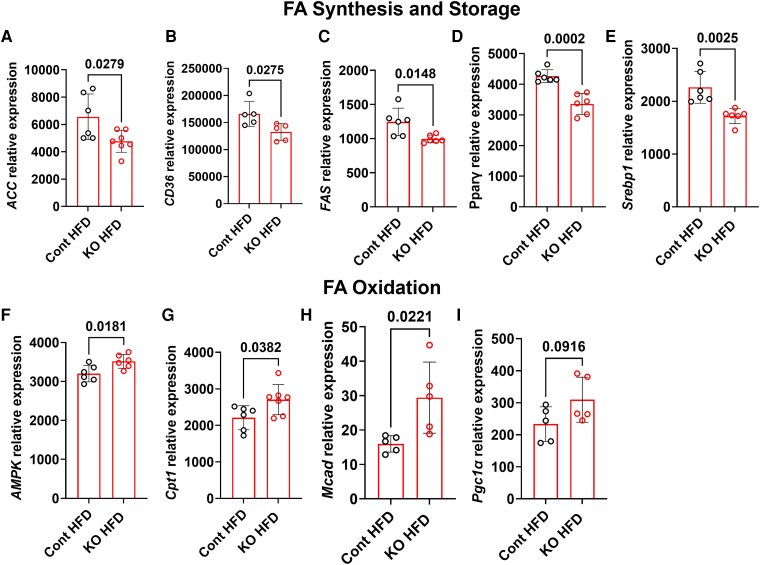
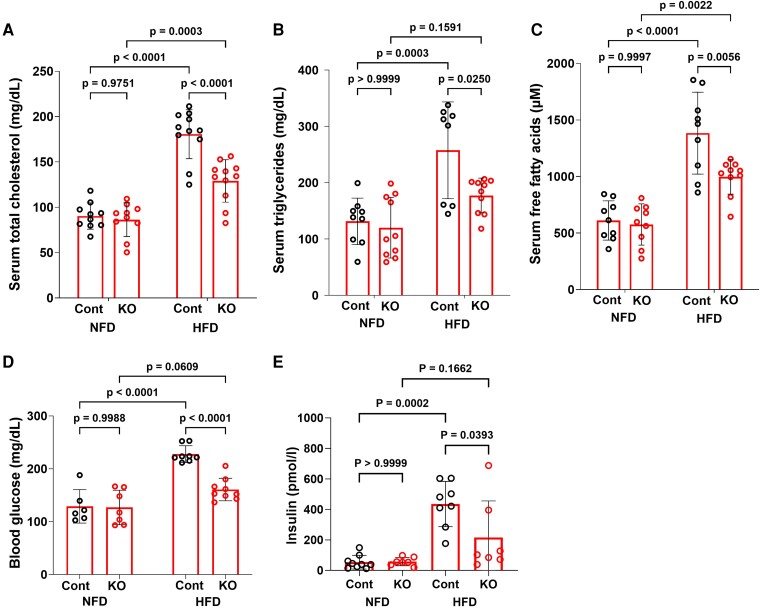
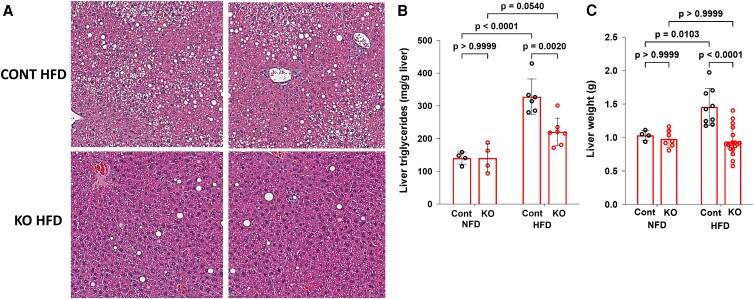
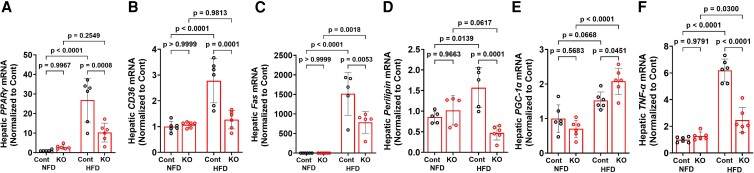
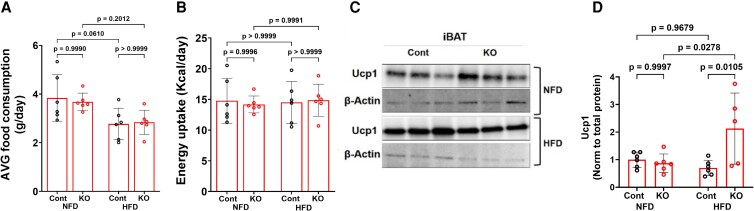
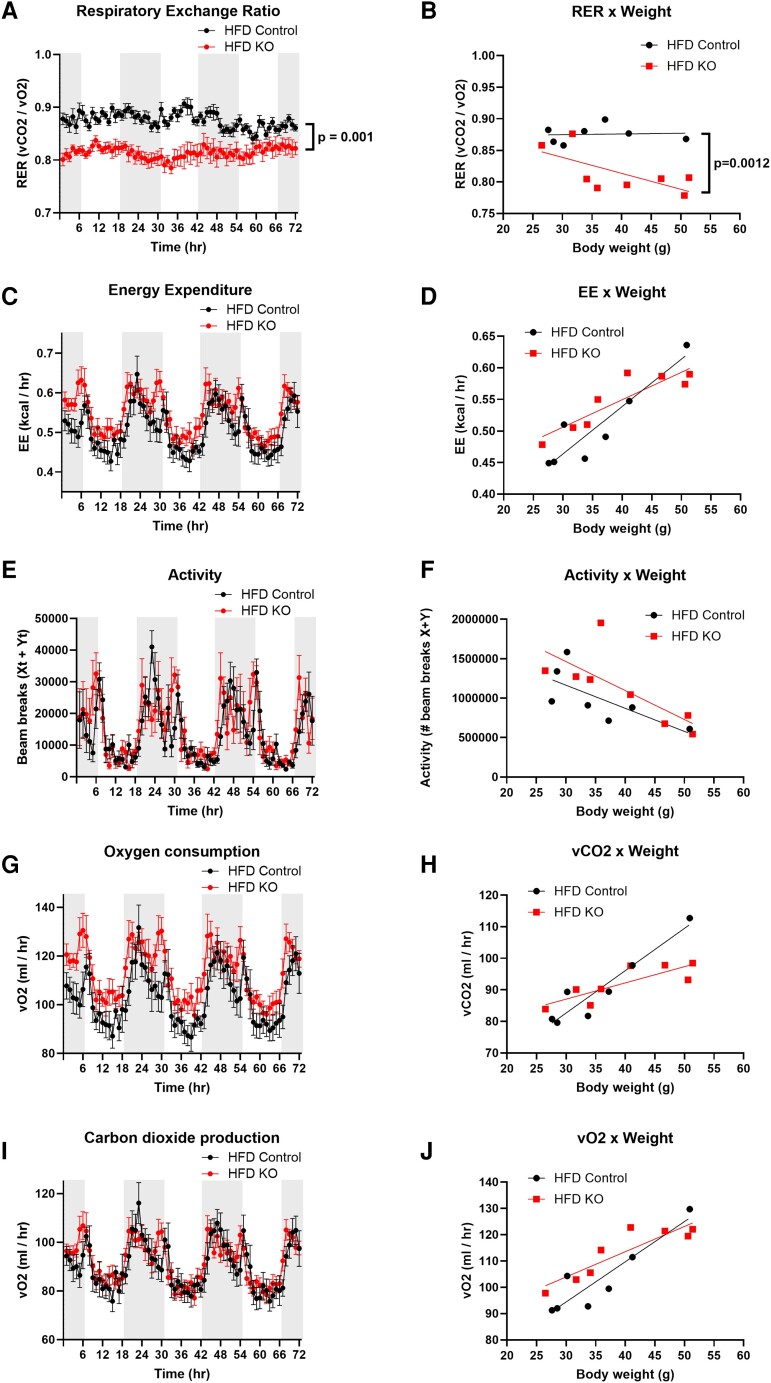
Fibroblast growth factor 23 (FGF23) is a bone-secreted protein widely recognized as a critical regulator of skeletal and mineral metabolism. However, little is known about the nonskeletal production of FGF23 and its role in tissues other than bone. Growing evidence indicates that circulating FGF23 levels rise with a high-fat diet (HFD) and they are positively correlated with body mass index (BMI) in humans. In the present study, we show for the first time that increased circulating FGF23 levels in obese humans correlate with increased expression of adipose Fgf23 and both positively correlate with BMI. To understand the role of adipose-derived Fgf23, we generated adipocyte-specific Fgf23 knockout mice (AdipoqFgf23Δfl/Δfl) using the adiponectin-Cre driver, which targets mature white, beige, and brown adipocytes. Our data show that targeted ablation of Fgf23 in adipocytes prevents HFD-fed female mice from gaining body weight and fat mass while preserving lean mass but has no effect on male mice, indicating the presence of sexual dimorphism. These effects are observed in the absence of changes in food and energy intake. Adipose Fgf23 inactivation also prevents dyslipidemia, hyperglycemia, and hepatic steatosis in female mice. Moreover, these changes are associated with decreased respiratory exchange ratio and increased brown fat Ucp1 expression in knockout mice compared to HFD-fed control mice (Fgf23fl/fl). In conclusion, this is the first study highlighting that targeted inactivation of Fgf23 is a promising therapeutic strategy for weight loss and lean mass preservation in humans.

Keywords: FGF23; adipose tissue; high-fat diet; lipid metabolism; obesity.


Figures

Figure 1.
Figure 1.
Expression of Fgf23 and FGF receptors in different types of adipose tissue from 8-week-old C57BL/6J mice. (A) Real-time quantitative RT-PCR showing expression of Fgf23 in mouse white and brown adipose tissues (n = 3). The geometric mean of 2 reference genes (β-actin and Atpf1) was used for internal normalization. Data are represented as relative expression (2−ΔCt) of Fgf23 normalized to the geometric mean of the 2 reference genes. (B) Western blot image of FGF23 protein expression in adipose tissue depots from C57BL/6J mice (n = 3). (C) Real-time quantitative RT-PCR showing expression of Fgfrs and Klotho in C57BL/6J mouse white and brown adipose tissues. Data are represented as fold change (Δ) relative to Rpl4 (n = 3).
Figure 2.
Figure 2.
FGF23 increases lipid accumulation in differentiated 3T3-L1 cells. (A) Oil Red O staining of differentiated 3T3-L1 cells at day 8 of differentiation after treatment with 100 ng/mL of FGF23 or PBS (vehicle) from day 0 to day 8. (B) Real-time quantitative RT-PCR showing expression of aP2 and Pparγ in differentiated 3T3-L1. Data are normalized to Rpl4 and represented as fold change (Δ) relative to control (vehicle) (n = 3).
Figure 3.
Figure 3.
Circulating levels and AT Fgf23 expression in wild-type mice after high-fat diet. (A) Serum levels of intact FGF23 measured by ELISA; (B) real-time quantitative RT-PCR showing expression of Fgf23 in perigonadal and inguinal white AT, interscapular brown AT, and bone, in normal mice fed normal or high-fat diet for 24 weeks. Data are normalized to Tbp (n = 6). Re-do normalization for mRNA data.
Figure 4.
Figure 4.
Circulating and adipose tissue levels of FGF23 in humans are increased as BMI increases. (A) Serum levels of intact FGF23 measured by ELISA in lean (BMI <25), overweight (BMI 25-29.9), and obese (BMI >30) female individuals (n = 23). (B) Linear regression analysis of Fgf23 expression in subcutaneous adipose tissues of clinical female participants with excess weight or obesity (n = 9), with significance assessed by Pearson's correlation. Curved lines indicate 95% confidence intervals. n represents number of biologically independent human participants.
Figure 5.
Figure 5.
Validation of AdipoqFgf23Δfl/Δfl and Fgf23fl/fl mice. (A) Representative agarose gel image showing amplicons of the Fgf23 excision product in WAT, perigonadal and inguinal WAT, and iBAT in control and KO mice. Excision product size: 370 bp. (B) Real-time quantitative RT-PCR of FGF23 expression, showing significant knockdown of Fgf23 mRNA in inguinal and perigonadal WAT and iBAT. mRNA data are normalized to Tbp and represented as fold change (Δ) relative to control (n = 6).
Figure 6.
Figure 6.
Body weight and fat mass of female AdipoqFgf23Δfl/Δfl and Fgf23fl/fl mice fed a HFD. Female AdipoqFgf23Δfl/Δfl and Fgf23fl/fl Cont mice were fed a HFD or NFD for 24 weeks starting at 8 weeks of age. (A) Weekly body weight measurements (g) of AdipoqFgf23Δfl/Δfl and Fgf23fl/fl Cont mice fed a HFD. (B-E) Representation of body weight and whole-body fat mass measured before HFD (0 weeks) and after 24 weeks of either HFD or NFD using EchoMRI. (B) Body weight (g); (C) whole body fat weight (g); (D) percent of fat to body weight; and (E) percent of lean mass to body weight. (F-H) Weights of dissected fat pad depots were taken posteuthanasia of AdipoqFgf23Δfl/Δfl and Fgf23fl/fl Cont mice after 24 weeks of HFD or NFD. (F) iWAT; (G) pgWAT; and (H) iBAT. Data are presented as mean ± SD. (Fgf23fl/fl Cont mice: n = 13-18 per group; AdipoqFgf23Δfl/Δfl: n = 7-16 per group). (I) Representative images of hematoxylin and eosin stained sections of iWAT, pgWAT, and iBAT from female AdipoqFgf23Δfl/Δfl and Fgf23fl/fl Cont mice fed HFD for 24 weeks (n = 4-6).
Figure 7.
Figure 7.
Expression of genes associated with lipid homeostasis in iWAT. Expression of genes associated with lipid homeostasis was assessed using nCounter technology in iWAT from Fgf23fl/fl (control) and AdipoqFgf23Δfl/Δfl (KO) female mice fed a HFD for 24 weeks. (A-E) Genes associated with FA synthesis and storage, (F-I) Genes associated with FA oxidation. (A) ACC (acetyl CoA carboxylase), (B) CD36, (C) FAS (FA synthase), (D) Pparγ, (E) Srebp1 (sterol regulatory element binding protein 1), (F) AMPK (AMP-activated protein kinase), (G) Cpt1 (carnitine palmitoyl transferase), (H) Mcad (medium chain acetyl CoA dehydrogenase), and (I) Pgc1α (peroxisome proliferator-activated receptor gamma coactivator 1-alpha). (n = 5-7). Data are presented as mean ± SD.
Figure 8.
Figure 8.
Expression of genes associated with inflammation and oxidative stress. Expression of genes associated with inflammation and oxidative stress was assessed using nCounter technology in iWAT from Fgf23fl/fl (Cont) and AdipoqFgf23Δfl/Δfl (KO) female mice fed a HFD for 24 weeks. (A-B) Genes associated with inflammation; (C-D) genes associated oxidative stress. (A) IFNγ; (B) IL6; (C) Nox4 (NADPH oxidase 4); (D) Sod1 (superoxide dismutase) (n = 5-7). Data are presented as mean ± SD.
Figure 9.
Figure 9.
Serum biochemistry of female mice with deletion of Fgf23 in adipocytes. Fgf23fl/fl (Cont) and AdipoqFgf23Δfl/Δfl (KO) female mice were fed a HFD or NFD. Serum total cholesterol (mg/dL) (A), triglycerides (mg/dL) (B), free fatty acids (μM) (C), fasting blood glucose (mg/dL) (D), and fasting plasma insulin (pmol/L) (E) were measured using commercial kits. (n = 6-9). Data are presented as mean ± SD.
Figure 10.
Figure 10.
Hepatic lipid accumulation is reduced in female mice with deletion of Fgf23 in adipocytes. Fgf23fl/fl (Cont) and AdipoqFgf23Δfl/Δfl (KO) female mice were fed a HFD or NFD for 24 weeks. (A) Representative images of hematoxylin and eosin staining for liver sections from HFD-fed Fgf23fl/fl (Cont) and AdipoqFgf23Δfl/Δfl (KO) female mice. (B) Liver triglyceride levels (mg/g of liver) and (C) liver weight (g). (n = 4-18). Data are presented as mean ± SD.
Figure 11.
Figure 11.
Hepatic expression of genes associated with lipid metabolism and inflammation in female mice with deletion of Fgf23 in adipocytes. Real-time quantitative RT-PCR showing expression of (A) Pparγ, (B) CD36, (C) Fas, (D) Perilipin, (E) TNF-α , and (F) Pgc-1α in liver of Fgf23fl/fl and AdipoqFgf23Δfl/Δfl female mice fed HFD or NFD for 24 weeks. (n = 6). Data are presented as mean ± SD. Data are normalized to Rpl4 and represented as fold change (Δ) relative to control.
Figure 12.
Figure 12.
iBAT Ucp1 protein expression is increased in female mice with deletion of adipose Fgf23 whereas food and energy intake are unchanged. (A) Average food intake and (B) energy uptake of female AdipoqFgf23Δfl/Δfl and Fgf23fl/fl mice fed a NFD or HFD for 24 weeks. (n = 6 per group). Energy uptake was calculated by multiplying the consumed food in grams with the calories per gram of the respective type of diet. (C) Representative Western blot image showing expression of Ucp1 in iBAT of Cont and KO mice fed a NFD or HFD for 24 weeks. (D) Quantitation of Ucp1 protein expression normalized to β-actin expression. (n = 6 per group). Data are presented as mean ± SD.
Figure 13.
Figure 13.
Effects of adipocyte selective deletion of Fgf23 on energy homeostasis. Indirect calorimetry measurements across 72 hours using TSE PhenoMaster were performed in AdipoqFgf23Δfl/Δfl mice (n = 8) and control (Fgf23fl/fl) (n = 7) fed a HFD for 24 weeks. (A) Average RER ( = vO2/vCO2) across the 72-hour period; (B) scatter plot of mean RER by initial body weight for each genotype with best linear fits; (C) average EE (kcal heat produced per hour); (D) scatter plot of mean EE by initial body weight for each genotype with best linear fits; (E) physical activity as measured by the average number of beam break counts in different dimensions (XT + YT); (F) scatter plot of total activity by initial body weight for each genotype with best linear fits; (G) average VO2 consumed (ml per hour); (H) scatter plot of mean VO2 by initial body weight for each genotype with best linear fits; (I) total VCO2 produced (ml per hour); (J) scatter plot of mean VCO2 by initial body weight for each genotype with best linear fits. Data are expressed as mean ± SD. Data in panels A, C, E, G, and I were analyzed using a linear mixed effects model, including genotype and sex as categorical variables and body weight as a covariate. Data in panels B, D, F, H, and J were analyzed using simple linear regression to compare intercepts and slopes.

References

    1. Scherer PE, Hill JA. Obesity, diabetes, and cardiovascular diseases: a compendium. Circ Res. 2016;118(11):1703‐1705. - PMC - PubMed
    1. Wolin KY, Carson K, Colditz GA. Obesity and cancer. Oncologist. 2010;15(6):556‐565. - PMC - PubMed
    1. Jastreboff AM, Aronne LJ, Ahmad NN, et al. Tirzepatide once weekly for the treatment of obesity. N Engl J Med. 2022;387(3):205‐216. - PubMed
    1. Jastreboff AM, Kaplan LM, Frias JP, et al. Triple-hormone-receptor agonist retatrutide for obesity—a phase 2 trial. N Engl J Med. 2023;389(6):514‐526. - PubMed
    1. Wilding JPH, Batterham RL, Calanna S, et al. Once-weekly semaglutide in adults with overweight or obesity. N Engl J Med. 2021;384(11):989‐1002. - PubMed

MeSH terms