. 2024 Nov 26;43(11):114898.
doi: 10.1016/j.celrep.2024.114898. Epub 2024 Oct 23.

Hypothalamic regulation of hippocampal CA1 interneurons by the supramammillary nucleus

Affiliations

Hypothalamic regulation of hippocampal CA1 interneurons by the supramammillary nucleus

Yu-Qiu Jiang et al. Cell Rep. .

Abstract

The hypothalamic supramammillary nucleus (SuM) projects heavily to the hippocampus to regulate hippocampal activity and plasticity. Although the projections from the SuM to the dentate gyrus (DG) and CA2 have been extensively studied, whether the SuM projects to CA1, the main hippocampal output region, is unclear. Here, we report a glutamatergic pathway from the SuM that selectively excites CA1 interneurons in the border between the stratum radiatum (SR) and the stratum lacunosum-moleculare (SLM). We find that the SuM projects selectively to a narrow band in the CA1 SR/SLM and monosynaptically excites SR/SLM interneurons, including vasoactive intestinal peptide-expressing (VIP+) and neuron-derived neurotrophic factor-expressing (NDNF+) cells, but completely avoids making monosynaptic contacts with CA1 pyramidal neurons (PNs) or parvalbumin-expressing (PV+) or somatostatin-expressing (SOM+) cells. Moreover, SuM activation drives spikes in most SR/SLM interneurons to suppress CA1 PN excitability. Taken together, our findings reveal that the SuM can directly regulate hippocampal output region CA1, bypassing CA2, CA3, and the DG.

Keywords: CA1; CA2; CP: Neuroscience; dentate gyrus; hippocampus; interneurons; neurogliaform cell; parvalbumin; stratum lacunosum-moleculare; supramammillary nucleus; vasoactive intestinal peptide.


Conflict of interest statement

Declaration of interests The authors declare no competing interests.

Figures

Figure 1.
Figure 1.. Anatomic evidence of the projection from the SuM to CA1
(A) Experimental procedure and timeline. Schematic of SuM-CA1 projection and injection of AAVSyn-ChR2-EYFP into the SuM. (B) Sample confocal images show the injection site in the SuM (left) and the expanded view (right). (C) ChR2-EYFP+ fiber distribution in the hippocampus. Note the dense ChR2-EYFP+ fibers in the DG and CA2 and in a narrow band between the SR and the SLM in CA1. (D) Left, expanded view of the rectangle in CA1b shown in (C). Right, quantification of ChR2-EYFP fluorescence intensity along the CA1 radial axis. Note the sharp peak of fluorescence intensity in the SR/SLM border. Gray shading shows the SEM. n = 6 slices/4 mice. s.o., stratum oriens; s.r., stratum radiatum; s.l.m., stratum lacunosum-moleculare. (E) Expanded views of the yellow squares shown in (C). Note the abundant expression of EYFP+ fibers in the SR/SLM border along the CA1 transverse axis. (F) Experimental procedure and timeline show the strategy to target ChR2-EYFP into CA1-projecting SuM neurons. (G) Left, sample confocal image shows the expression of ChR2-EYFP in the SuM, the injection site of Cre-dependent AAV-DIO-ChR2-EYFP. Right, expanded views show co-labeling of Cre-mCherry and ChR2-EYFP in SuM cells. (H) The distribution of ChR2-EYFP+ SuMfibers in the hippocampus. (I) Expanded views of the yellow squares shown in (H). Note the expression of EYFP+ fibers in the SR/SLM border along the CA1 transverse axis. Repeated in four mice.
Figure 2.
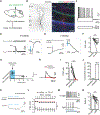
Figure 2.. The SuM strongly excites interneurons in the CA1 SR/SLM border
(A) Experimental procedure and timeline. (B) Representative confocal images showing a hippocampal slice that was injected with AAV-ChR2-EYFP into the SuM and underwent whole-cell recording (left) and expanded views of two biocytin-filled SR/SLM interneurons (right). (C) Current-clamp recording shows the membrane voltage responses to 1 s somatic injections of the indicated currents from a CA1 SR/SLM interneuron. (D) Top, voltage-clamp recording shows light-evoked EPSC recorded from a CA1 SR/SLM interneuron (holding potential −70 mV). Bottom, expanded view of the dashed box indicated in the top. Note the very short delay of the onset of EPSC evoked by blue light. Blue bars represent light pulses. (E and F) Sample traces (E) and group data (F) of light-evoked EPSCs in the absence and presence of DNQX (20 μM) and APV (50 μM). ***p < 0.001, paired t test, n = 5 cells/3 mice. Error bars show SEM. (G) Sample voltage-clamp traces show the baseline light-evoked EPSC (top), after bath application of TTX (1 μM) (middle), and followed by bath application of both TTX (1 μM) and 4-AP (1 mM) (bottom). Repeated in three cells. (H and I) Sample traces (H) and group data (I) of light-evoked IPSCs in the absence and presence of DNQX/APV (holding potential 0 mV). ***p < 0.001, paired t test, n = 6 cells/3 mice. Error bars show SEM. (J) Group data of onsets of excitatory synaptic events (n = 35 cells/9 mice) versus inhibitory synaptic events in CA1 SR/SLM interneurons (n = 8 cells/3 mice). Blue bar depicts the duration of light pulse. ***p < 0.001, unpaired t test. Error bars show SEM. (K) Sample traces of APs evoked by a train of 20 Hz light stimulation in an SR/SLM interneuron. (L) A pie chart showing the probability of synaptic connections between SuM and CA1 SR/SLM interneurons (n = 45 cells/9 mice). (M) A pie chart showing the probability of suprathreshold APs evoked by 10–20 Hz light stimulation in CA1 SR/SLM interneurons (n = 45 cells/9 mice).
Figure 3.
Figure 3.. The SuM excites but fails to evoke spikes in NDNF+ cells
(A) Genetic strategy to target tdTomato into NDNF+ cells by crossing an NDNF-IRES-Cre line with a floxed tdTomato reporter line (Ai9). (B) Experimental procedure and timeline. (C) Left, the distribution of NDNF+ cells in the CA1 SLM and SR/SLM border. Right, representative confocal images show a biocytin-filled tdTomato+ cell in CA1 from the NDNF-td mouse that underwent whole-cell recording. (D) Current-clamp recording shows the membrane voltage responses to 1 s somatic injections of the indicated currents from an NDNF+ cell. (E) Voltage-clamp recording shows sample light-evoked EPSC traces recorded from responsive and nonresponsive NDNF+ cells (holding potential −70 mV). (F) Sample current-clamp trace of subthreshold postsynaptic potentials (PSPs) evoked by a train of 20 Hz light stimulation from a responsive NDNF+ cell. (G) Group data of light-evoked EPSCs from CA1 SR/SLM interneurons (n = 35 cells/9 mice) and NDNF+ cells (n = 10 cells/3 mice). ***p < 0.001, unpaired t test. Error bars show SEM. (H) A pie chart shows the probability of connectivity between SuMand NDNF+ cells (n = 20 cells/4 mice). (I) A pie chart shows that NDNF+ cells (n = 20/20 cells/4 mice) do not fire suprathreshold APs evoked by 10–20 Hz light stimulation.
Figure 4.
Figure 4.. The SuM excites both VIP+ and VIP cells in the CA1 SR/SLM border
(A) Genetic strategy to target tdTomato into VIP+ cells by crossing a VIP-IRES-Cre line with a floxed tdTomato reporter line (Ai9). (B) Experimental procedure and timeline. (C) Left, a representative confocal image shows a hippocampal slice from a VIP-td mouse that was injected with AAV-ChR2-EYFP into the SuM and underwent whole-cell recording. Right, expanded views of two biocytin-filled VIP+ (asterisk) and VIP (arrowhead) cells in the CA1 SR/SLM border. (D) Current-clamp recording shows the membrane voltage responses to 1 s somatic injections of indicated currents from VIP+ (left) and VIP (right) cells. (E) Voltage-clamp recording shows sample light-evoked EPSC traces recorded from VIP+ and VIP cells (holding potential −70 mV). Blue bars represent light pulses. (F) Group data of light-evoked EPSCs from VIP+ (n = 19 cells/5 mice) and VIP cells (n = 9 cells/4mice). **p < 0.01, unpaired t test. Error bars show SEM. (G) Group data of input resistance from VIP+ (n = 20 cells/5 mice) and VIP cells (n = 10 cells/4 mice). *p < 0.05, unpaired t test. Error bars show SEM. (H) Sample traces of APs evoked by a train of 10 Hz light stimulation in VIP+ (top) and VIP (bottom) cells. (I) Group data of the percentage of VIP+ and VIP cells that receive light-evoked excitatory responses fromthe SuM. The numbers of cells are shown above the bars. (J) Group data of the percentage of VIP+ and VIP cells that fire APs in response to light stimulation. The numbers of cells are shown above the bars.
Figure 5.
Figure 5.. The SuM does not make monosynaptic connections with PV+ or SOM+ cells in CA1
(A) Genetic strategy to target tdTomato into PV+ or SOM+ cells by crossing the PV-IRES-Cre or SOM-IRES-Cre lines with a floxed tdTomato reporter line (Ai9). (B) Experimental procedure and timeline. (C) Representative confocal images show a biocytin-filled PV+ cell from a PV-td mouse that underwent whole-cell recording. Arrowhead shows co-labeling of biocytin and tdTomato. (D) Current-clamp recording shows the membrane voltage responses to 1 s somatic injections of the indicated currents from a PV+ cell. Note the characteristics of the fast-spiking firing pattern of PV+ cells. (E) Voltage-clamp recording shows no light-evoked excitatory synaptic response in a PV+ cell (holding potential −70 mV). (F) Representative confocal images show a biocytin-filled SOM+ cell from a SOM-td mouse that underwent whole-cell recording. Arrowhead shows co-labeling of biocytin and tdTomato. (G) Current-clamp recording shows the membrane voltage responses to 1 s somatic injections of the indicated currents from a SOM+ cell. (H) Voltage-clamp recording shows no light-evoked excitatory synaptic response in a SOM+ cell (holding potential −70 mV). (I) Summary data of the connectivity probability of different subtypes of CA1 interneurons. The numbers of cells are shown above the bars. (J) Summary data of the percentage of different subtypes of CA1 interneurons that fire APs in response to light stimulation. The numbers of cells are shown above the bars.
Figure 6.
Figure 6.. SuM activation drives disynaptic feedforward inhibition to suppress CA1 PN activity
(A) Experimental procedure and timeline. (B) Sample confocal images show a biocytin-filled CA1 PN that underwent whole-cell recording. (C) Current-clamp recording shows membrane voltage responses to 1 s depolarizing or hyperpolarizing current injections in a CA1 PN. (D) Voltage-clamp recording shows the absence of a light-evoked EPSC (top left, holding potential −70 mV) and presence of a light-evoked IPSC (bottom left, holding potential −50 mV) recorded from a CA1 PN. Right: expanded view of the light-evoked IPSC indicated in the bottom left. Note the long delay of onset of the light-evoked IPSC. Blue bars represent light pulses. (E) Current-clamp recording shows the absence (top left, at resting potential) and presence of a light-evoked PSP (bottom left, at −50 mV) recorded from a CA1 PN. Right: expanded view of the light-evoked PSP indicated in the bottom left. Note the long delay of the onset of light-evoked PSP. Blue bars represent light pulses. (F) Group data of light-evoked PSPs from individual CA1 PNs at resting potential and −50 mV; n = 11 cells/7 mice. **p < 0.01, paired t test. Error bars show SEM. (G) Group data of onset of excitatory synaptic events in SR/SLM interneurons (IN-excitation, n = 35 cells/9 mice) versus inhibitory synaptic events in CA1 PNs (PN-inhibition, n = 14 cells/7 mice). Blue bar depicts the duration of light pulses. ***p < 0.001, unpaired t test. Error bars show SEM. (H and I) Sample traces (H) and group data (I) of light-evoked IPSCs in the absence and presence of DNQX/APV (holding potential 0 mV). **p < 0.01, paired t test, n = 5 cells/3 mice. Error bars show SEM. (J) The probability of excitatory and inhibitory connections in CA1 PNs. Numbers of cells are shown above bars. (K and L) Sample traces (K) and group data (L) of membrane voltage responses evoked by a train of 10 Hz light stimulation at resting potential (n = 6 cells/4 mice) or at −50 mV (n = 8 cells/4 mice) in CA1 PNs. **p < 0.01, two-way ANOVA repeated measures followed by a Tukey test. Error bars show SEM. (M) Sample traces of spikes elicited by constant current injections, paired without (top) or with (bottom) a train of 10 Hz light stimulation in a CA1 PN. (N) Group data of the number of spikes elicited by constant current injections, paired without or with a train of 10 Hz light stimulation in CA1 PNs (n = 9 cells/5 mice). **p < 0.01, paired t test. Error bars show SEM.

References

    1. Kesner AJ, Mozaffarilegha M, Thirtamara Rajamani K, Arima Y, Harony-Nicolas H, Hashimotodani Y, Ito HT, Song J, and Ikemoto S (2023). Hypothalamic Supramammillary Control of Cognition and Motivation. J. Neurosci 43, 7538–7546. 10.1523/JNEUROSCI.1320-23.2023. - DOI - PMC - PubMed
    1. Pan WX, and McNaughton N (2004). The supramammillary area: its organization, functions and relationship to the hippocampus. Prog. Neurobiol 74, 127–166. 10.1016/j.pneurobio.2004.09.003. - DOI - PubMed
    1. Pedersen NP, Ferrari L, Venner A, Wang JL, Abbott SBG, Vujovic N, Arrigoni E, Saper CB, and Fuller PM (2017). Supramammillary glutamate neurons are a key node of the arousal system. Nat. Commun 8, 1405. 10.1038/s41467-017-01004-6. - DOI - PMC - PubMed
    1. Renouard L, Billwiller F, Ogawa K, Clément O, Camargo N, Abdelkarim M, Gay N, Scoté-Blachon C, Touré R, Libourel PA, et al. (2015). The supramammillary nucleus and the claustrum activate the cortex during REM sleep. Sci. Adv 1, e1400177. 10.1126/sciadv.1400177. - DOI - PMC - PubMed
    1. Li M, Kinney JL, Jiang YQ, Lee DK, Wu Q, Lee D, Xiong WC, and Sun Q (2023). Hypothalamic Supramammillary Nucleus Selectively Excites Hippocampal CA3 Interneurons to Suppress CA3 Pyramidal Neuron Activity. J. Neurosci 43, 4612–4624. 10.1523/JNEUROSCI.1910-22.2023. - DOI - PMC - PubMed

Publication types

Substances

LinkOut - more resources