Comparative Study
. 2024 Nov 26;43(11):114875.
doi: 10.1016/j.celrep.2024.114875. Epub 2024 Oct 23.

Comparing neoantigen cancer vaccines and immune checkpoint therapy unveils an effective vaccine and anti-TREM2 macrophage-targeting dual therapy

Affiliations
Comparative Study

Comparing neoantigen cancer vaccines and immune checkpoint therapy unveils an effective vaccine and anti-TREM2 macrophage-targeting dual therapy

Sunita Keshari et al. Cell Rep. .

Abstract

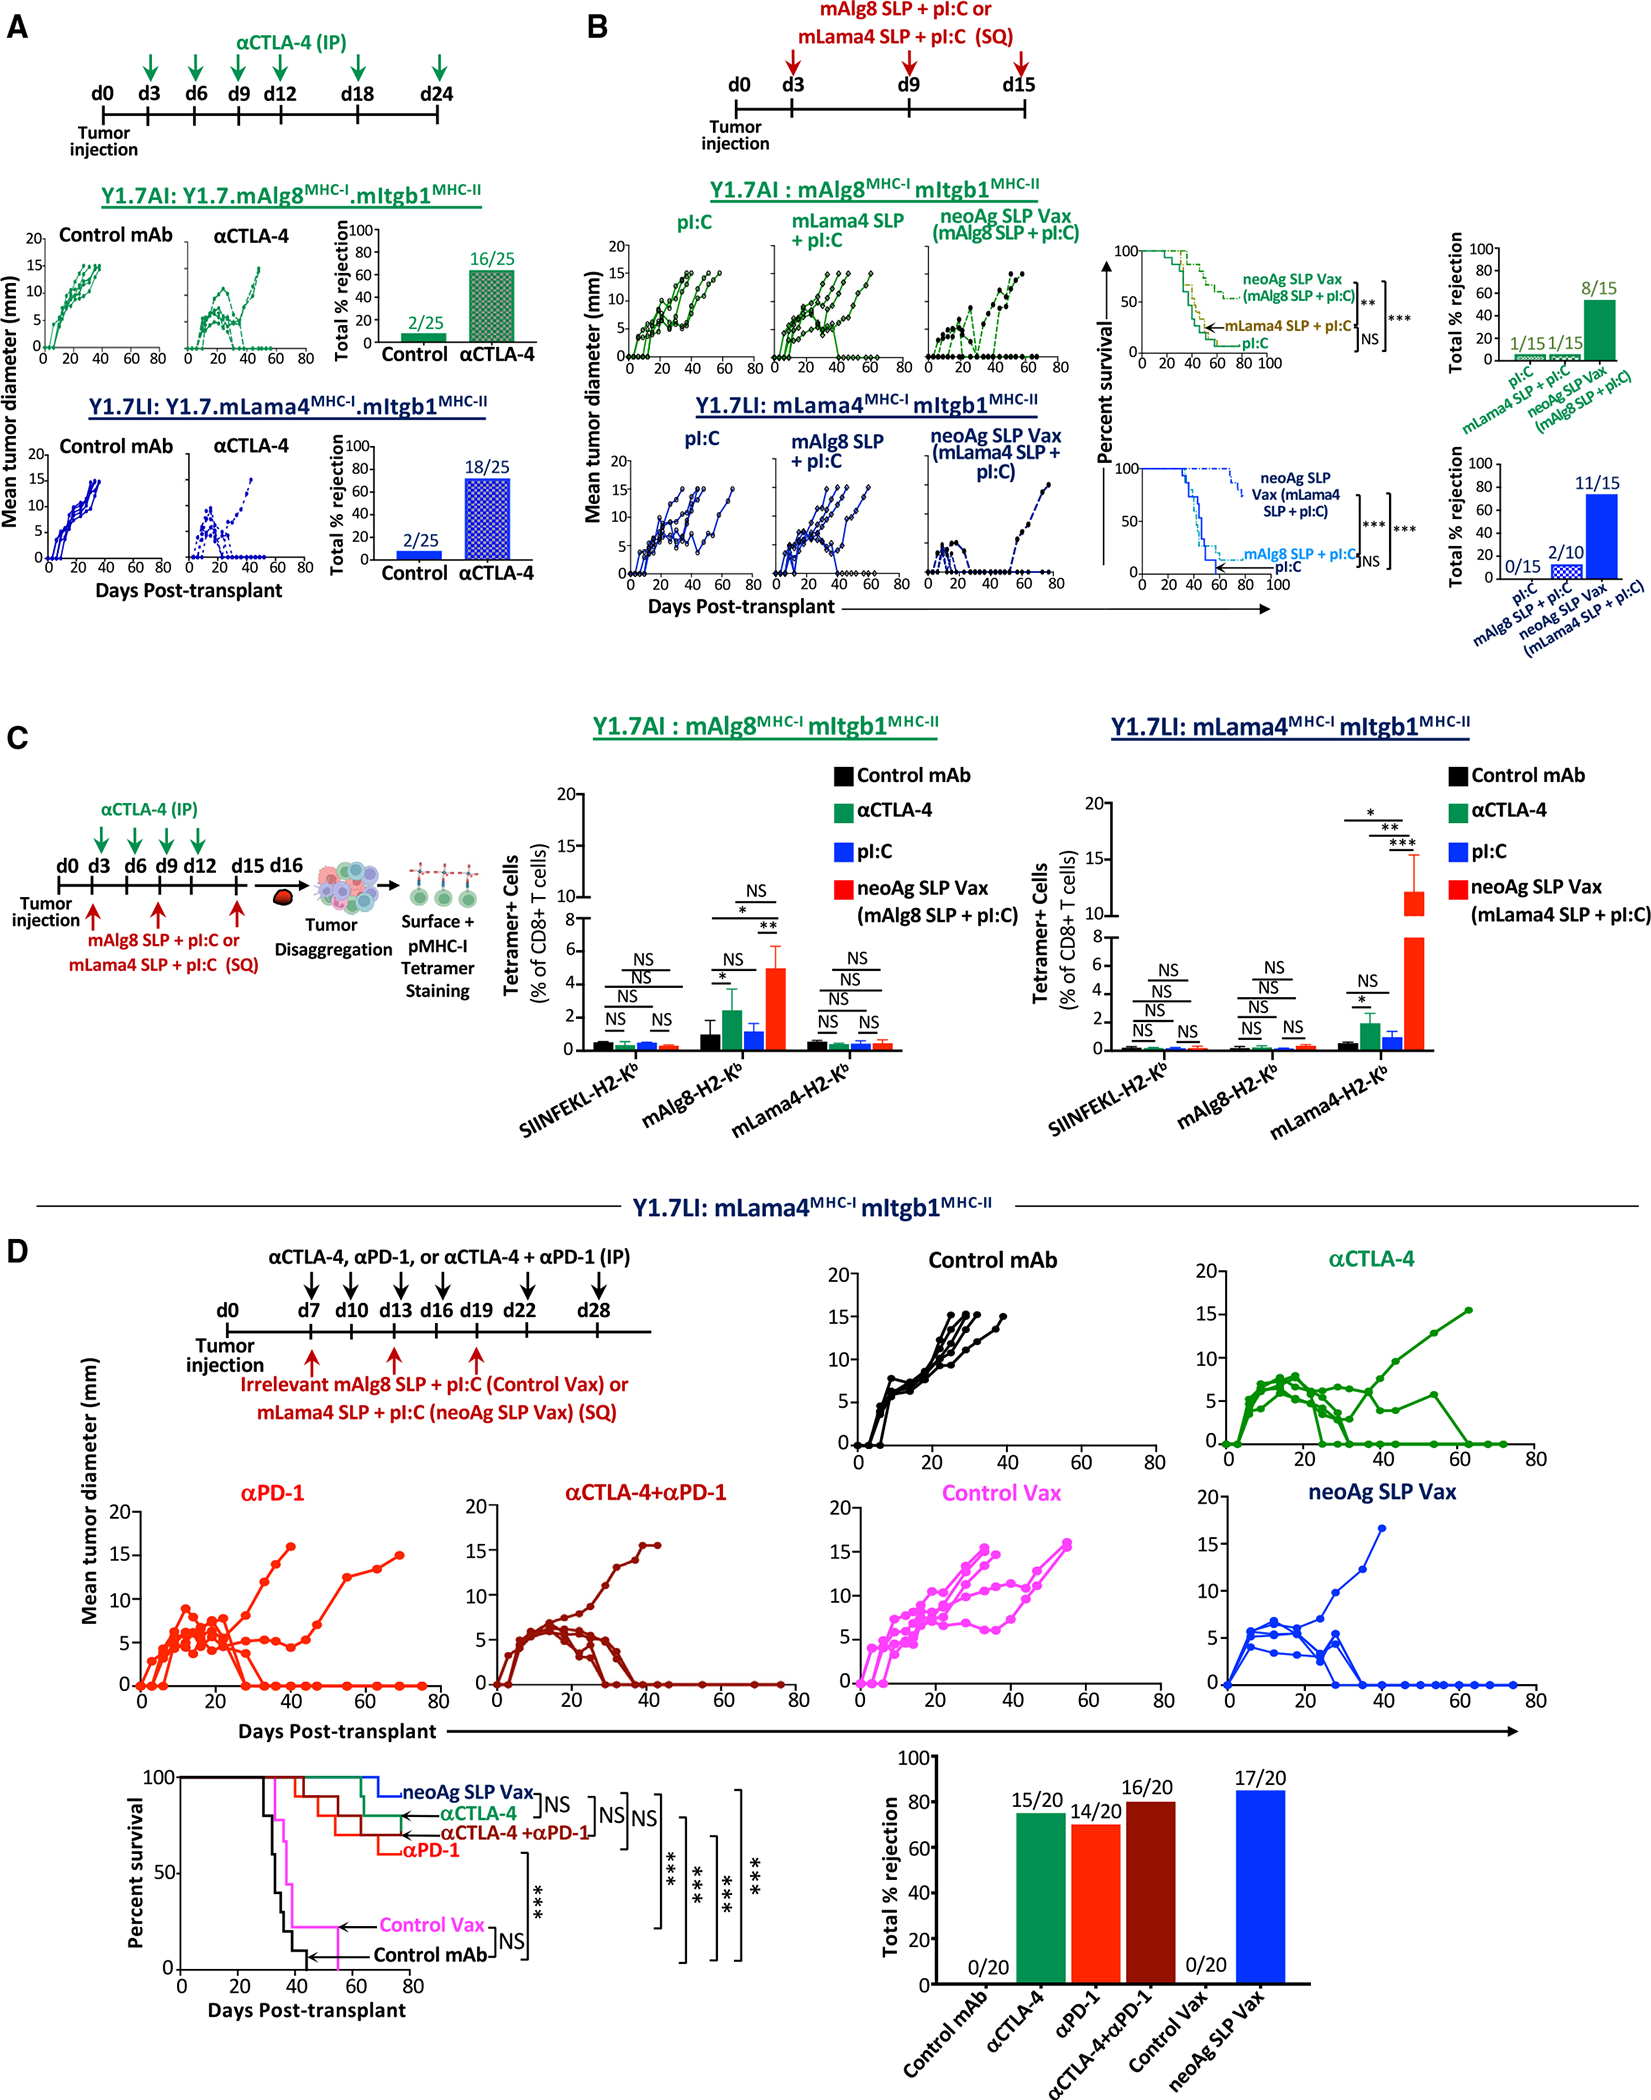
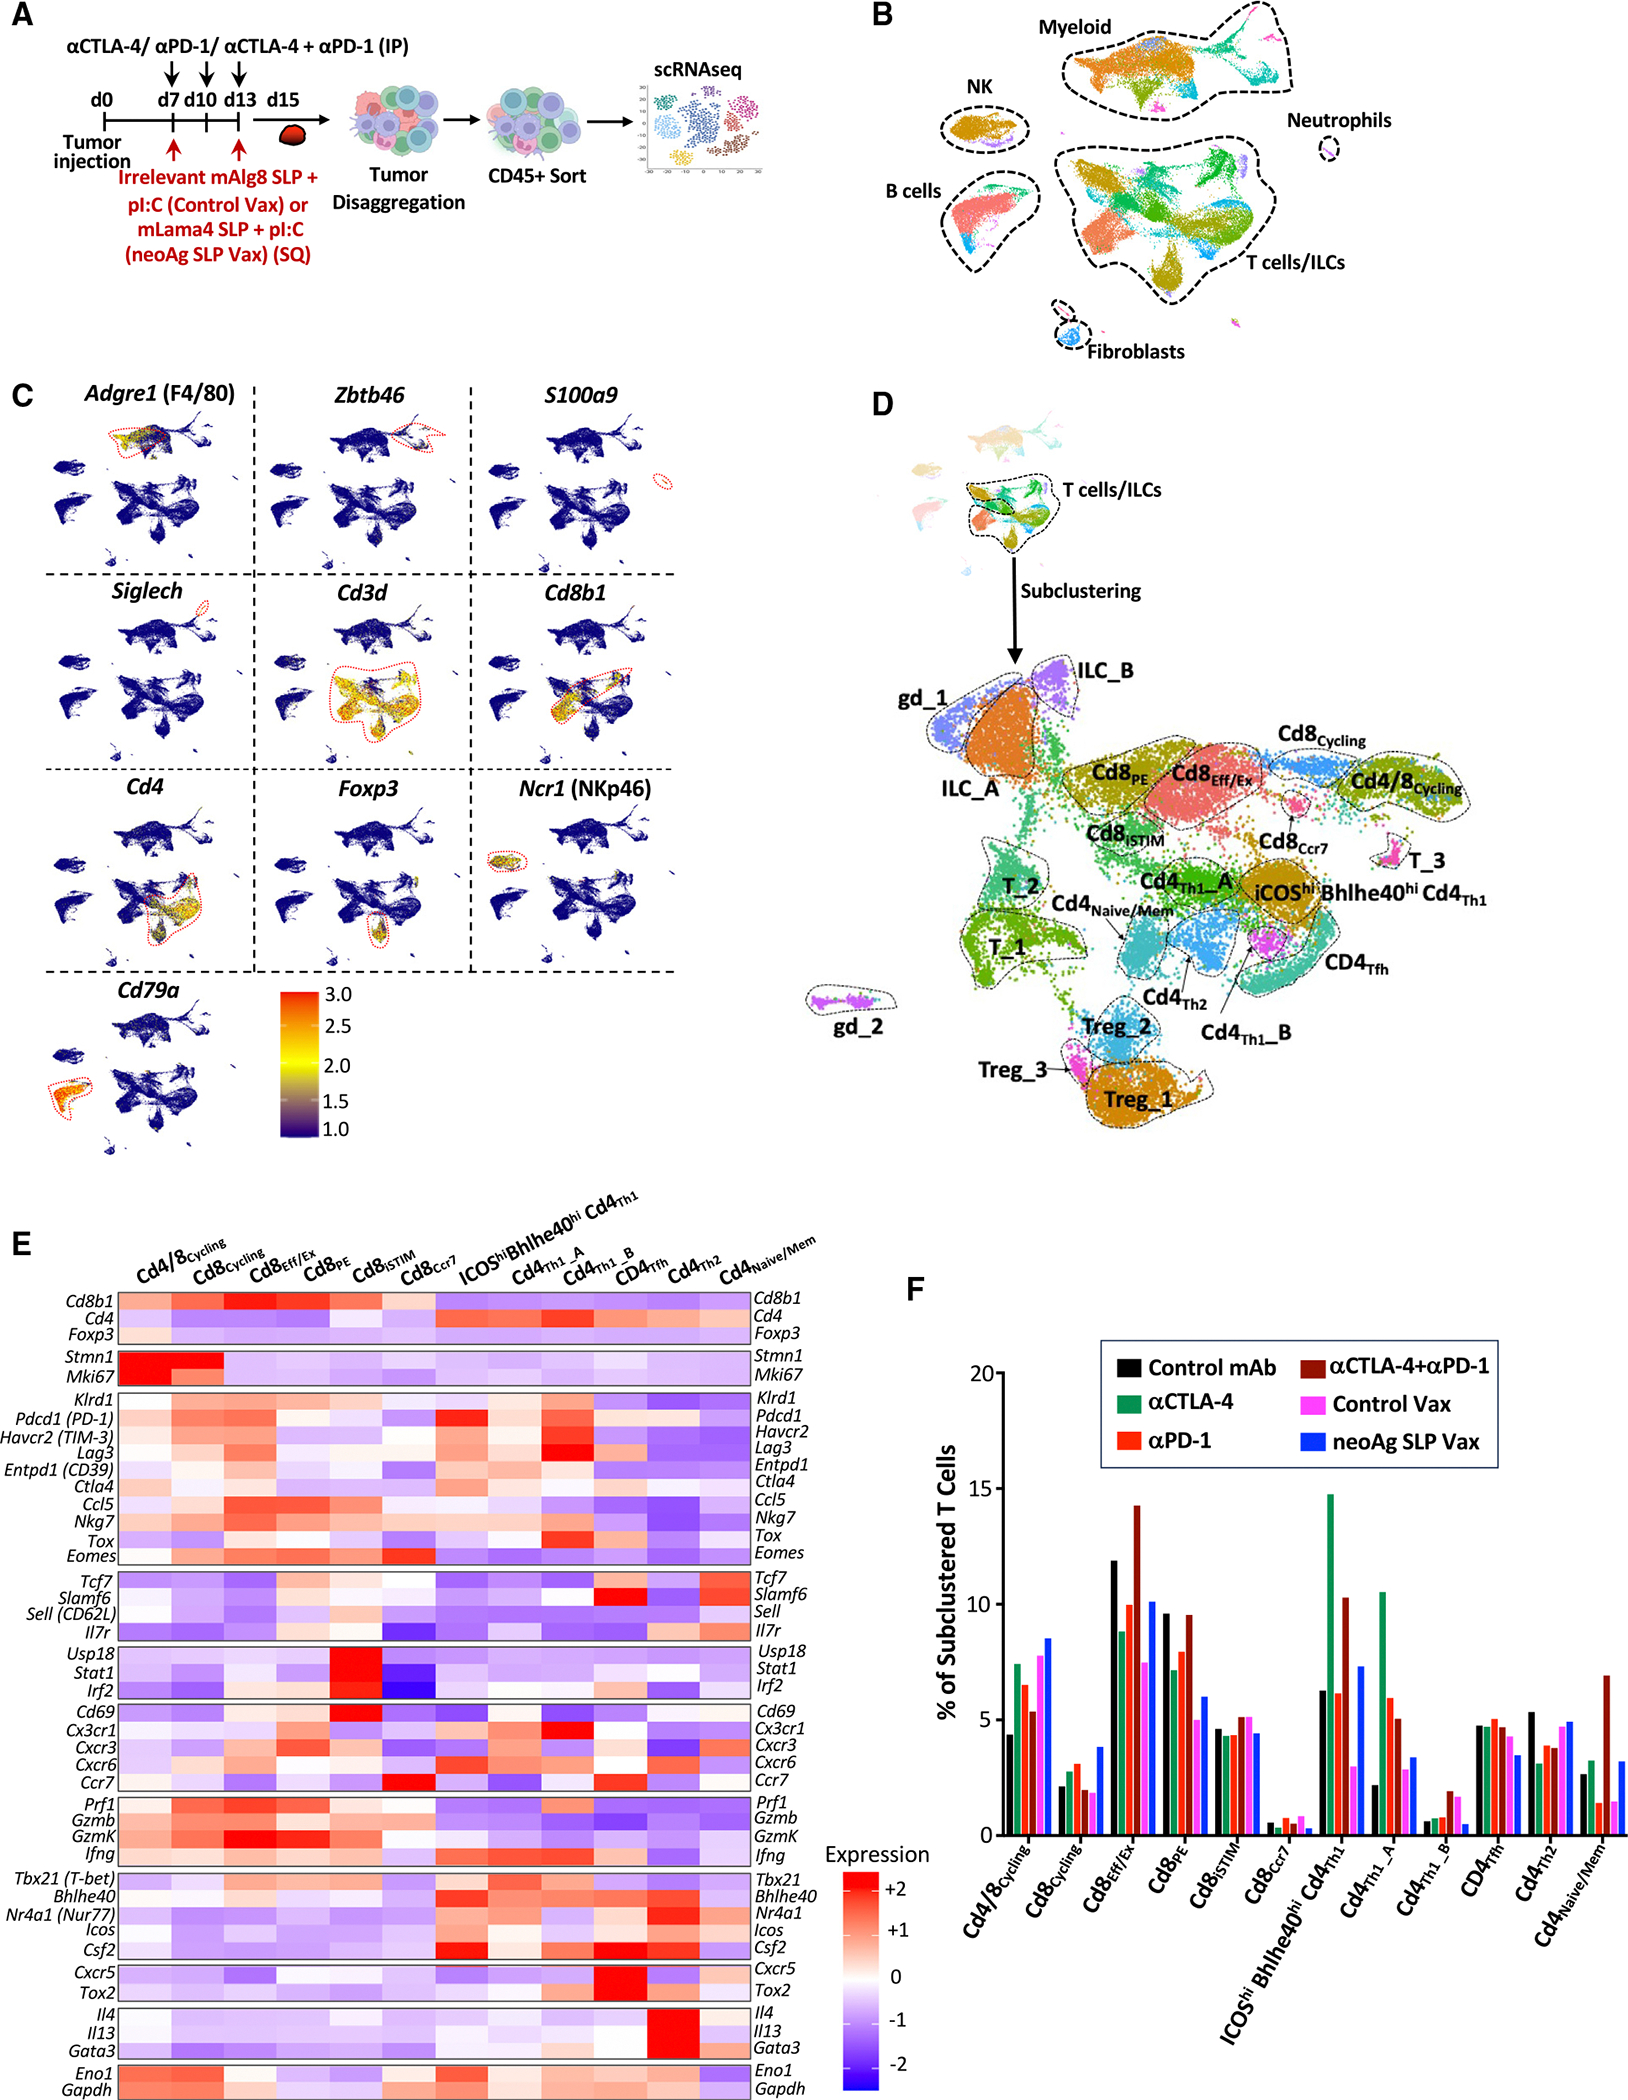
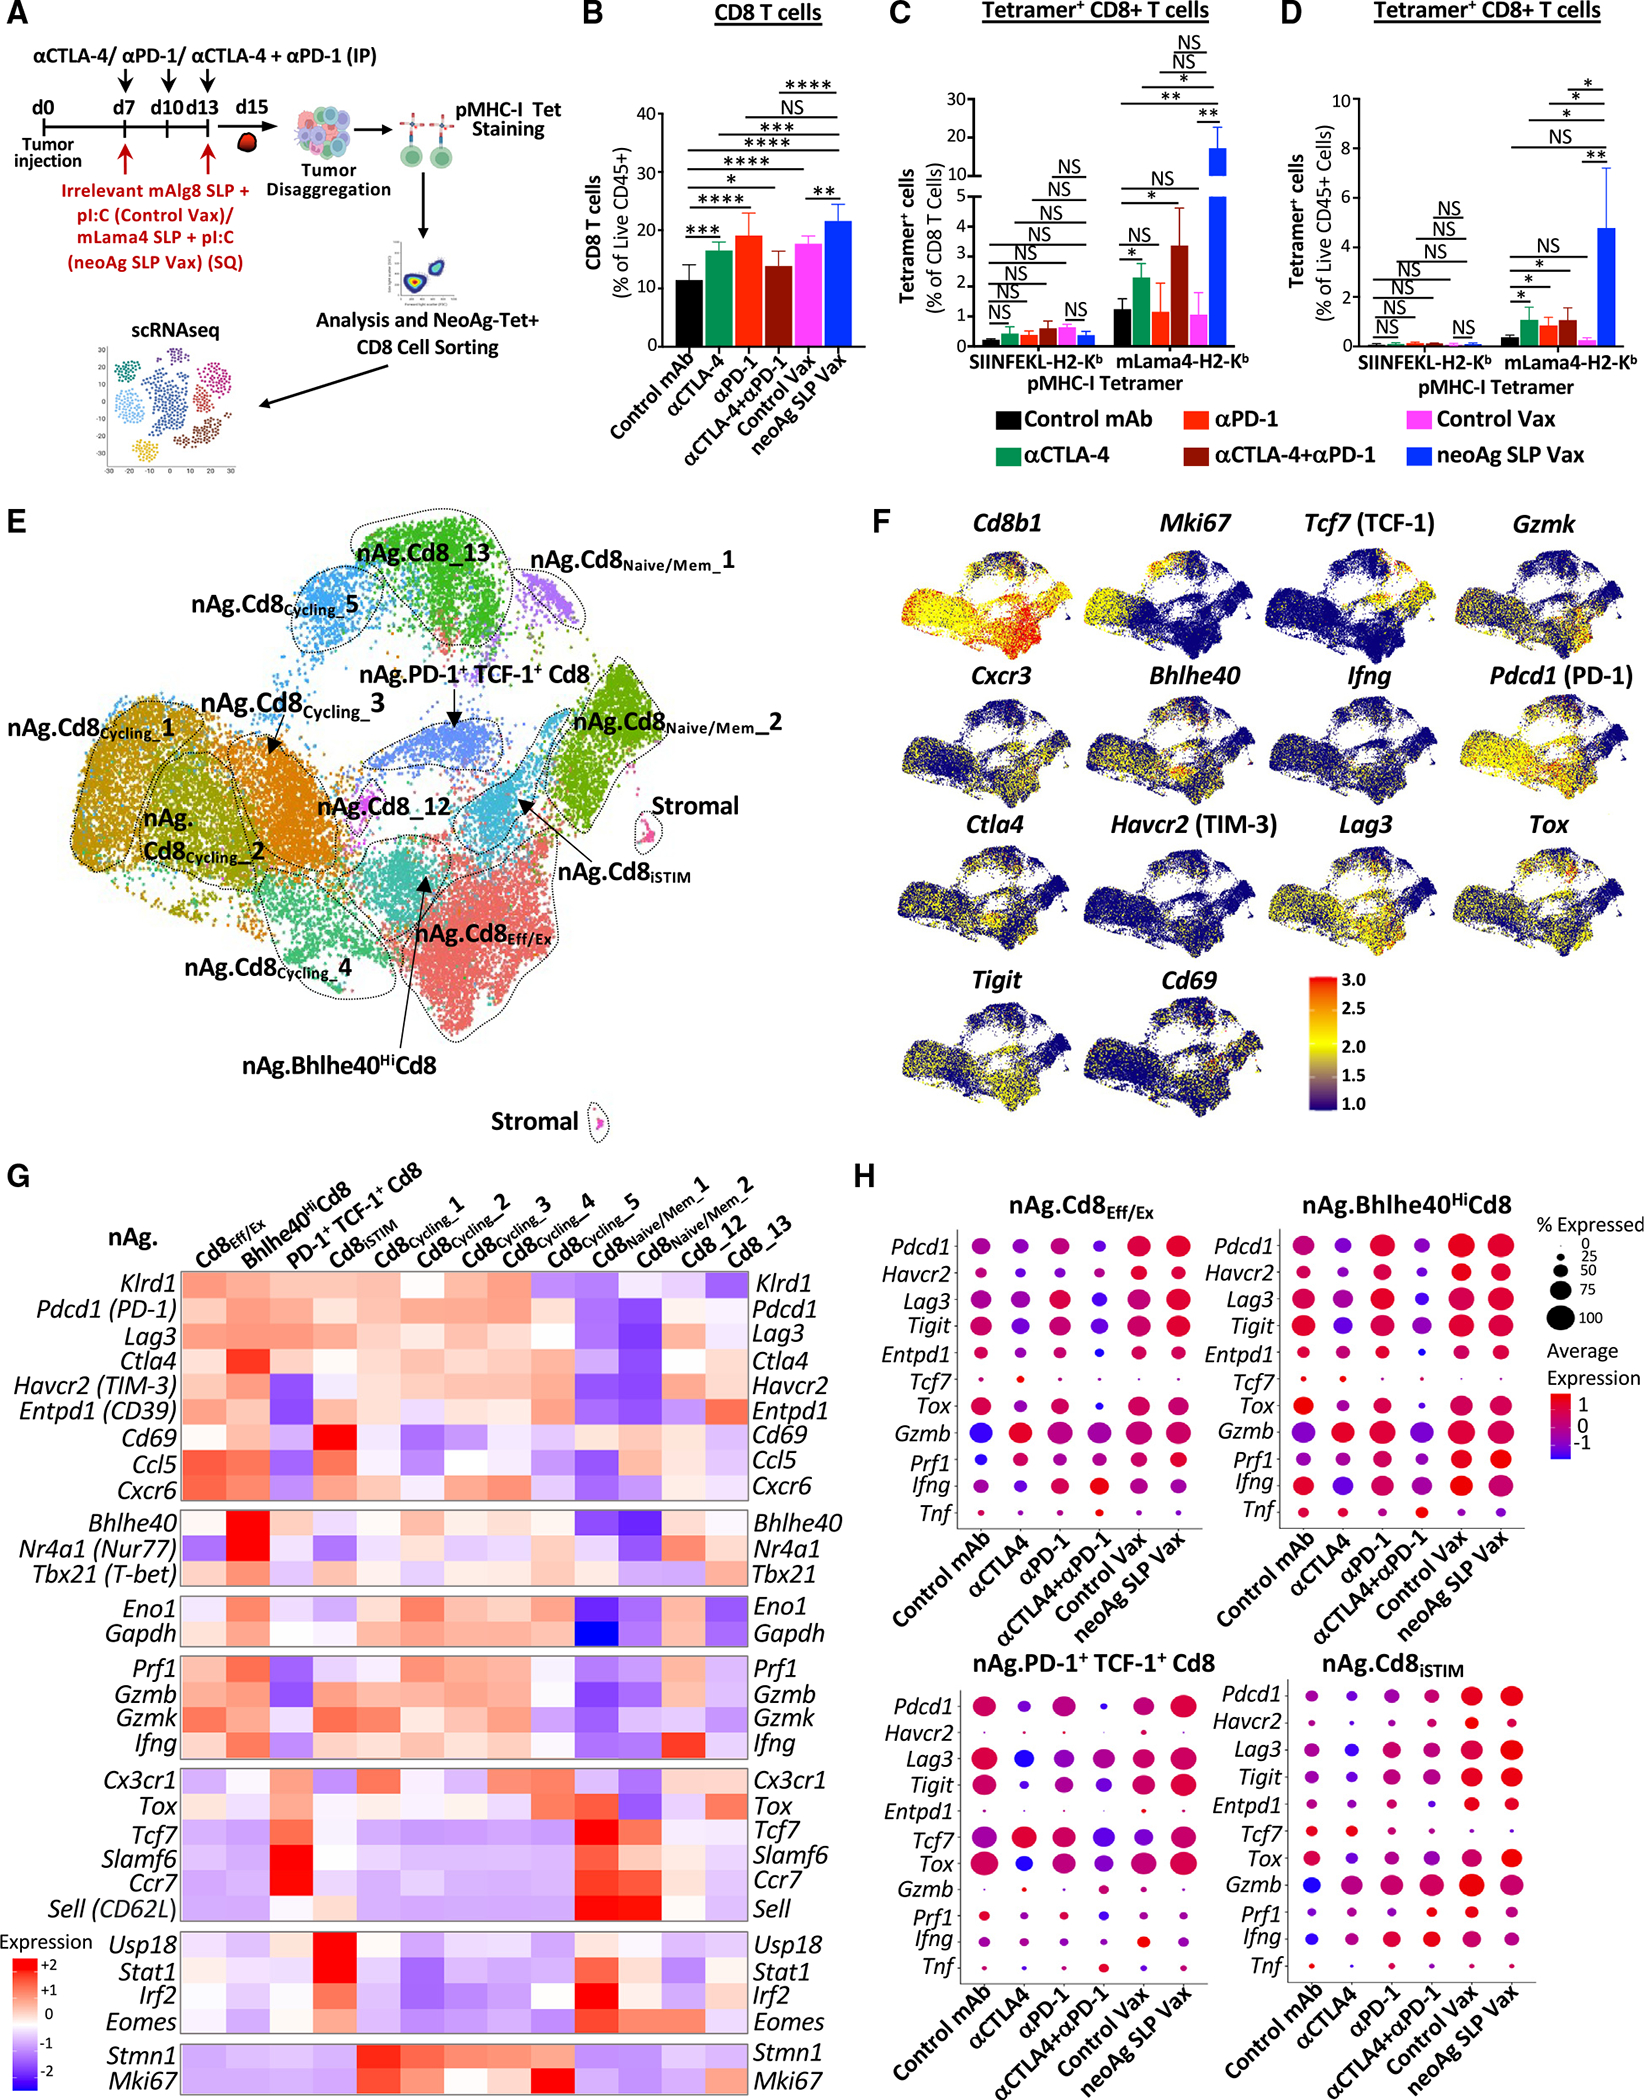
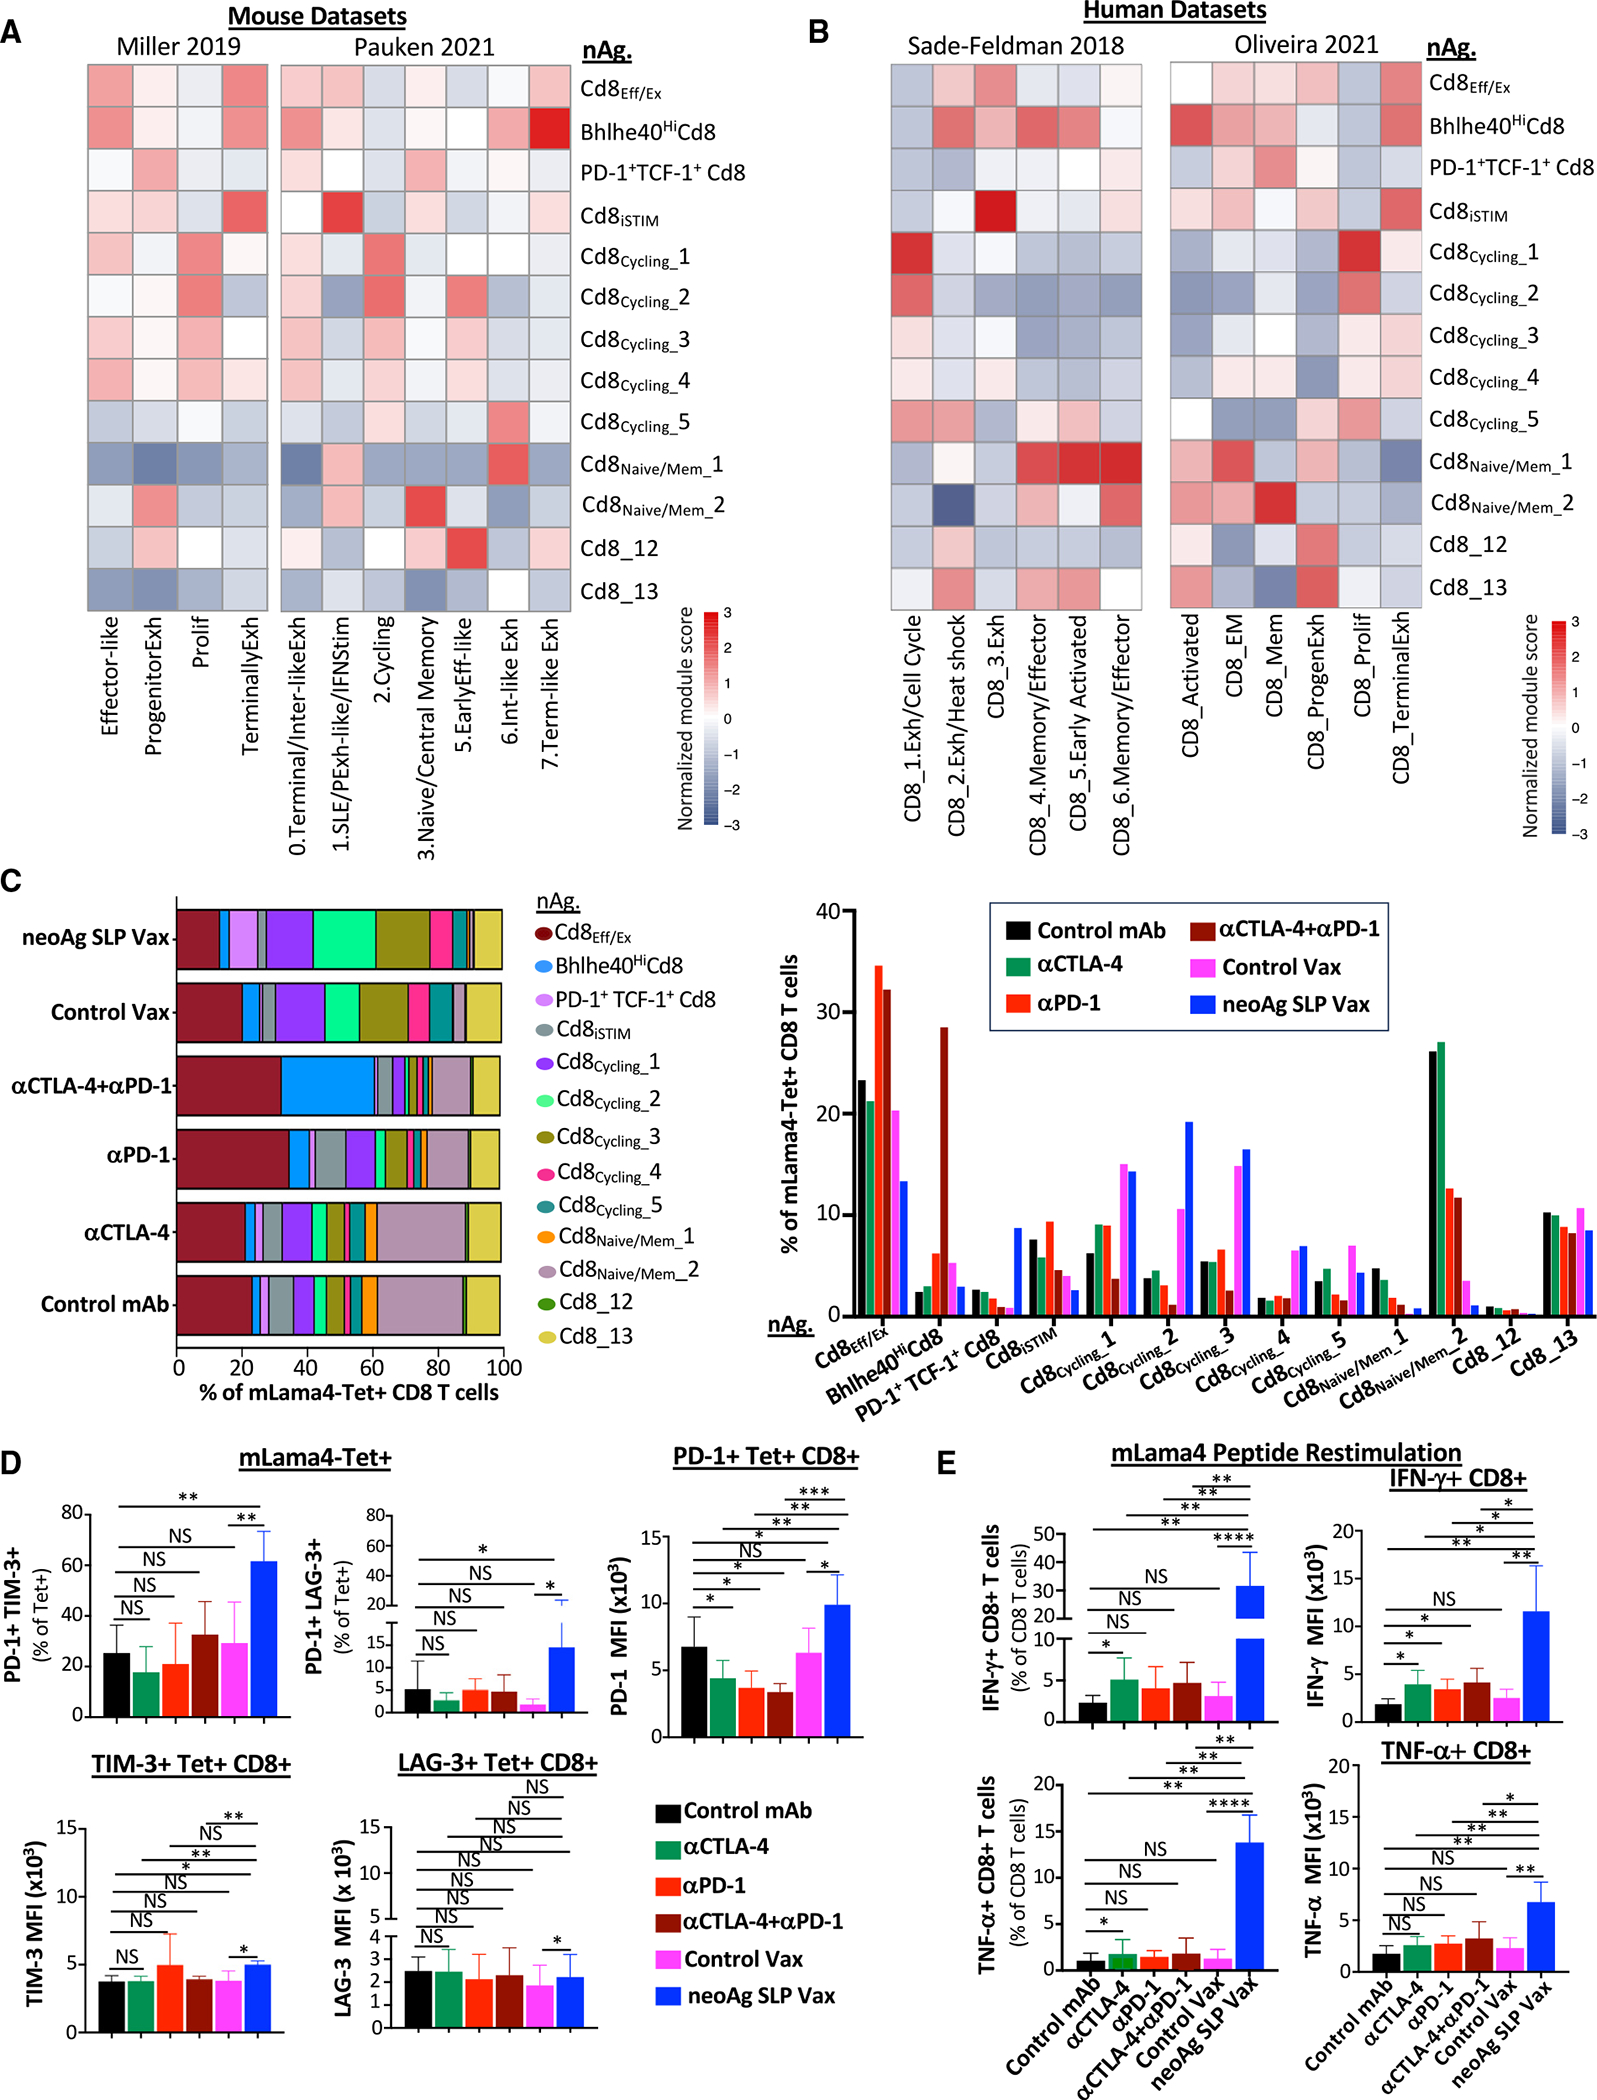
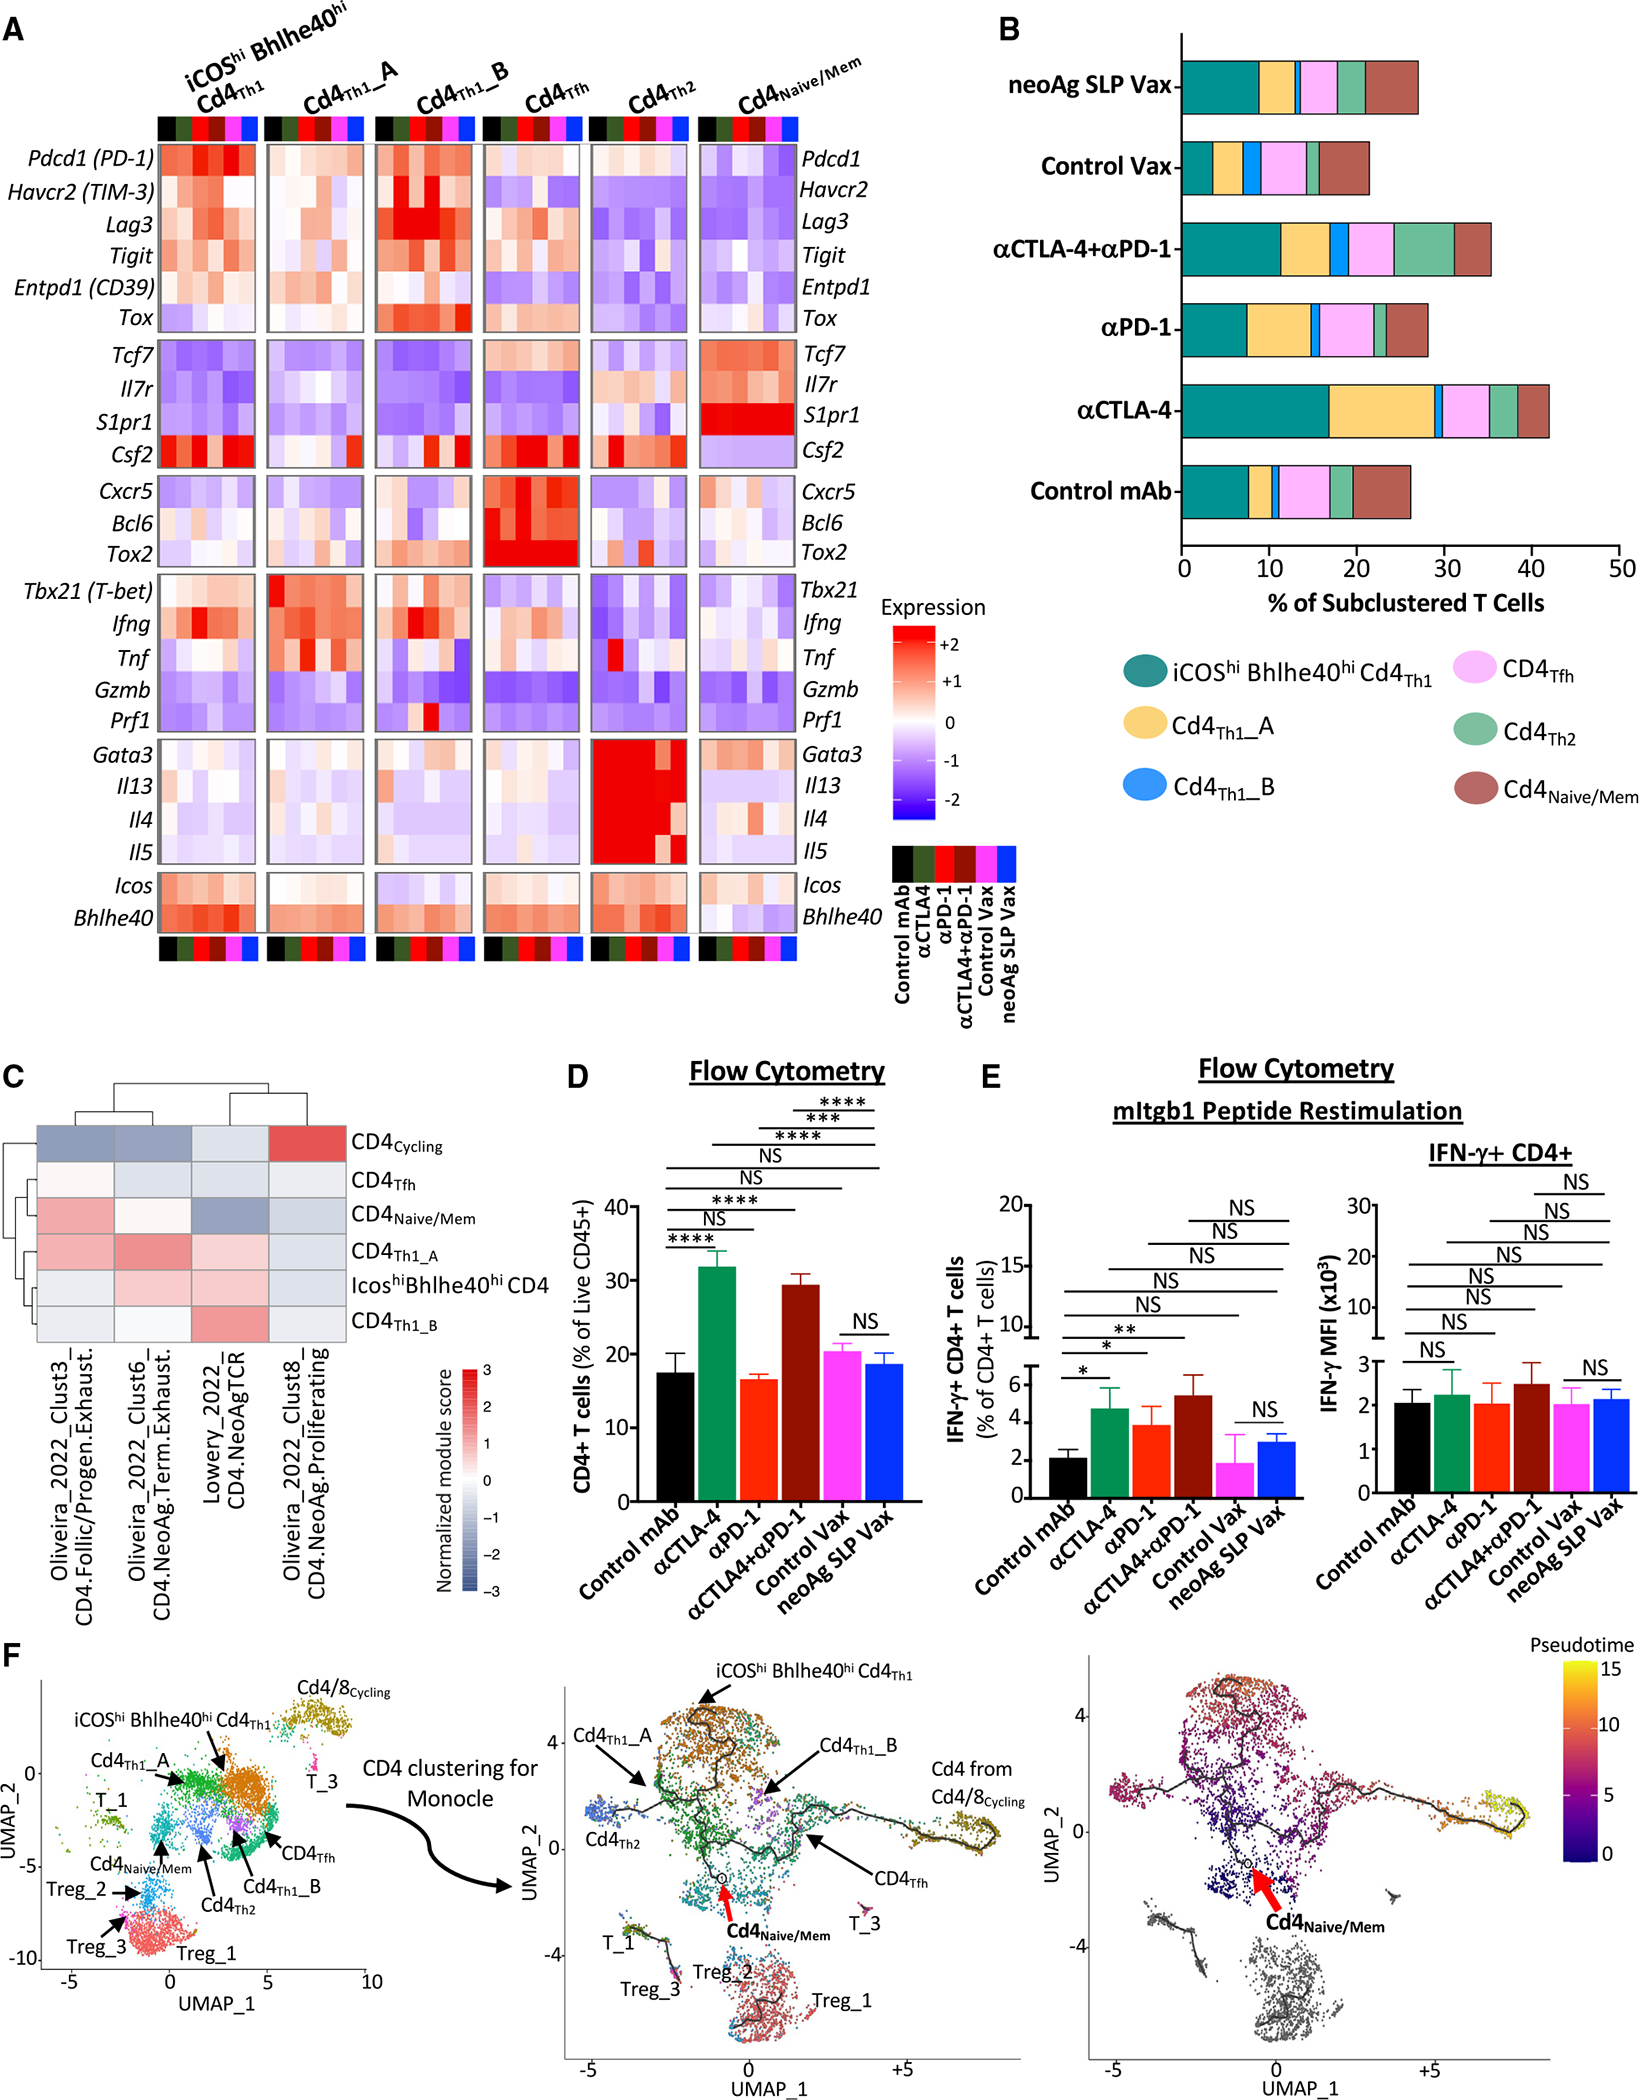
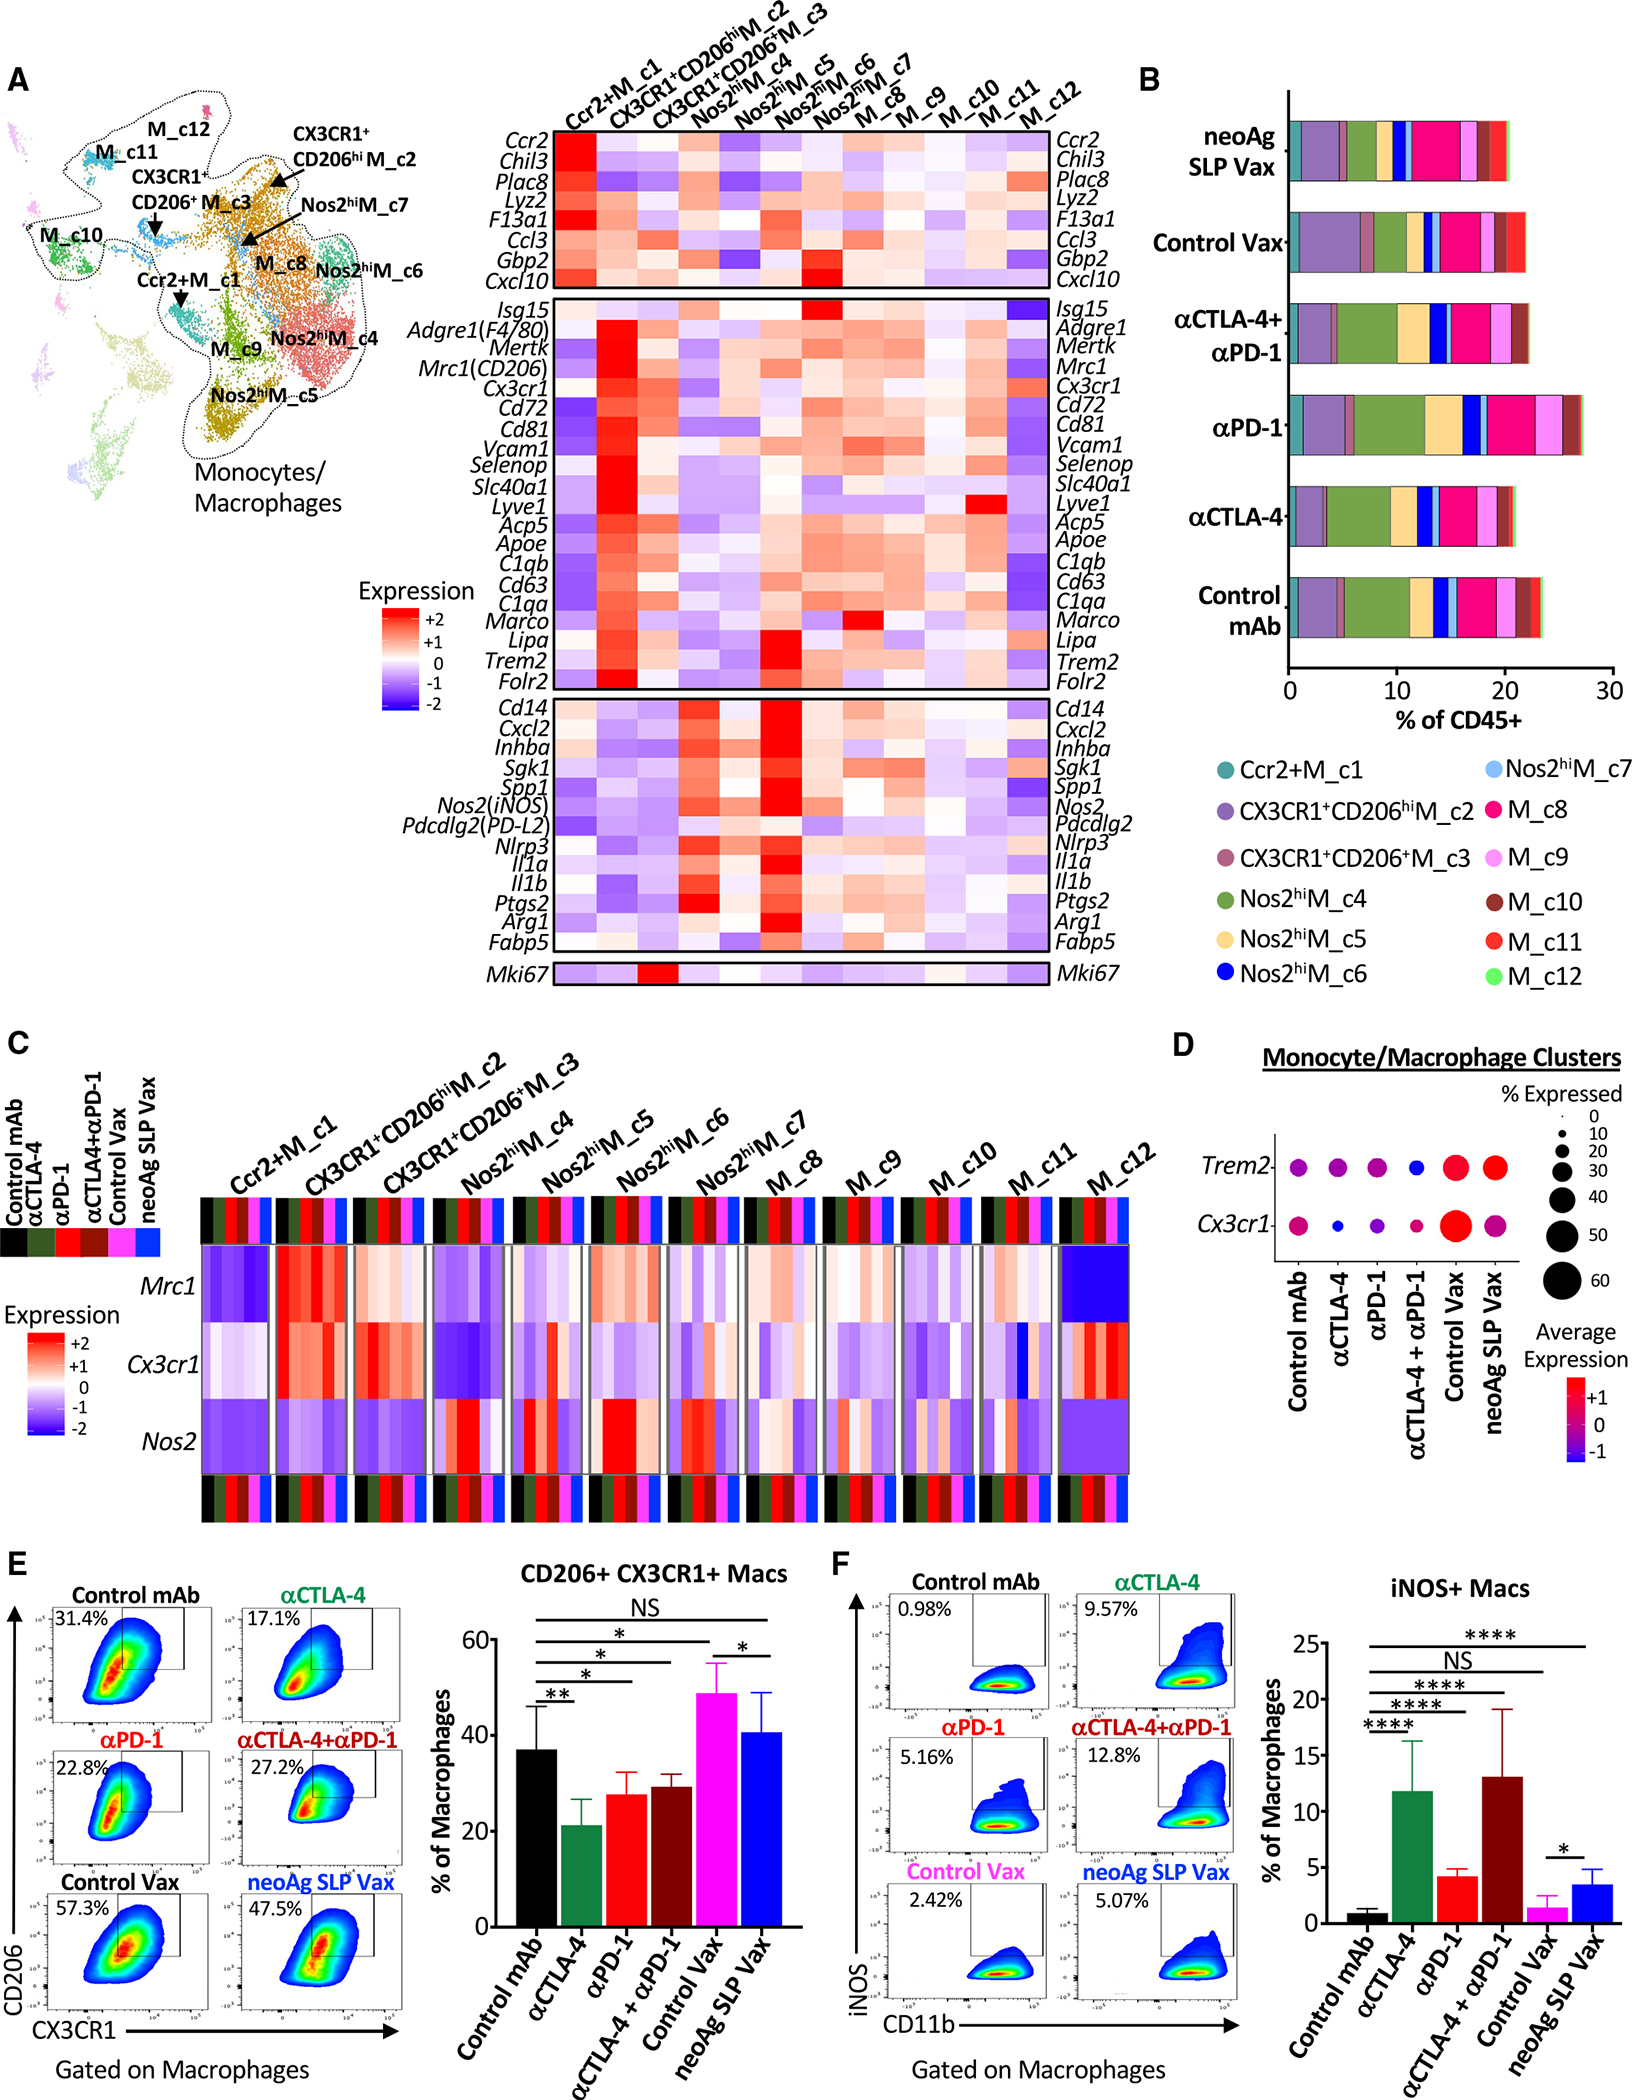
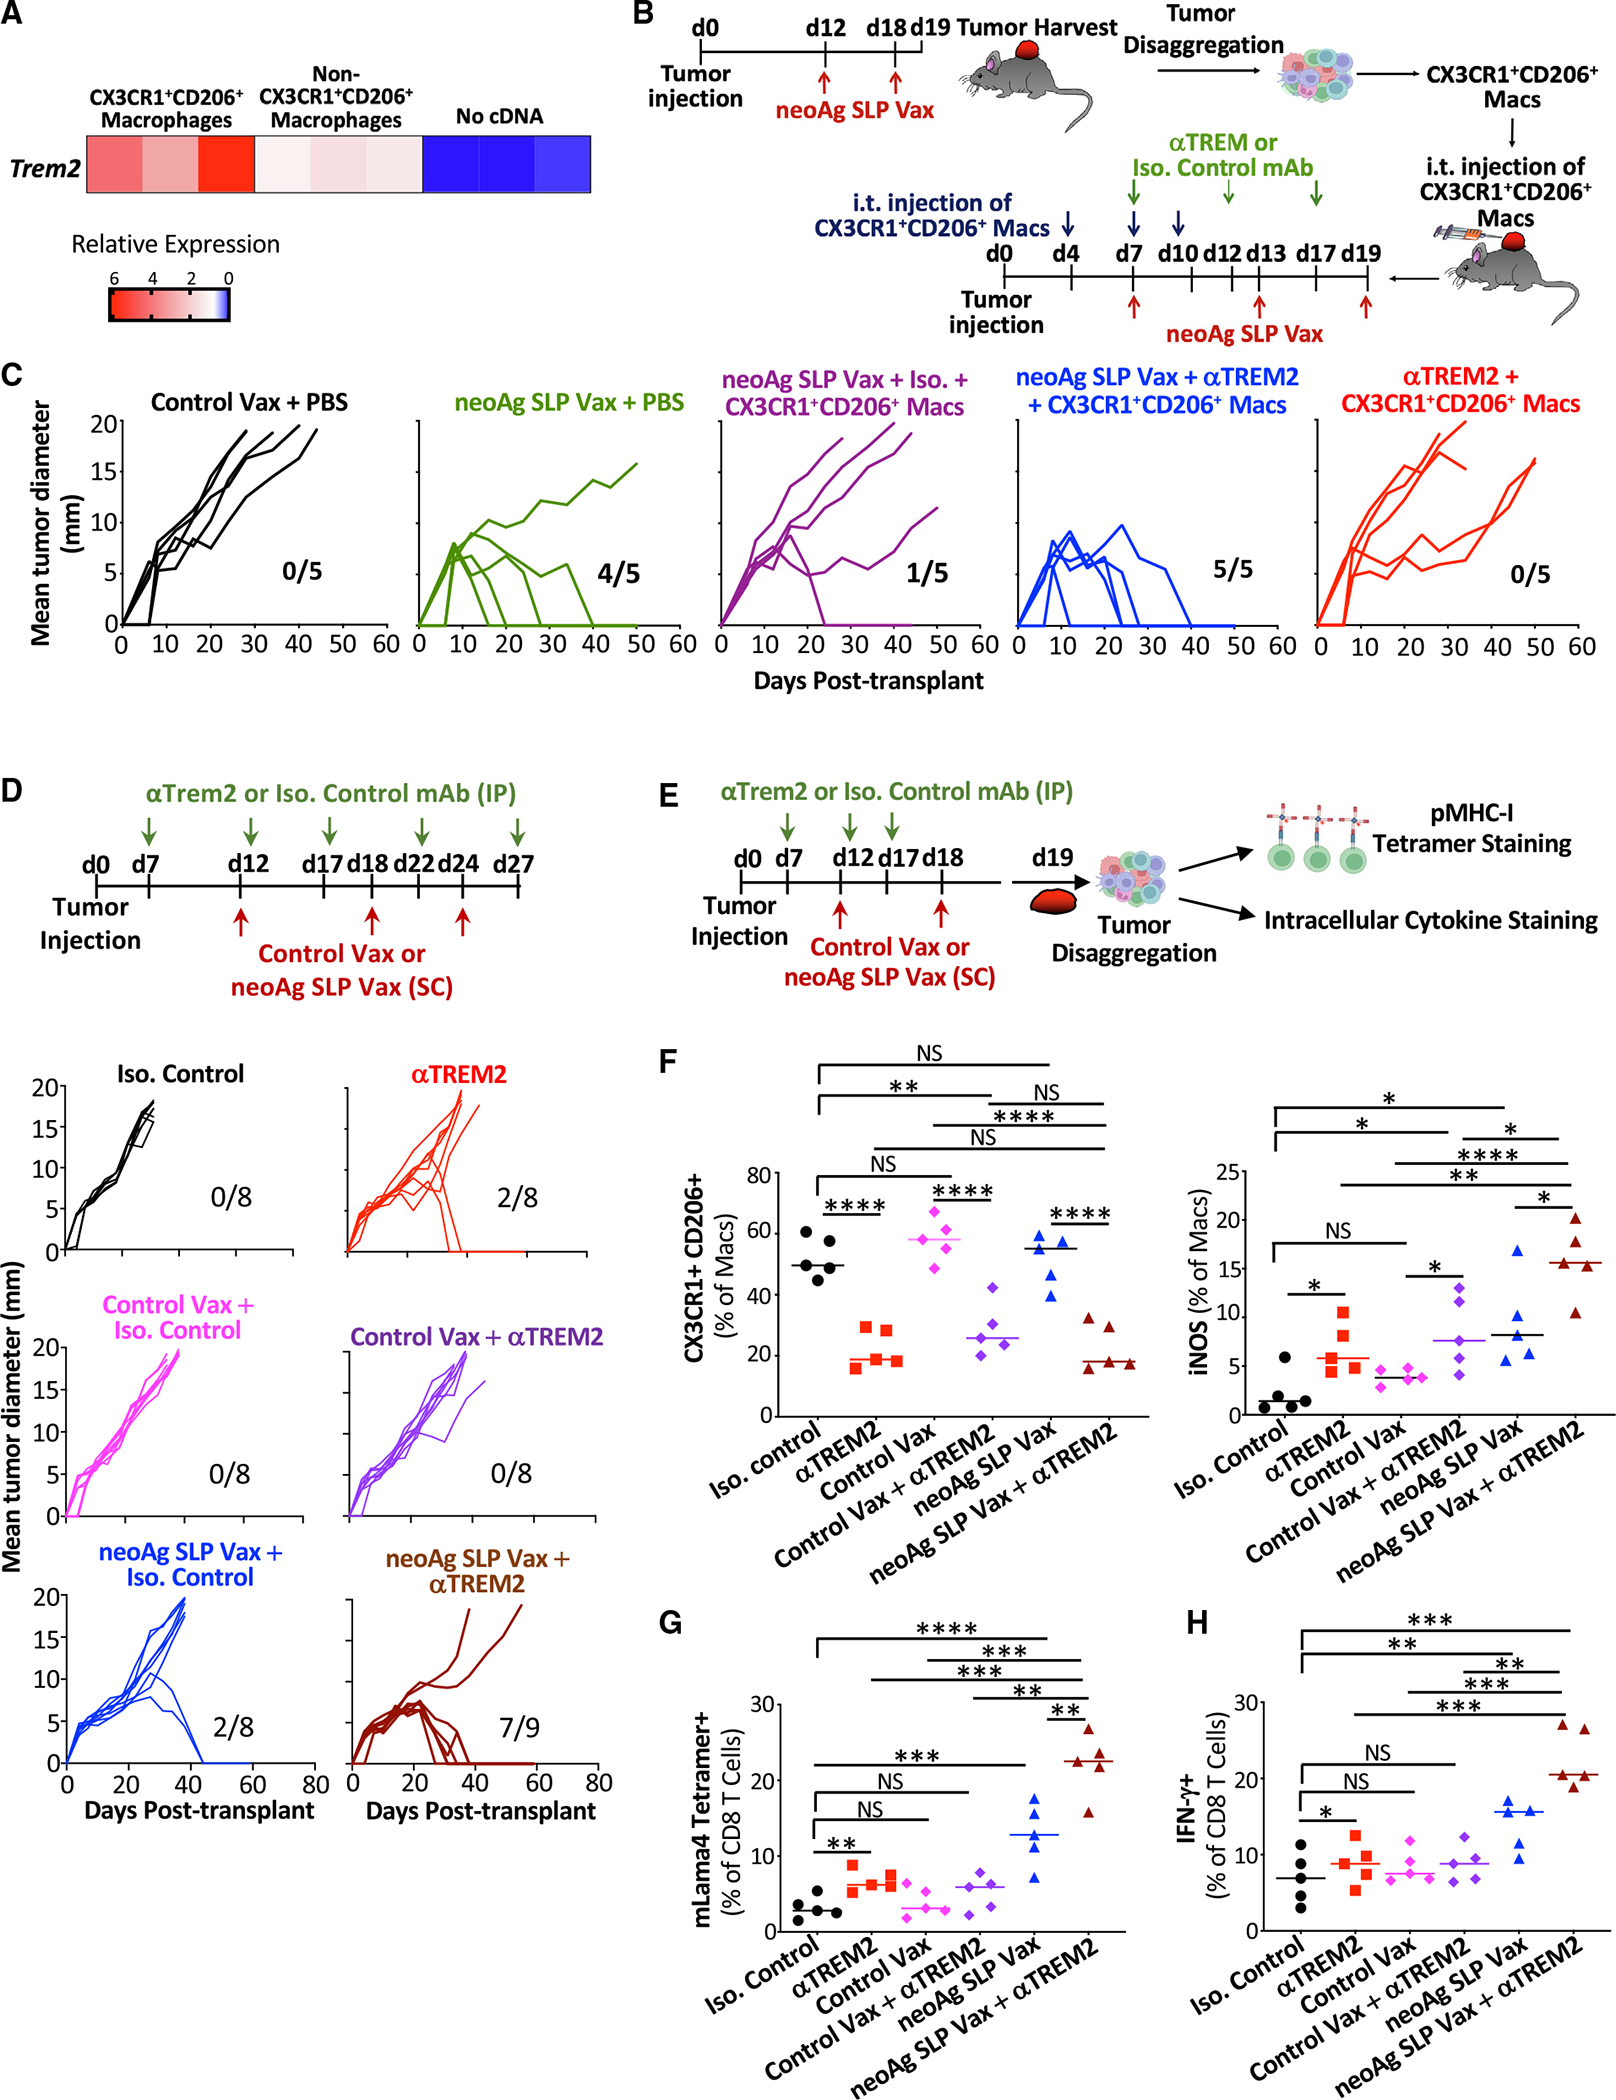
The goal of therapeutic cancer vaccines and immune checkpoint therapy (ICT) is to promote T cells with anti-tumor capabilities. Here, we compared mutant neoantigen (neoAg) peptide-based vaccines with ICT in preclinical models. NeoAg vaccines induce the most robust expansion of proliferating and stem-like PD-1+TCF-1+ neoAg-specific CD8 T cells in tumors. Anti-CTLA-4 and/or anti-PD-1 ICT promotes intratumoral TCF-1- neoAg-specific CD8 T cells, although their phenotype depends in part on the specific ICT used. Anti-CTLA-4 also prompts substantial changes to CD4 T cells, including induction of ICOS+Bhlhe40+ T helper 1 (Th1)-like cells. Although neoAg vaccines or ICTs expand iNOS+ macrophages, neoAg vaccines maintain CX3CR1+CD206+ macrophages expressing the TREM2 receptor, unlike ICT, which suppresses them. TREM2 blockade enhances neoAg vaccine efficacy and is associated with fewer CX3CR1+CD206+ macrophages and induction of neoAg-specific CD8 T cells. Our findings highlight different mechanisms underlying neoAg vaccines and different forms of ICT and identify combinatorial therapies to enhance neoAg vaccine efficacy.

Keywords: CD4 T cells; CP: Cancer; CP: Immunology; TREM2; anti-CTLA-4/anti-PD-1; cancer immunotherapy; combination immunotherapy; immune checkpoint therapy; intratumoral macrophages; neoantigen cancer vaccines; neoantigen-specific CD8 T cells; tumor microenvironment.


Conflict of interest statement

Declaration of interests A.M.H. is currently employed by Lifecycle Biotechnologies, and her employment does not pose any direct conflict of interest with the research presented in this article. M.M.G. reports a personal honorarium of US $1,000.00 per year from Springer Nature Ltd (as an associate editor for Nature Precision Oncology) and served as a paid consultant for Merck. M. Colonna reports that they are a member of the scientific advisory board of Vigil Neuro and Cell Signaling Technology, received research grants from Vigil Neuro during the conduct of the study, and has a patent related to TREM2 modulation pending (PCT/US2021/019914). K.E.P. reports an advising relationship with Guardant Health that will result in advising fees.

Figures

Figure 1.
Figure 1.. NeoAg SLP vaccines or ICTs inhibit neoAg-expressing BrafV600EPten−/−Cdkn2a−/− melanoma outgrowth
(A) Tumor growth and percentage tumor rejection in mice transplanted with Y1.7mAMHC-I.mIMHC-II (Y1.7AI) or Y1.7mLMHC-I.mIMHC-II (Y1.7LI) melanoma cells and treated with control mAb or anti-CTLA-4 ICT starting on day 3 post-tumor transplant. (B) Tumor growth, cumulative mouse survival, and percentage tumor rejection in Y1.7AI and Y1.7LI melanoma-bearing mice treated with mAlg8 or mLama4 neoAg SLP (plus pI:C) vaccines or pI:C alone starting on day 3 post-tumor transplant. (C) mAlg8 or mLama4 tetramer-specific CD8 T cells in Y1.7AI and Y1.7LI tumors treated with control mAb, anti-CTLA-4, pI:C, mAlg8 SLP + pI:C (neoAg SLP vaccine for Y1.7AI), or mLama4 SLP + pI:C (neoAg SLP vaccine for Y1.7LI) as in (A) and (B) and harvested on day 16 post-tumor transplant. SIINFEKL-H2-Kb tetramer served as an irrelevant control. (D) Tumor growth, cumulative mouse survival, and percentage tumor rejection in Y1.7LI tumor-bearing mice treated with control mAb, anti-CTLA-4, anti-PD-1, anti-CTLA-4 + anti-PD-1, irrelevant (for Y1.7LI) mAlg8 SLP + pI:C (control vax), or relevant mLama4 SLP + pI:C (neoAg SLP vax) starting on day 7 post-tumor transplant. For (A), (B), and (D), tumor growth is presented as mean tumor diameter of individual mice, tumor rejection graphs display cumulative percentage of mice with complete tumor rejection, and cumulative survival curves include mice from at least three independent experiments (**p < 0.01, ***p < 0.001; NS, not significant; log-rank [Mantel-Cox] test). Bar graphs in (C) display mean ± SEM and are representative of at least three independent experiments (*p < 0.05, **p < 0.01, ***p < 0.005; NS, not significant; unpaired, two-tailed Student’s t test). See also Figure S1.
Figure 2.
Figure 2.. scRNA-seq of intratumoral immune cells from Y1.7LI melanoma-bearing mice treated with neoAg SLP vaccines or ICT
(A) Y1.7LI melanoma-bearing mice were treated as indicated beginning on day 7 post-tumor transplant. Tumors from individual mice were harvested on day 15, pooled, and processed, and live CD45+ cells were sorted and analyzed by scRNA-seq. (B) Uniform manifold approximation and projection (UMAP) plot from scRNA-seq of intratumoral CD45+ cells with annotated cell types. (C) Feature plot showing lineage-specific transcripts. (D) Feature plots displaying subclustering of activated T cell-containing clusters. (E) Heatmap displaying average expression of select transcripts by cluster. (F) Frequency of subclustered T cell-containing clusters by treatment. See also Figure S4 and Table S1.
Figure 3.
Figure 3.. Characterization of neoAg-specific CD8 T cells in neoAg SLP vaccine- and ICT-treated mice
(A) Y1.7LI melanoma-bearing mice were treated as indicated beginning on day 7 post-tumor transplant. Tumors from individual mice were harvested on day 15, pooled, processed, and stained with mLama4-H2-Kb tetramers for analysis (B–D) or for sorting of mLama4 tetramer-positive CD8 T cells for scRNA-seq (E–H). (B) Graph displaying CD8 T cells as a percentage of intratumoral live CD45+ cells. (C and D) Graphs displaying irrelevant SIINFELK tetramer- or mLama4 tetramer-positive CD8 T cells as a percentage of (C) CD8 T cells and (D) CD45+ cells. (E) UMAP plot and cell-type annotations from scRNA-seq of mLama4 neoAg-specific CD8 T cells. (F) Feature plots displaying expression of select phenotype and lineage transcripts. (G) Heatmap displaying average expression of select transcripts by cluster. (H) scRNA-seq dot plot depicting select transcripts within select mLama4 neoAg-specific CD8 T cell clusters by treatment. Bar graphs in (B), (C), and (D) display the mean ± SEM and are representative of at least three independent experiments (*p < 0.05, **p < 0.01, ***p < 0.005, ****p < 0.0001; NS, not significant, unpaired t test). See also Figures S6A and S6B and Table S1.
Figure 4.
Figure 4.. NeoAg SLP vaccines and ICT induce overlapping and distinct alterations to neoAg-specific CD8 T cells
(A) Heatmaps comparing features (module scores) of mLama4 neoAg-specific CD8 T cell clusters (rows) to published mouse CD8 T cell gene signatures (columns) identified/annotated (e.g., “effector-like”) by Miller et al. and Pauken et al. (B) Heatmaps comparing features (module scores) of mLama4 neoAg-specific CD8 T cell clusters (rows) to published human CD8 T cell gene signatures (columns) identified/annotated (e.g., “CD8_1.Exh/Cell Cycle”) by Sade-Feldman et al. and Oliveira et al. (C) Frequency of mLama4 neoAg-specific CD8 T cells within each cluster by treatment depicted in two ways. (D) Graphs displaying percentage of PD-1+TIM-3+ or PD-1+LAG-3+ or PD-1, TIM-3, or LAG-3 mean fluorescence intensity (MFI) on PD-1+, TIM-3+, or LAG-3+ mLama4-specific CD8 T cells in Y1.7LI tumors. (E) Graph displaying IFN-γ+ or TNF-α+ CD8 T cells and IFN-γ or TNF-α MFI as assessed by ICS of mLama4 peptide-restimulated CD8 T cells isolated from Y1.7LI tumors. For (D) and (E), mice were treated beginning on day 7 post-tumor transplant and harvested on day 15. Bar graphs display the mean ± SEM and are representative of at least three independent experiments (*p < 0.05, **p < 0.01, ***p < 0.005, ****p < 0.0001; NS, not significant, unpaired t test). See also Figure S6C and Table S2.
Figure 5.
Figure 5.. Anti-CTLA-4 induces ICOS+Bhlhe40+ Th1-like CD4 T cells
(A) Heatmap displaying normalized expression of select genes in each CD4 T cell cluster by treatment. (B) Bar graphs depicting frequency of CD4 T cells within each cluster by treatment. (C) Heatmap comparing features (module scores) of CD4 T cell clusters (rows) to published human CD4 T cell gene signatures (columns) of neoAg-specific CD4 T cells identified/annotated by Oliveira et al. and Lowery et al. (D) CD4 T cell frequency in Y1.7LI tumors as determined by flow cytometry. (E) Graph displaying IFN-γ+ CD4 T cells and IFN-γ MFI of IFN-γ+ CD4 T cells as assessed by ICS on mItgb1 peptide-restimulated CD4 T cells isolated from Y1.7LI tumors. (F) UMAP plot displaying exclusively CD4 T cell-containing clusters (left). Monocle 3-guided CD4 T cell trajectory graph overlaid on UMAP (middle) (red arrow indicates inferred pseudotime origin). CD4 T cell clusters overlaid on Monocle3 pseudotime plot (right). For (D) and (E), mice were treated beginning on day 7 post-tumor transplant and harvested on day 15. Bar graphs display the mean ± SEM and are representative of at least three independent experiments (*p < 0.05, **p < 0.01, ***p < 0.005, ****p < 0.0001; NS, not significant, unpaired t test). See also Figure S8 and Table S2.
Figure 6.
Figure 6.. ICT promotes partially distinct macrophage remodeling from neoAg SLP vaccines
(A) UMAP displaying subclustering of select myeloid clusters from CD45+ scRNA-seq and heatmap displaying normalized expression of select genes by monocyte/macrophage cluster. (B) Bar graphs depicting frequency of monocytes/macrophages in each cluster by treatment. (C) Heatmap displaying normalized expression of Mrc1 (CD206), Cx3cr1, and Nos2 (iNOS) in each monocyte/macrophage cluster by treatment. (D) scRNA-seq dot plot depicting Trem2 and Cx3cr1 expression in combined monocyte/macrophage clusters. (E and F) Representative flow cytometry plots and graphs displaying intratumoral (E) CX3CR1+CD206+ macrophages or (F) iNOS+ macrophages from Y1.7 melanoma-bearing mice treated beginning on day 7 post-tumor transplant and harvested on day 15. For (E) and (F), dot plots displaying CX3CR1+CD206+ and iNOS+ macrophages are gated on macrophages, and bar graphs display the mean ± SEM and are representative of at least three independent experiments (*p < 0.05, **p < 0.01, ****p < 0.0001; NS, not significant, unpaired t test). See also Figures S10 and S12.
Figure 7.
Figure 7.. Blockade of TREM2 remodels the macrophage compartment and facilitates anti-tumor immunity in combination with neoAg SLP vaccines
(A) Trem2 mRNA detection by quantitative reverse-transcriptase PCR (qRT-PCR) on sorted intratumoral CX3CR1+CD206+ macrophages and non-CX3CR1+CD206+ macrophages isolated on day 19 post-tumor transplant from Y1.7LI tumor-bearing mice treated with neoAg SLP vax on days 12 and 18. (B) Schematic depicting the experiment in (C). (C) Tumor growth in mice transplanted with Y1.7LI melanoma cells and receiving intratumoral injections of CX3CR1+CD206+ macrophages or PBS and treated with control vax, neoAg SLP vax, anti-TREM2, neoAg SLP vax + isotype control mAb (Iso), or neoAg SLP vax + anti-TREM2 as indicated in (B). (D) Tumor growth in Y1.7 melanoma-bearing mice treated with Iso, anti-TREM2, Iso + control vax, Iso + neoAg SLP vax, anti-TREM2 + control vax, or anti-TREM2 + neoAg SLP vax. (E) Schematic depicting experiments in (F)–(H). (F) Graphs displaying frequency of intratumoral CX3CR1+CD206+ macrophages and iNOS+ macrophages. (G) Graph displaying frequency of mLama4 tetramer-positive CD8 T cells. (H) Graph displaying IFN-g+ CD8 T cells as assessed by ICS of mLama4 peptide-restimulated CD8 T cells isolated from Y1.7LI tumors. For (A), RNA was isolated from macrophages from two individual mice (two independent experiments). For (C) and (D), fractions indicate number of mice rejecting tumors/number of mice used in the experiment. Scatterplots in (F)–(H) display data for individual mice and are representative of two independent experiments (*p < 0.05, **p < 0.01, ***p < 0.001, ****p < 0.0001; NS, not significant, unpaired t test).

Update of

Similar articles

Cited by

References

    1. Heemskerk B, Kvistborg P, and Schumacher TNM (2013). The cancer antigenome. The EMBO journal 32, 194–203. 10.1038/emboj.2012.333. - DOI - PMC - PubMed
    1. Coulie PG, Van den Eynde BJ, van der Bruggen P, and Boon T (2014). Tumour antigens recognized by T lymphocytes: at the core of cancer immunotherapy. Nat. Rev. Cancer 14, 135–146. 10.1038/nrc3670. - DOI - PubMed
    1. Gubin MM, Artyomov MN, Mardis ER, and Schreiber RD (2015). Tumor neoantigens: building a framework for personalized cancer immunotherapy. J. Clin. Invest. 125, 3413–3421. 10.1172/JCI80008. - DOI - PMC - PubMed
    1. Schumacher TN, and Schreiber RD (2015). Neoantigens in cancer immunotherapy. Science 348, 69–74. 10.1126/science.aaa4971. - DOI - PubMed
    1. Carreno BM, Magrini V, Becker-Hapak M, Kaabinejadian S, Hundal J, Petti AA, Ly A, Lie WR, Hildebrand WH, Mardis ER, and Linette GP (2015). A dendritic cell vaccine increases the breadth and diversity of melanoma neoantigen-specific T cells. Science 348, 803–808. 10.1126/science.aaa3828. - DOI - PMC - PubMed

Publication types

MeSH terms

Associated data

LinkOut - more resources