. 2024 Oct 24;22(10):e3002850.
doi: 10.1371/journal.pbio.3002850. eCollection 2024 Oct.

Individualistic reward-seeking strategies that predict response to nicotine emerge among isogenic male mice living in a micro-society

Affiliations

Individualistic reward-seeking strategies that predict response to nicotine emerge among isogenic male mice living in a micro-society

Sophie L Fayad et al. PLoS Biol. .

Abstract

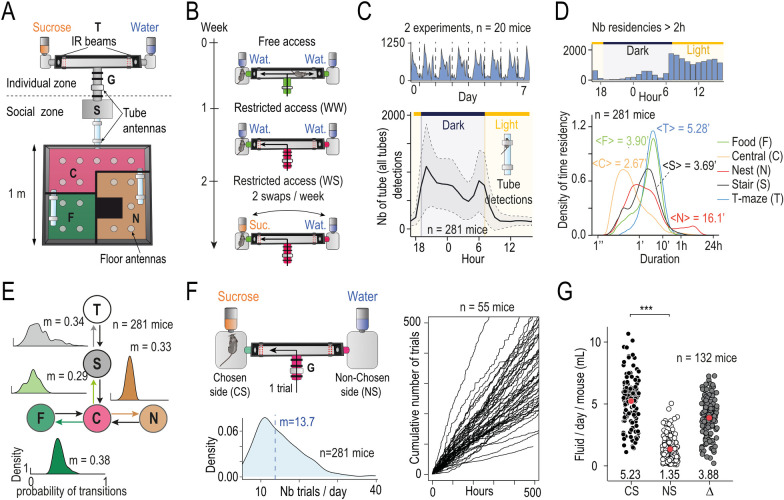
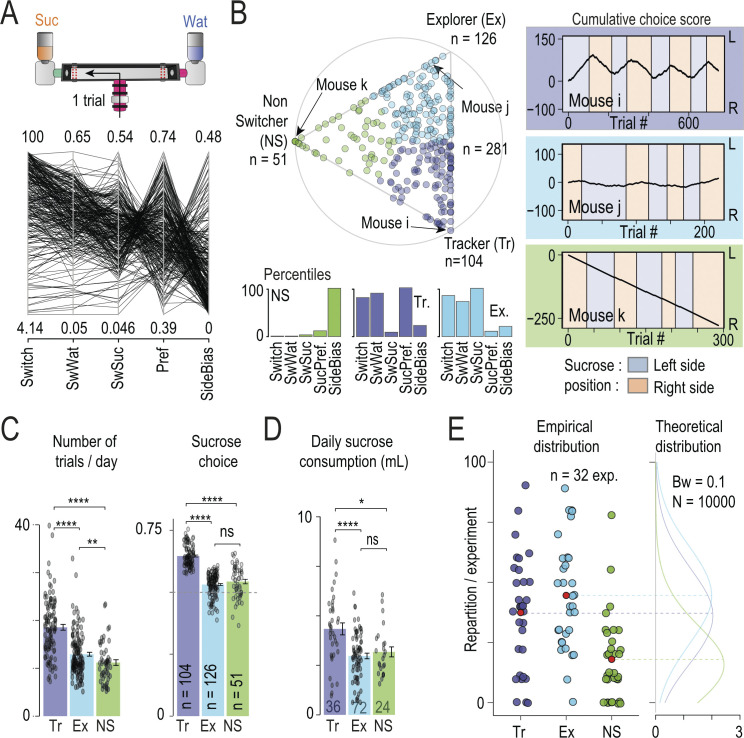
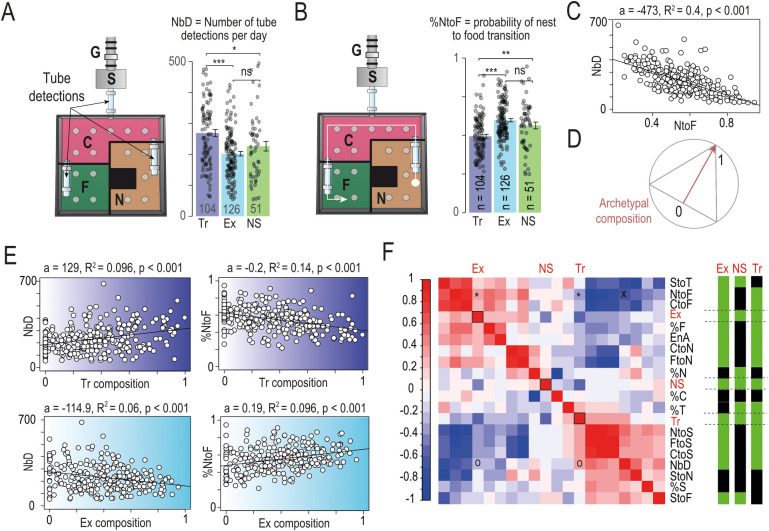
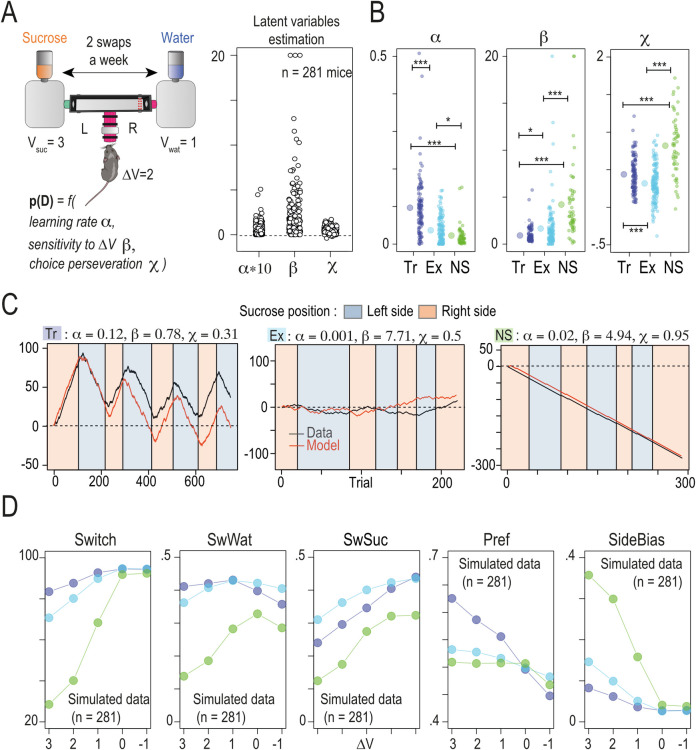
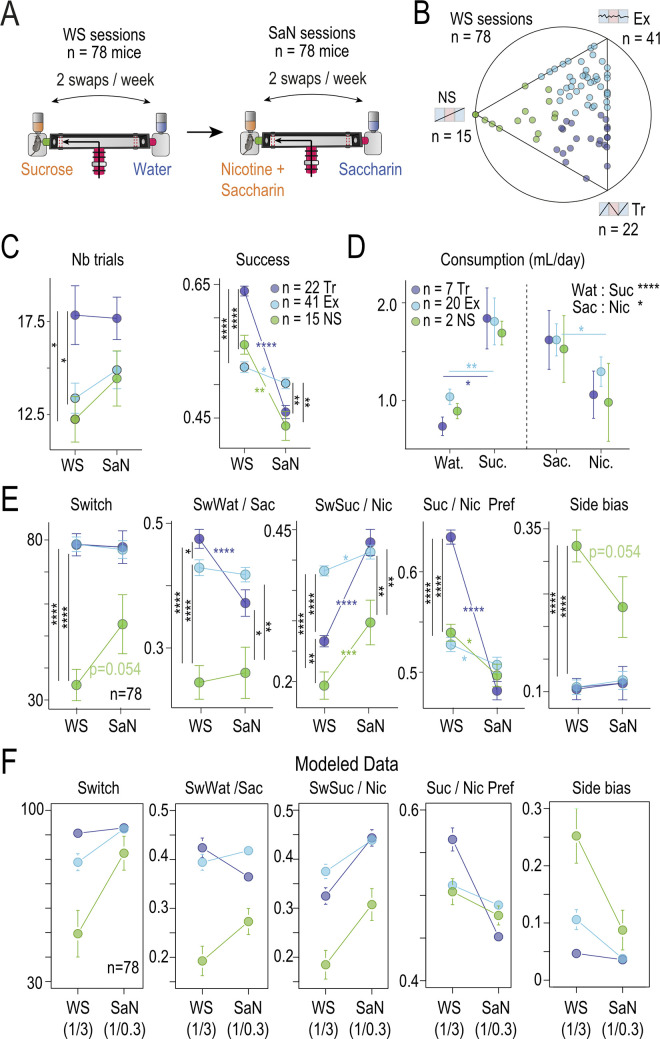
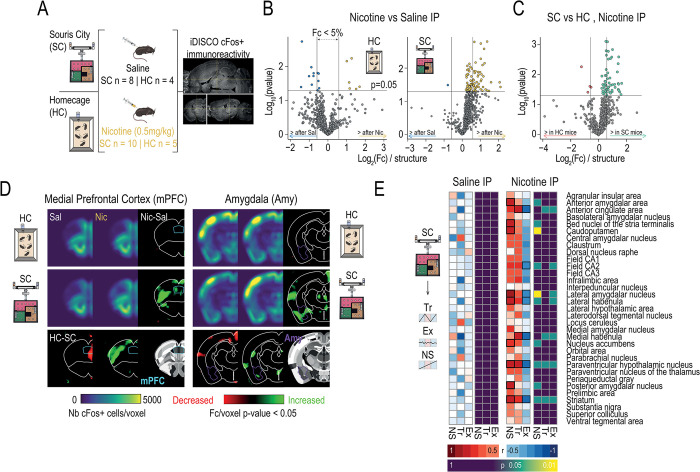
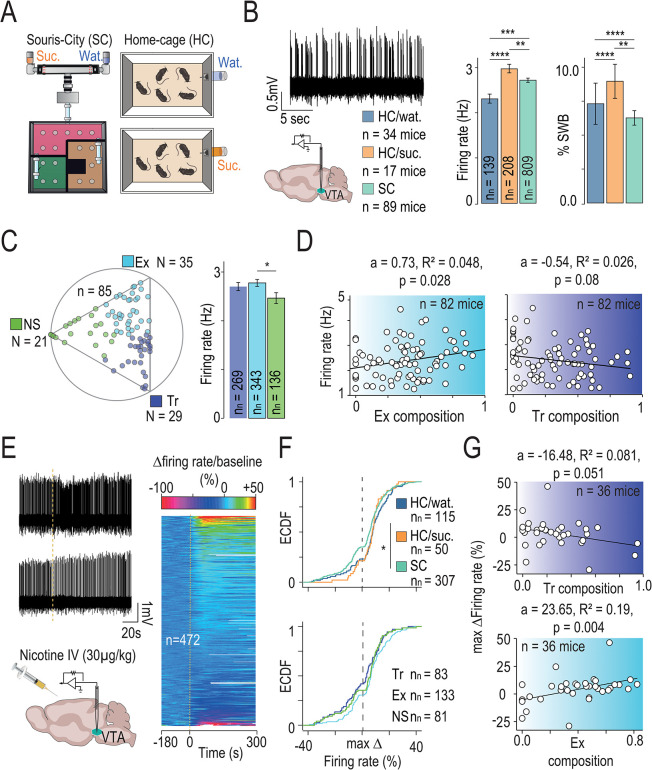
Individual animals differ in their traits and preferences, which shape their social interactions, survival, and susceptibility to disease, including addiction. Nicotine use is highly heterogenous and has been linked to the expression of personality traits. Although these relationships are well documented, we have limited understanding of the neurophysiological mechanisms that give rise to distinct behavioral profiles and their connection to nicotine susceptibility. To address this question, we conducted a study using a semi-natural and social environment called "Souris-City" to observe the long-term behavior of individual male mice. Souris-City provided both a communal living area and a separate test area where mice engaged in a reward-seeking task isolated from their peers. Mice developed individualistic reward-seeking strategies when choosing between water and sucrose in the test compartment, which, in turn, predicted how they adapted to the introduction of nicotine as a reinforcer. Moreover, the profiles mice developed while isolated in the test area correlated with their behavior within the social environment, linking decision-making strategies to the expression of behavioral traits. Neurophysiological markers of adaptability within the dopamine system were apparent upon nicotine challenge and were associated with specific profiles. Our findings suggest that environmental adaptations influence behavioral traits and sensitivity to nicotine by acting on dopaminergic reactivity in the face of nicotine exposure, potentially contributing to addiction susceptibility. These results further emphasize the importance of understanding interindividual variability in behavior to gain insight into the mechanisms of decision-making and addiction.


Conflict of interest statement

The authors have declared that no competing interests exist.

Figures

Fig 1
Fig 1. Longitudinal profiling of individual and group behavior among mouse micro-societies within Souris-City.
(A) Souris-City is divided into 2 main parts: a social zone and a test zone. The social zone includes a square cage measuring 1 m × 1 m, which is further divided into 4 compartments: the nest (N), the food (F) area, where mice have unrestricted access to food, and the central (C) zone that serves as a hub, connecting the social compartments with a stair (S) leading to the test zone. The test zone is a T-maze, which is separated from the stair by a controlled access gate (G). Mice are tagged with RFID chips and detected using floor-mounted circular or tube-shaped RFID antennae, which connect compartments of SC to capture transitions between zones. Two infrared beams (red dashed lines) are used to detect which arm mice choose in the T-maze. (B) The experimental paradigm involves several consecutive sessions with modified rules regarding access to the maze and the nature of the liquids available at each arm. During the free access period (top), mice are allowed unrestricted access to the T-maze for 1 week. The gate remains open, allowing multiple mice to enter the T-maze simultaneously, and water is delivered from both sides. In a second step (middle), mice choose between water on both sides of the T-maze (WW, mean duration = 9.5 days); however, access to the T-maze is restricted by the gate, and mice may only enter the T-maze one at a time. Choice is restricted so that if the animal chooses one side, access to the opposite arm is closed. Finally, water and 5% sucrose solution (bottom, WS, mean duration = 25.2 days) are respectively delivered at each side of the gate-restricted T-maze, introducing a choice (choosing left or right, choosing water or sucrose). The positions of the water and sucrose bottles are then swapped twice a week. (C) Overall activity of mice captured from their movement in Souris-City reflects their circadian rhythm. (Top) Tube detection events for 8 consecutive days (n = 20 mice, 2 group of 10 in parallel). (Bottom) Daily tube detection events per hours averaged for all mice (mean ± SEM, n = 281). (D) Residency time in each sub-compartment can be captured by floor antennae. (Top) Histogram (bin per hour) of the number of residencies in the nest zone longer than 2 h. (Bottom) Density of residency time in each sub-compartment (log-scale, bandwidth = 0.1), with indicated mean value. (E) Tube antennae provide information about the movement of mice between sub-compartments. Flow diagram of all possible transitions between sub-compartment, density graph above each transition indicates the distribution of conditional transition probability among the n = 281 mice, with indicated median value. (F) (Left) Distribution of mean number of T-maze entries per day for n = 281 mice in the SW session. Vertical dashed line indicates mean value. (Right) Cumulative number of T-maze entries per hours after the beginning of the SW session for n = 55 mice (6 experiments). (G) Estimation of daily consumption on a subpart of the experiment (n = 132 mice, see text) during SW session: Mean daily fluid change per animal distinguishing the chosen side (CS) from the non-selected side (NS) and the difference between the two (Δ) (pairwise comparisons using Wilcoxon rank sum test with continuity correction and Holm p-value adjustment correction, n = 132 mice). Data can be found here https://zenodo.org/api/records/13374058/draft/files/Fig 1G.csv/content. Data are represented as mean ± SEM. ns p > 0.05, ** p < 0.01, *** p < 0.001.
Fig 2
Fig 2. Mice exhibit interindividual differences in choice strategies in the T-maze.
(A) Top: one trial is considered to be one choice between left or right side in the T-maze. Bottom: Value of the 5 parameters that describe mice sequence of choice in the T-maze during SW sessions (n = 281 mice): the level of global switching (Switch), the probability of switching sides if the previous choice was water (SwWat) or sucrose (SwSuc), the preference (Pref) and side bias (SideBias) on each session. Top and bottom value correspond to the min (bottom) and max (top) value for each parameter. (B) Archetypal analysis of the choice strategies based on the 5-dimensional data space. Top: Visualization of the α coefficients using a ternary plot. Each point represents the projection of an individual (n = 281 mice) onto the plane defined by a triangle where the 3 apices represent the 3 archetypes: Tracker (Tr, purple), Explorer (Ex, blue), and non-Switcher (NS, green). Points are color-coded according to their proximity to the archetypes. Bottom: Histograms showing the 3 archetypes’ percentiles for each choice parameter. Right: Examples of 3 sequences of choice made by 3 mice close to the archetype. Sucrose position alternates across sessions between the left (light purple) and the right (light orange) side. Cumulated choices across trials are calculated with a positive (+1) or negative (−1) increment when the left or right side is chosen, respectively. The mouse i, j, k (from top to bottom corresponds respectively to a Tr, Exp and NS profile (see their projection in the ternary plot)). (C) Number of trials per days (left) and percentage of sucrose side choice (right) for the 3 archetypes (pairwise Wilcoxon tests with Holm correction). (D) Daily sucrose consumption for the 3 archetypes (pairwise Wilcoxon tests with Holm correction). (E) Repartition of archetypes per experiment showed that they are not evenly represented in each group (N = 32, red dot indicated mean values, left) and built theoretical densities expected for each archetype based on a random draw from mean groups sizes (Bandwidth = 0.1, n = 10,000, right). Data can be found here https://zenodo.org/uploads/13374058.
Fig 3
Fig 3. Archetypes defined by individual choices capture variation in the social cage behavior.
(A) Activity in the main environment, estimated by the number of transitions between compartment (NbD), for the 3 archetypes (pairwise Wilcoxon tests with Holm correction, 3 points above 500 were not plotted). (B) Probability of nest to food transition (NtoF) for the 3 archetypes (pairwise Wilcoxon tests with Holm correction). Data can be found here https://zenodo.org/api/records/13374058/draft/files/Fig 3A-B.csv/content. (C) Correlation between NtoF and NbD. (D) Principle of archetypal composition measurement: the archetypal composition (i.e., given by αk with k the archetype) would be equal to 1 if the mouse is exactly at the point of the archetype, and 0 if it is on the opposite side. (E) Correlation (linear regression, a indicating the slope estimate, R2 the Adjusted R-squared and p the p-value) between Tracker (Tr) composition and pNtoF (left) and NbD (right), respectively (top), and between Explorer (Ex) composition and pNtoF (left) and NbD (right), respectively (bottom). (F) Left: Correlation matrix (Pearson correlation coefficient) of main environment variables and archetypal profile. Right: p-value for correlations. Green: p < 0.05, Black: p > 0.05. Variables: Activity Levels: Number of Detections (NbD), Entropy (EnA); Probability of Transitions: Stair to T-maze (StoT), Nest to Food (NtoF), Center to Food (CtoF), Center to Nest (CtoN), Food to Nest (FtoN), Nest to Stair (NtoS), Food to Stair (FtoS), Center to Stair (CtoS), Stair to Nest (StoN), Stair to Food (StoF); Occupancy: percent time in Food compartment (%F), percent time in Nest compartment (%N), percent time in Center compartment (%C), percent time in T-Maze compartment (%T), percent time in Stair compartment (%S); Archetypes: Explorer (Ex), Non-Switcher (NS), Tracker (Tr). * and ° indicates correlation between Tr and Ex composition with pNtoF and NbD shown in (E). X indicates correlation shown in C.
Fig 4
Fig 4. Computational modeling suggests that decision and learning parameters differ between the 3 archetypes.
(A) Left: Principle of the reinforcement learning and SoftMax model, with 3 Latent variables α (the learning rate), β (inverse temperature or sensitivity to the difference of values ΔV), and χ (the choice perseveration). The theoretical value of water and sucrose are set to 3 and 1, respectively. Right: Estimated values of α, β, and χ for n = 281 mice. (B) Latent variables according to the Tr, Ex, and NS archetype (left symbol: mean ± SEM, Wilcoxon tests with Holm correction, right: individual value per mice). Data can be found here https://zenodo.org/api/records/13374058/draft/files/Fig4A-B.csv/content. (C) The model recapitulates the profiles drawn from experimental data (same example as in Fig 2B) when fitted with individual triplets values for the latent variables of each individual of a specific archetype. (D) Comparison of the mean of 5 variables (Switch, SwWat, SwSuc, Pref, SideBias) for Tr, Ex, and NS archetype obtained for 5 differences in the value (ΔV, one side as a value of 1) associated with the choice (6 sessions of 50 choices, simulated with fitted values of α, β, and χ, n = 281).
Fig 5
Fig 5. Predicting nicotine intake by sucrose-seeking strategy.
(A) Experimental design. (B) Position in the ternary plot of the 78 mice used in this analysis. These mice have been exposed to water-sucrose (WS) session and then to saccharine-nicotine (SaN) sessions. Ternary plot is obtained at the end of the WS sessions. (C) Mean number of T-maze entries per day (Nb trials) and mean Success for the 3 archetypes in WS and SaN periods (Wilcoxon tests with Holm correction, n indicated mice). Data can be found here https://zenodo.org/api/records/13374058/draft/files/Fig 5B-C-E.csv/content. (D) Mean consumption per animal and per archetype for water (Wat) or sucrose (Suc) and Saccharin (Sac) or Nicotine (Nic) sessions. Data can be found here https://zenodo.org/api/records/13374058/draft/files/Fig 5D.csv/content. (E) Variation in Switch, SwWat, SwSuc, Pref, SideBias (from left to right) per archetypes and for WS and SaN periods. (F) Mean of the 5 variables (Switch, SwWat, SwSuc, Pref, SideBias) for Tr, Ex, and NS archetype simulated for 2 couples of values associated with the choice; (1,3) for WS session and (1,0.3) for SaN session. Simulation is based on 12 sessions of 50 choices, with a change in value after 6 sessions. Each mouse is simulated with fitted values of β, χ, and α (n = 78 mice).
Fig 6
Fig 6. Differential response to nicotine as a function of the environment and decision-making strategy.
(A) Brain-wide cFos expression mapping after saline or nicotine injection in mice living in standard home cages (HC) or Souris-City (SC) revealed by iDISCO brain clearing and Clearmap. (B) Mice in HC conditions do not show significant differences in cellular activity between saline and nicotine injections, while mice in SC show a shift toward increased cFos expression (greater fold change of the number of cFos+ cells per region) following a nicotine injection when compared to a saline one. (C) Comparison between nicotine-induced cFos expression in SC and HC mice reveals that SC mice show greater numbers of cFos-positive cells per region in response to nicotine than mice raised under standard conditions. (D) Grouped heatmaps show average density of cFos-positive cells in the PFC (left) and the amygdala (right). P-value maps highlight areas where significant between-groups differences can be appreciated. (E) Correlations between cFos expression and distance to the archetype in saline and nicotine-injected SC animals. Left: minimal differences in cFos expression are observed between mouse profiles in SC in response to a saline injection. Right: patterns of expression across brain regions associated with cognitive and reward functions that become apparent after challenging the different mouse profiles with nicotine.
Fig 7
Fig 7. Dopamine neuron firing is modulated by both the environment and mouse profile.
(A) Spontaneous activity of VTA dopaminergic (DA) neurons recorded in mice living in standard home cage (HC) with access either to water (Wat) or to a 5% sucrose drinking solution (Suc) or in Souris-City (SC). (B) Mean firing rate and percentage of spike within burst (%SWB) are different in the 3 groups (Kruskal–Wallis (df = 2, p = 0.017) and post hoc Wilcoxon tests with Holm correction, *p < 0.05, n indicated number of mice, nn indicated number of neurons). Data can be found here https://zenodo.org/api/records/13374058/draft/files/Fig 7B.csv/content. (C) Left: Position in the ternary plot of the n = 85 mice used in this analysis. Right: Firing rate in Hz according to the archetype (Wilcoxon tests with Holm correction, n = 748 neurons). (D) Correlation (linear regression, a indicated the slope estimate, R2 the Adjusted R-squared and p the p-value) between Explorer (Ex, left) or Tracker (Tr, right) composition and median firing rate per mice (n = 82 mice, with a minimum of 3 cells per mice). (E) Left: Intravenous (i.v.) injections of nicotine (Nic; 30 μg/kg) induce activation (upper panel) or inhibition (lower panel) of distinct VTA DA neurons in anesthetized mice (representative recordings). Right: Responses of VTA DA neurons after nicotine injection. Responses are rank-ordered based on the response to nicotine, from the most excited to the most inhibited (top to bottom of the graph). Color scale indicates variation in firing rate amplitude. (F) Empirical cumulative distribution of the response to nicotine (variation in firing rate). (Top) Neurons recorded in mice living in Souris-city, in home cage (HC) with water (HC/Wat) or with sucrose drinking solution (HC/Suc) (Kruskal–Wallis (df = 2, p = 0.011) and post hoc Wilcoxon tests with Holm correction, *p < 0.05). (Bottom) Neurons recorded in SC mice according to their Tr, Ex, and NS respective profiles (Kruskal–Wallis (df = 2, p = 0.059)). (G) Correlation between Tracker (Tr, top) or Explorer (Ex, bottom) composition and median response in firing rate per mice (n = 36 mice, with a minimum of 5 cells per mice).

References

    1. Sih A, Bell AM, Johnson JC, Ziemba RE. Behavioral Syndromes: An Integrative Overview. Q Rev Biol. 2004;79:241–277. doi: 10.1086/422893 - DOI - PubMed
    1. Bergmüller R, Taborsky M. Animal personality due to social niche specialisation. Trends Ecol Evol. 2010;25:504–511. doi: 10.1016/j.tree.2010.06.012 - DOI - PubMed
    1. Kempermann G. Environmental enrichment, new neurons and the neurobiology of individuality. Nat Rev Neurosci. 2019;78:1–11. doi: 10.1038/s41583-019-0120-x - DOI - PubMed
    1. Pennisi E. The power of personality. Science. 2016;352:644–647. doi: 10.1126/science.352.6286.644 - DOI - PubMed
    1. Torquet N, Marti F, Campart C, Tolu S, Nguyen C, Oberto V, et al.. Social interactions impact on the dopaminergic system and drive individuality. Nat Commun. 2018;9:3081. doi: 10.1038/s41467-018-05526-5 - DOI - PMC - PubMed

LinkOut - more resources