. 2024 Nov 8;386(6722):eado6836.
doi: 10.1126/science.ado6836. Epub 2024 Nov 8.

Retrotransposons are co-opted to activate hematopoietic stem cells and erythropoiesis

Affiliations

Retrotransposons are co-opted to activate hematopoietic stem cells and erythropoiesis

Julia Phan et al. Science. .

Abstract

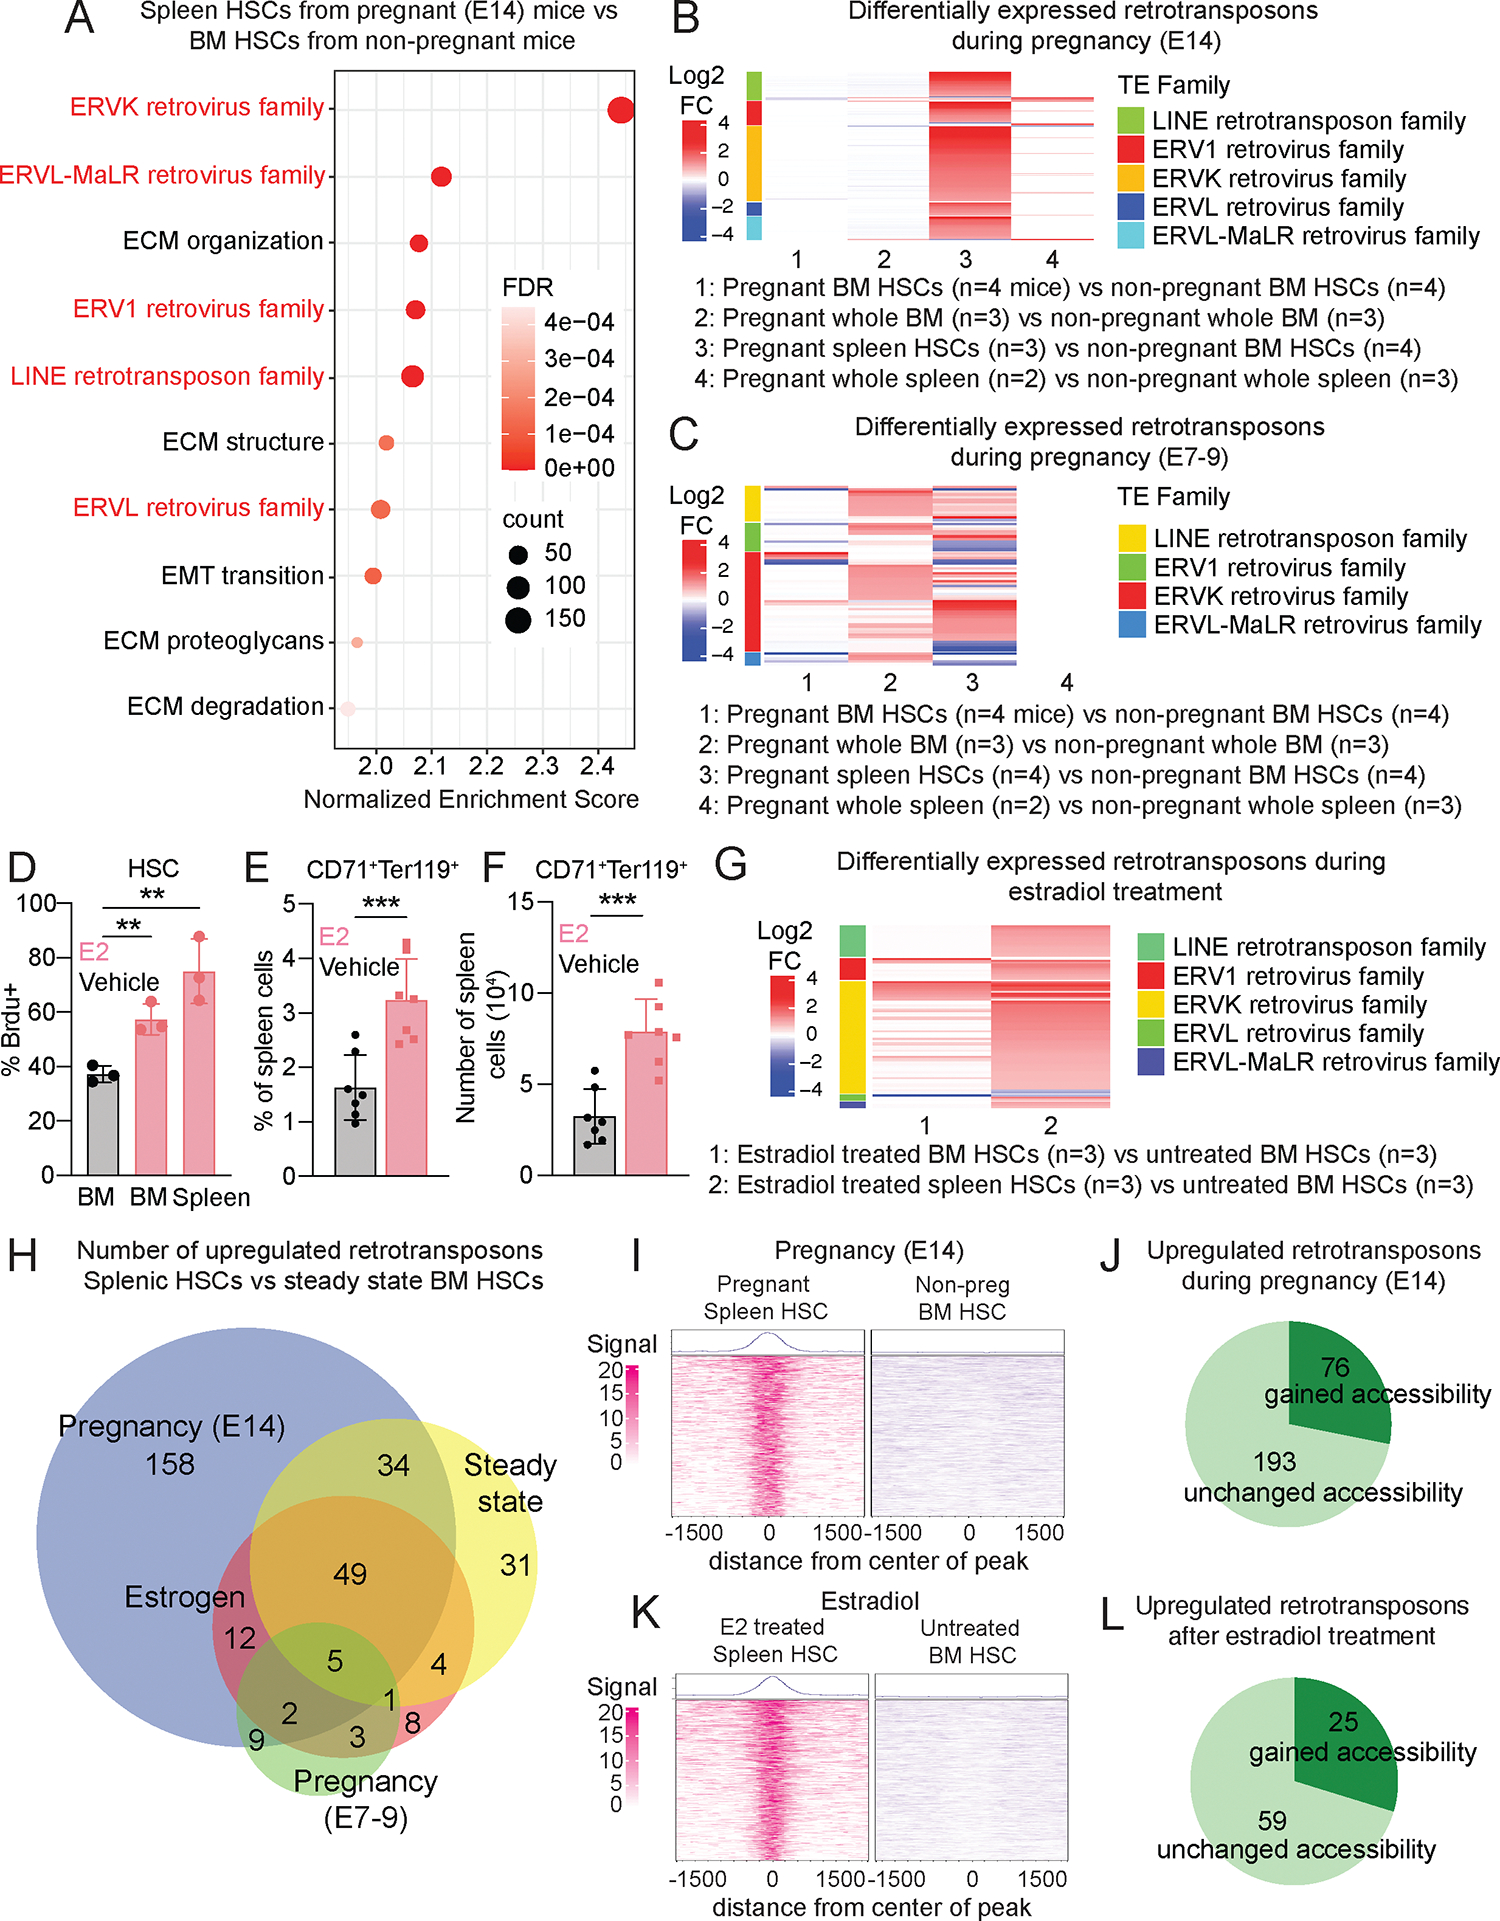
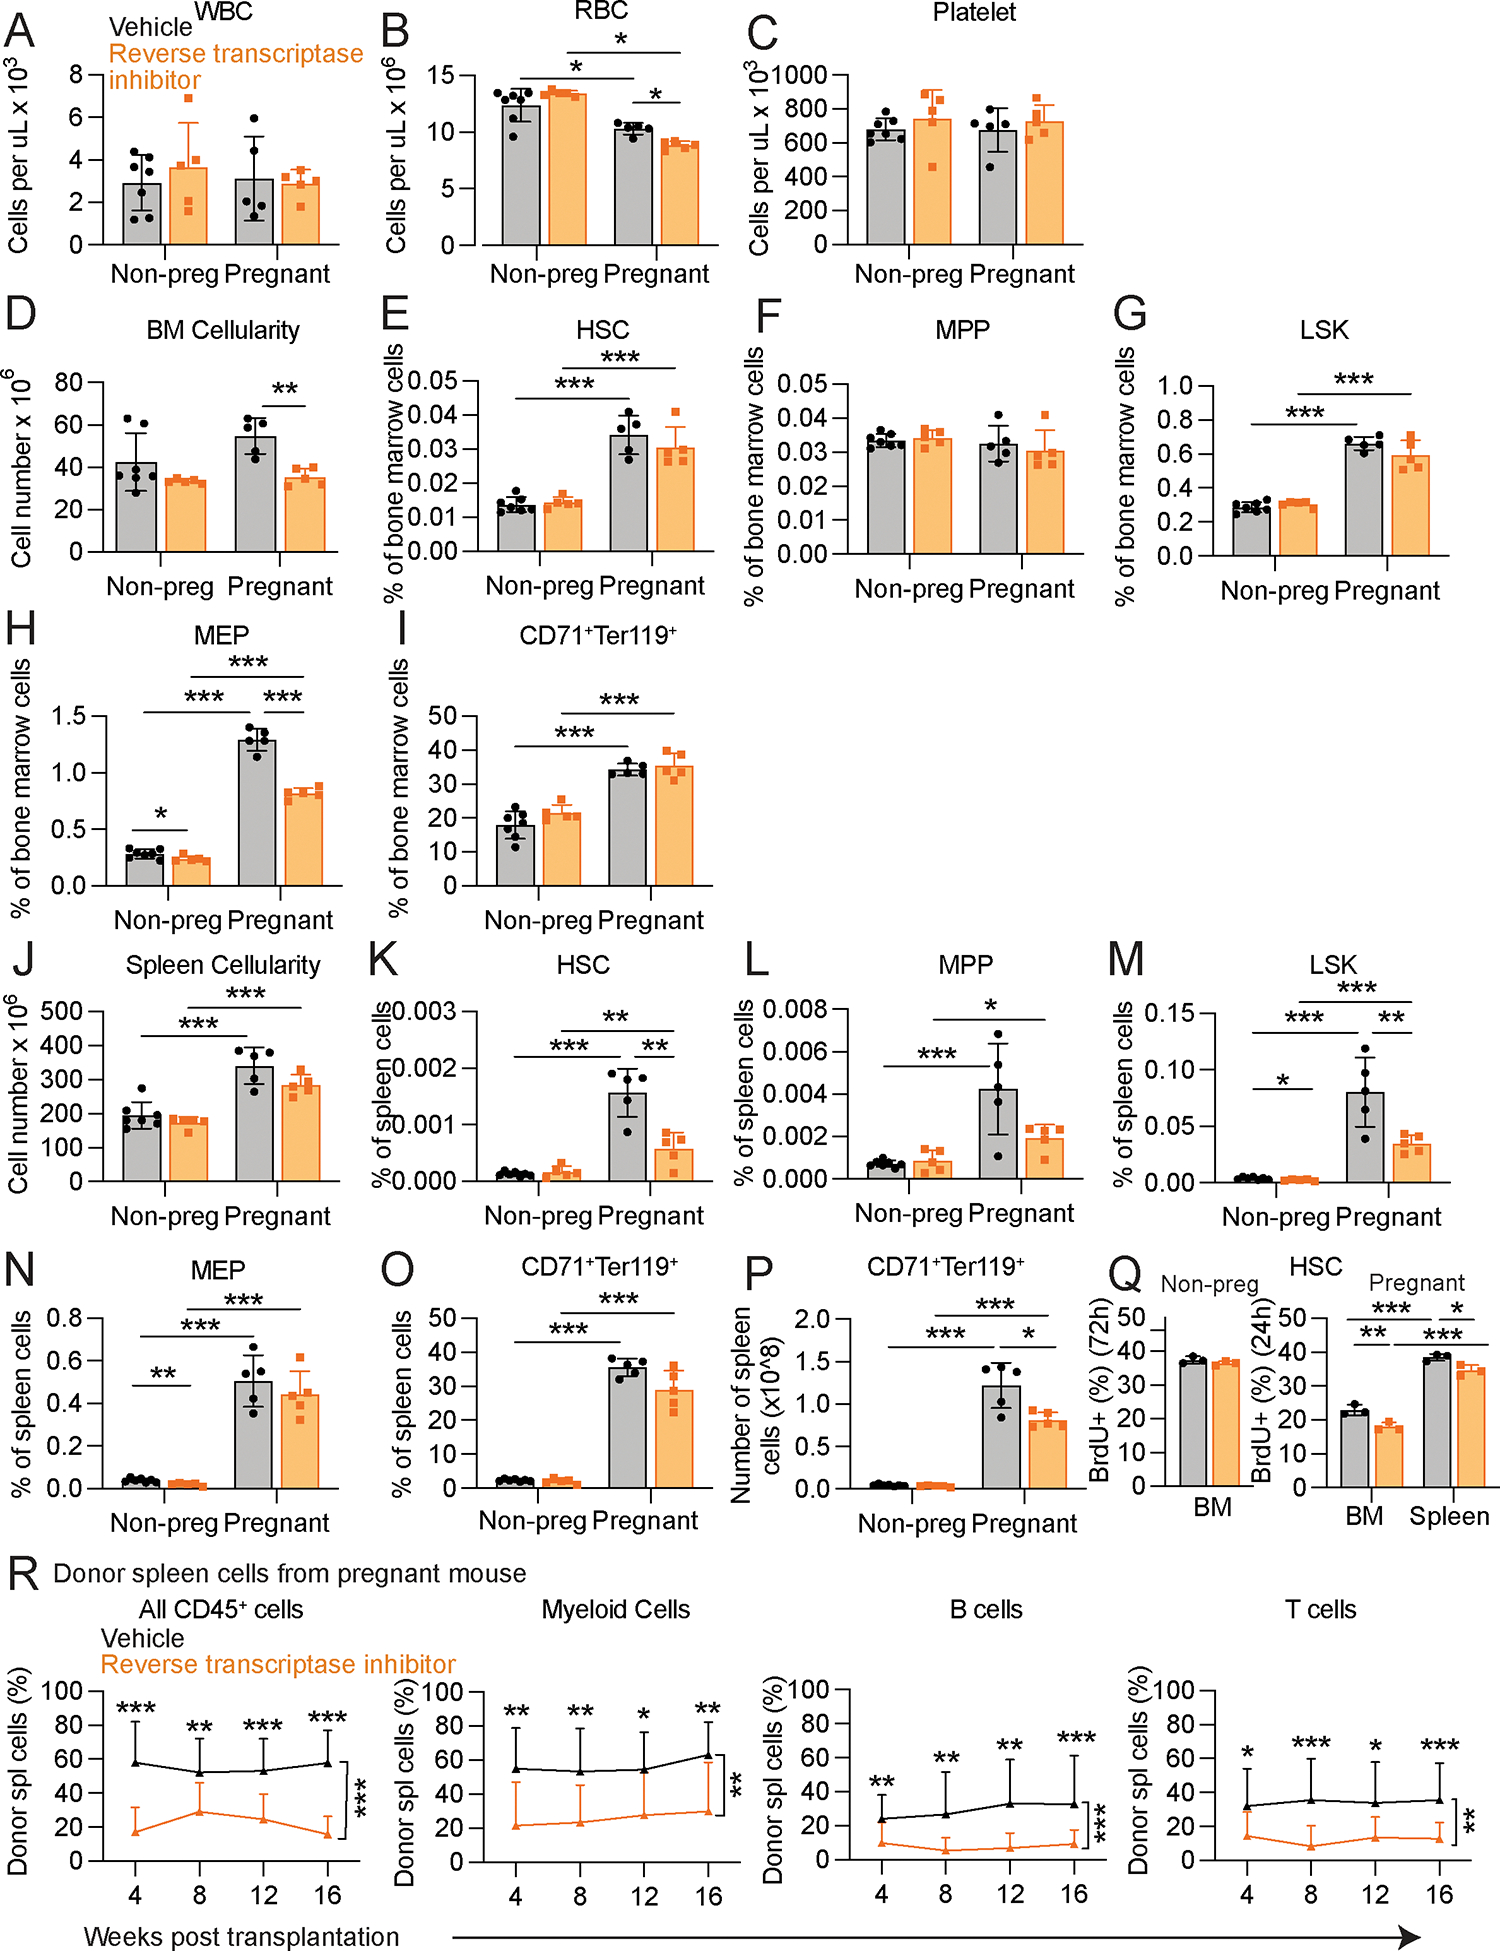
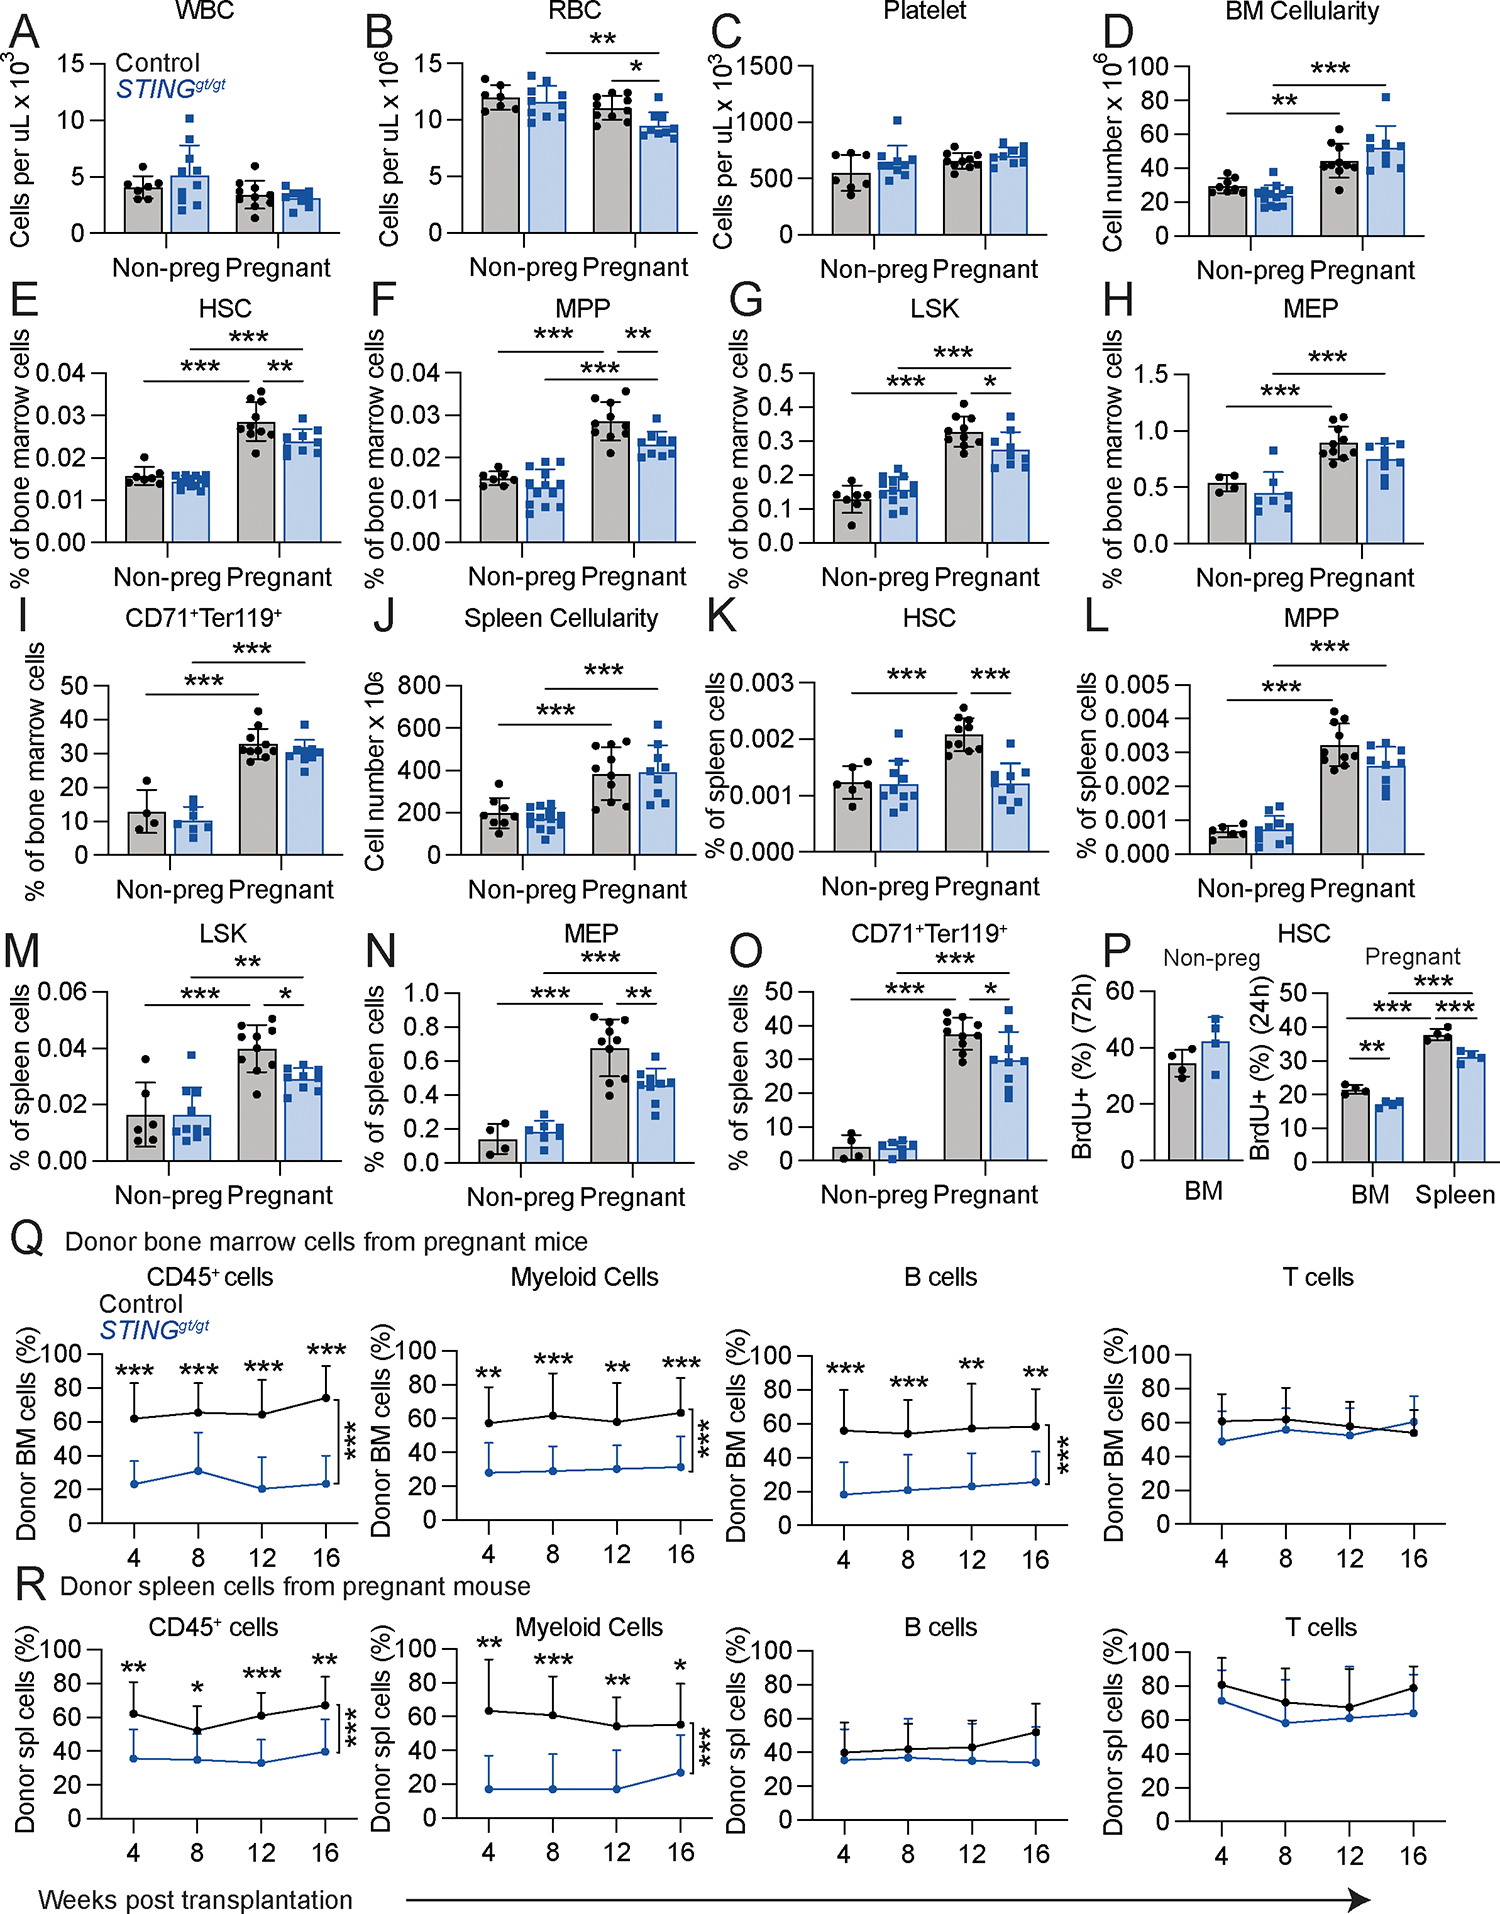
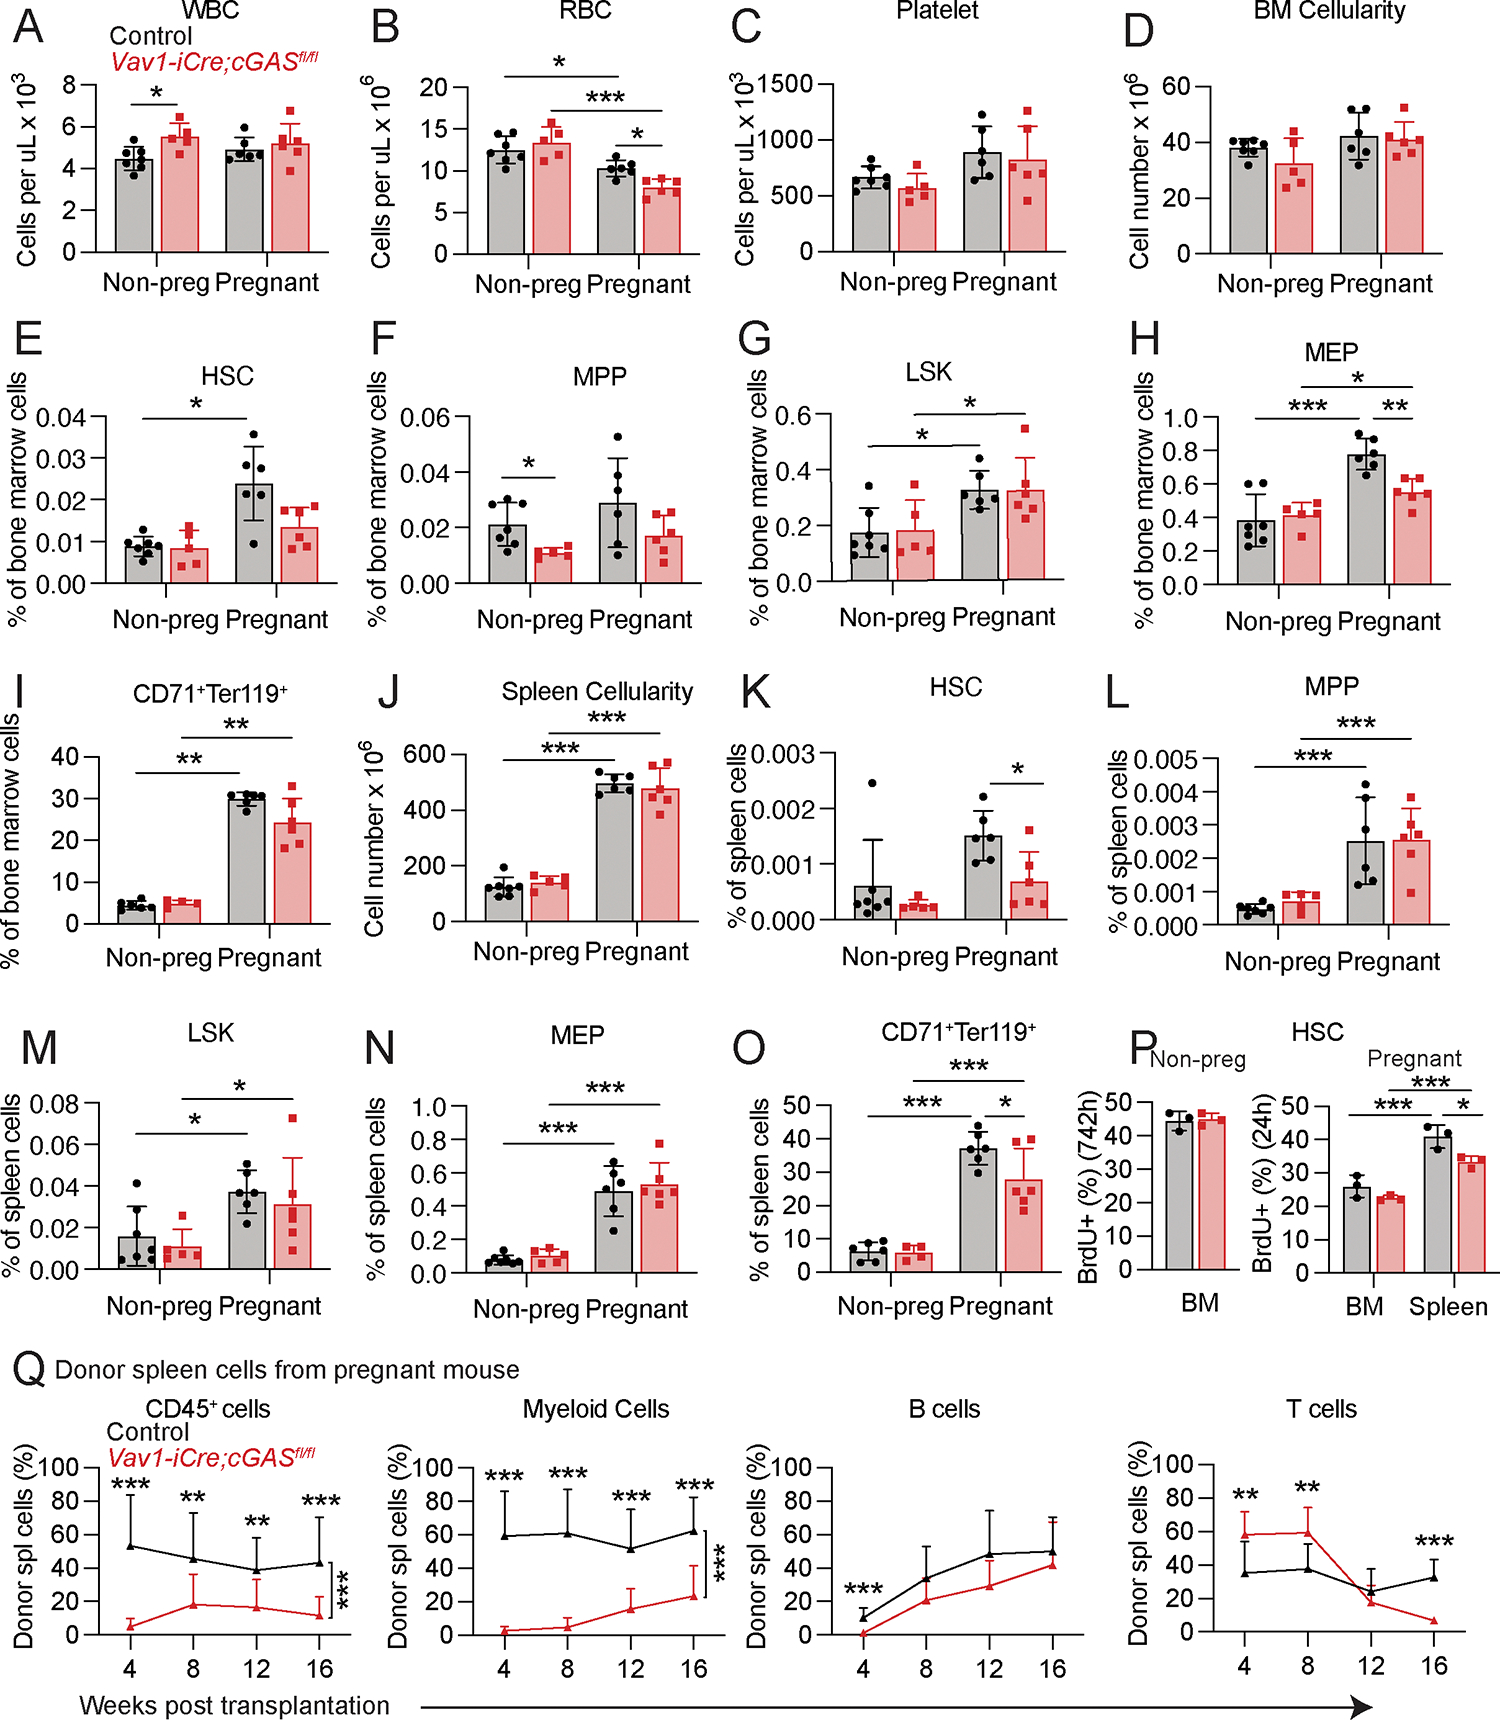
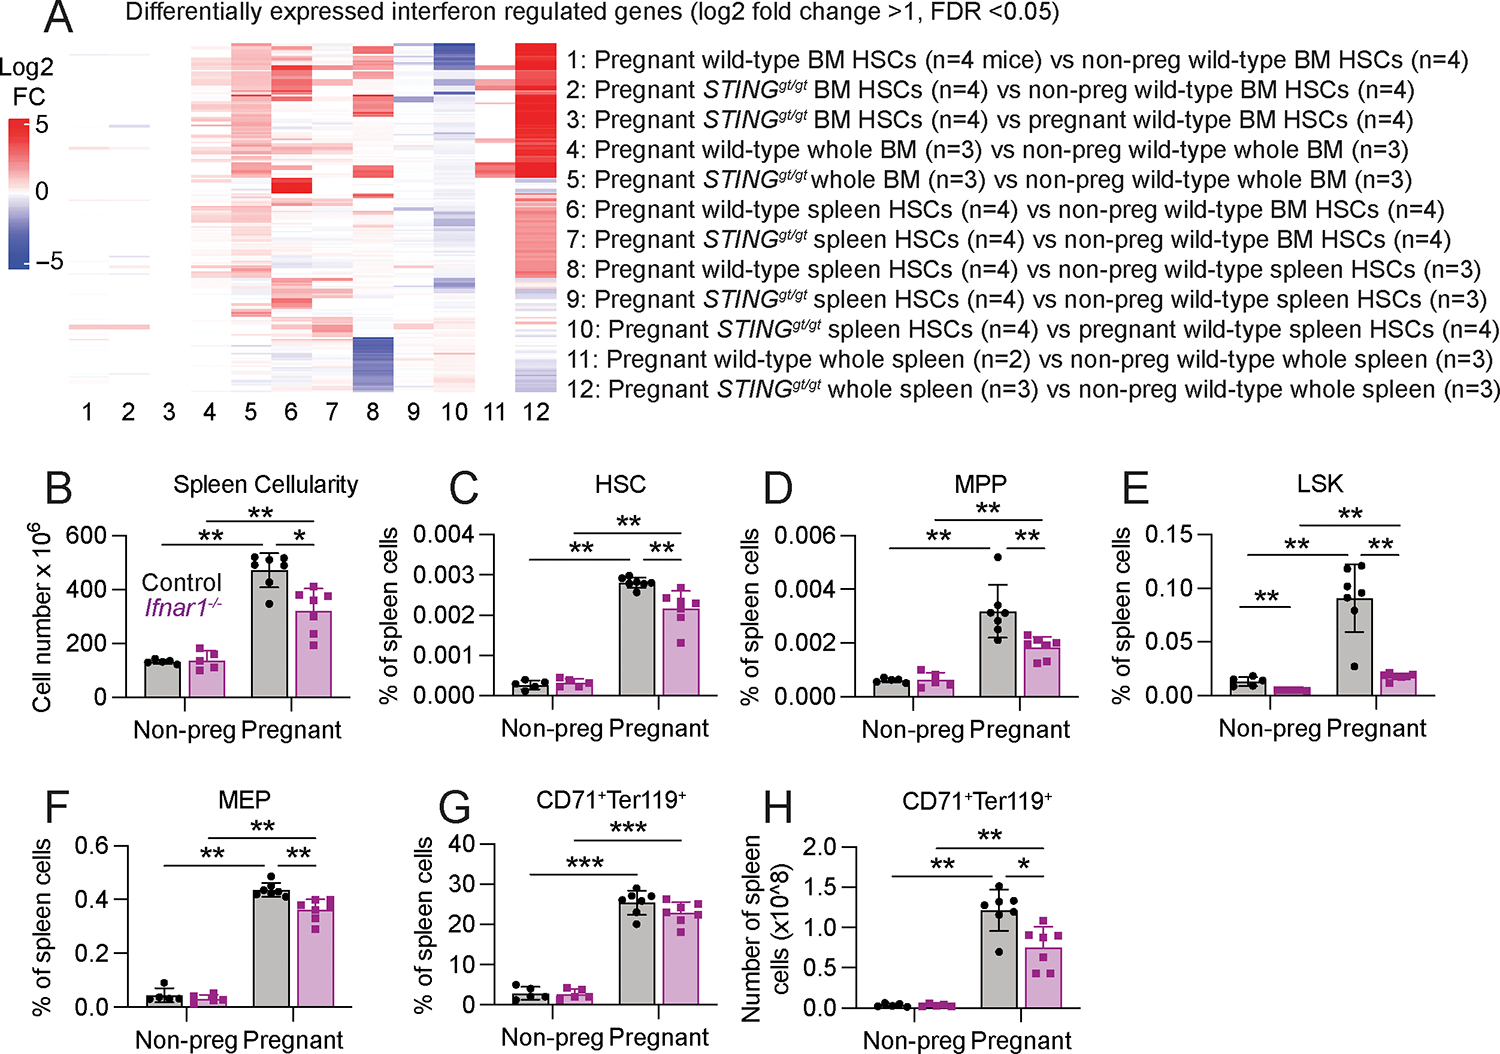
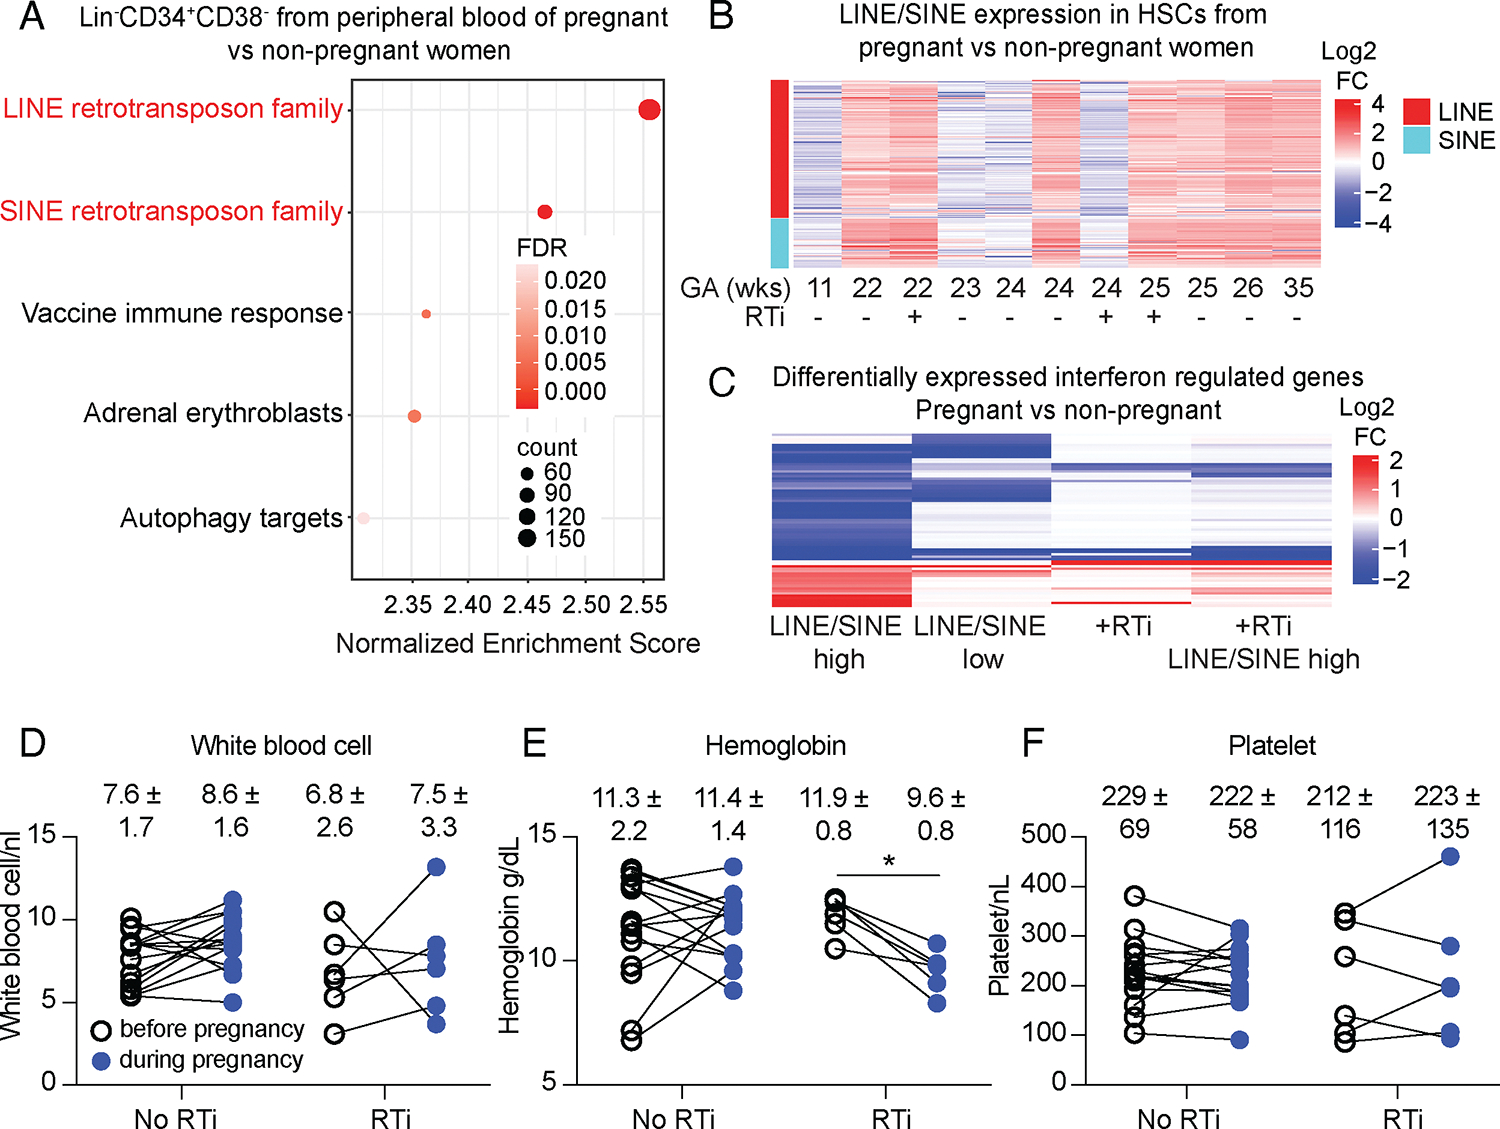
Hematopoietic stem cells (HSCs) and erythropoiesis are activated during pregnancy and after bleeding by the derepression of retrotransposons, including endogenous retroviruses and long interspersed nuclear elements. Retrotransposon transcription activates the innate immune sensors cyclic guanosine 3',5'-monophosphate-adenosine 5'-monophosphate synthase (cGAS) and stimulator of interferon (IFN) genes (STING), which induce IFN and IFN-regulated genes in HSCs, increasing HSC division and erythropoiesis. Inhibition of reverse transcriptase or deficiency for cGAS or STING had little or no effect on hematopoiesis in nonpregnant mice but depleted HSCs and erythroid progenitors in pregnant mice, reducing red blood cell counts. Retrotransposons and IFN-regulated genes were also induced in mouse HSCs after serial bleeding and, in human HSCs, during pregnancy. Reverse transcriptase inhibitor use was associated with anemia in pregnant but not in nonpregnant people, suggesting conservation of these mechanisms from mice to humans.


Conflict of interest statement

Competing Interests: All authors declare that they have no competing interests.

Figures

Fig. 1.
Fig. 1.. Retrotransposon transcription increases in HSCs during pregnancy.
(A, B) We performed RNA sequencing in bone marrow HSCs and unfractionated bone marrow and spleen cells from pregnant and non-pregnant female mice as well as spleen HSCs from pregnant mice (spleen HSCs are very rare in non-pregnant mice). (A) Five out of the 7 most highly enriched gene sets in spleen HSCs from pregnant dams (E14) as compared to bone marrow HSCs from non-pregnant mice were endogenous retrotransposon sequences from multiple families (NES > 2 and FDR <0.01). (B) The list of retrotransposons that differed (log2 fold change > 1, FDR < 0.05) among the cell populations in the analysis showed that retrotransposons were broadly de-repressed in splenic HSCs from pregnant mice. (C) We performed a similar analysis in pregnant dams at an earlier stage of pregnancy (E7–9) and again found a broad de-repression (log2 fold change > 1, FDR< 0.05) of multiple families of retrotransposons in splenic HSCs from pregnant dams. Some of these retrotransposons were also more highly expressed in bone marrow HSCs from pregnant as compared to non-pregnant mice. (D) The percentage of HSCs that incorporated a 72 hour pulse of BrdU in estradiol-treated or vehicle control mice (3 mice per treatment). (E, F) The frequencies (E) and numbers (F) of CD71+Ter119+ erythroid progenitors in the spleens of estradiol-treated or control mice (a total of 7 mice per treatment from three independent experiments). The flow cytometry gates are shown in Figs. S1 and S2. In panels D-F, each dot represents a different mouse and data represent mean ± standard deviation (*p < 0.05; **p < 0.01; ***p < 0.001). (G) Retrotransposons that changed (log2 fold change > 1, FDR< 0.05) in expression in bone marrow or spleen HSCs from estradiol-treated as compared to untreated control mice. (H) Venn diagram showing the overlap of retrotransposons that were increased in expression (log2 fold change > 1, FDR <0.05) in splenic HSCs from pregnant (E14) mice, normal non-pregnant mice (steady state), early (E7–9) pregnant mice, and estradiol-treated mice all compared to bone marrow HSCs from normal, non-pregnant mice. (I-J) ATAC-sequencing of spleen HSCs from pregnant mice as compared to bone marrow HSCs from non-pregnant mice showing differentially accessible regions (I) and the number of upregulated retrotransposons in spleen HSCs from pregnant mice that overlapped with genomic regions that gained accessibility (J). (K-L) ATAC-sequencing of spleen HSCs from estradiol-treated mice as compared to bone marrow HSCs from untreated mice showing differentially accessible regions (K) and the number of upregulated retrotransposons in spleen HSCs from estradiol-treated mice that overlapped with genomic regions that gained accessibility (L). The numbers of mice from which cells were isolated for RNA sequencing is shown in panels B, C, and G. To isolate spleen HSCs from normal non-pregnant mice, spleens were pooled from 7–12 mice per replicate for a total of 3 replicates (H). The statistical significance of differences among treatments was assessed using Student’s t-tests with Holm-Sidak’s multiple comparisons adjustments (D) and Student’s t-tests (E, F). All statistical tests were two-sided.
Fig. 2:
Fig. 2:. Reverse transcriptase inhibitors had no effect on hematopoiesis in non-pregnant mice but decreased splenic HSCs and erythropoiesis in pregnant mice, leading to anemia.
Pregnant and non-pregnant female mice were treated with reverse transcriptase inhibitors versus vehicle control (panels A – P reflect n=5 to 7 mice per treatment in 2 independent experiments; each dot represents a different mouse): (A-C) blood cell counts, (D-I) bone marrow cellularity in one tibia and one femur (D) and the frequencies of HSCs (E), MPPs (F), LSK cells (G), MEPs (H), and CD71+Ter119+ erythroid progenitors (I) in the bone marrow. (J-O) Spleen cellularity (J) and the frequencies of HSCs (K), MPPs (L), LSK cells (M), MEPs (N), and CD71+Ter119+ erythroid progenitors (O) in the spleen. (P) Number of CD71+Ter119+ erythroid progenitors in the spleen. (Q) The percentage of HSCs that incorporated a 72 hour (non-pregnant) or 24 hour (pregnant) pulse of BrdU in reverse transcriptase inhibitor or vehicle-treated mice (3 mice per treatment). (R) Donor cell reconstitution of CD45+ hematopoietic cells, Mac-1+Gr-1+ myeloid cells, B220+ B cells, and CD3+ T cells in the blood of mice that were competitively transplanted with 1.5 × 10⁶ donor spleen cells from pregnant dams that were treated with reverse transcriptase inhibitors or vehicle control (3 donor mice and a total of 13–14 recipients per treatment in 3 independent experiments). The flow cytometry gates are shown in Figs. S1 and S2. All data represent mean ± standard deviation (*p < 0.05; **p < 0.01; ***p < 0.001). Statistical significance was assessed using two-way ANOVAs followed by Sidak’s multiple comparisons adjustments (A, C, E-O), Mann-Whitney tests followed by Holm-Sidak’s multiple comparisons adjustment (B), Welch’s t-tests followed by Holm-Sidak’s multiple comparisons adjustments (D, P), a Student’s t-test (Q: non-pregnant) and a matched samples two-way ANOVA followed by Sidak’s multiple comparisons adjustment (Q: pregnant), or nparLD tests followed by Holm-Sidak’s multiple comparisons adjustments for overall differences taking into account all time points and Mann-Whitney tests for data at individual time points (R). All statistical tests were two-sided.
Fig. 3:
Fig. 3:. STING is necessary to increase HSC frequency and erythropoiesis during pregnancy.
We assessed hematopoiesis in pregnant or non-pregnant female STINGgt/gt or littermate control mice (all panels reflect 4 to 13 mice per treatment in 4 independent experiments; each dot represents a different mouse): (A-C) blood cell counts, (D-I) bone marrow cellularity in one tibia and one femur (D) and the frequencies of HSCs (E), MPPs (F), LSK cells (G), MEPs (H), and CD71+Ter119+ erythroid progenitors (I) in the bone marrow. (J-O) Spleen cellularity (J) and the frequencies of HSCs (K), MPPs (L), LSK cells (M), MEPs (N), and CD71+Ter119+ erythroid progenitors (O) in the spleen. (P) The percentage of HSCs that incorporated a 72 hour (non-pregnant) or 24 hour (pregnant) pulse of BrdU in STINGgt/gt and littermate control mice (4 mice per treatment in 2 independent experiments). (Q) Donor cell reconstitution of CD45+ hematopoietic cells, Mac-1+Gr-1+ myeloid cells, B220+ B cells, and CD3+ T cells in the blood of mice that were competitively transplanted with 5 × 10⁵ donor bone marrow cells from pregnant STINGgt/gt or littermate control dams (3 donor mice were transplanted into a total of 13–14 recipients per genotype in 3 independent experiments). (R) Donor cell reconstitution in the blood of mice that were competitively transplanted with 1.5 × 10⁶ donor spleen cells from pregnant STINGgt/gt or littermate control dams (3 donor mice were transplanted into a total of 11–12 recipients per genotype in 3 independent experiments). The flow cytometry gates are shown in Figs. S1 and S2. All data represent mean ± standard deviation (*p < 0.05; **p < 0.01; ***p < 0.001).. Statistical significance was assessed two-way ANOVAs followed by Sidak’s multiple comparisons adjustments (A-B, D-K, M), Welch’s t-tests followed by Holm-Sidak’s multiple comparisons adjustments (C, L, O), multiple Student’s t-tests followed by Holm-Sidak’s multiple comparisons adjustments (N), a Student’s t-test (P: non-pregnant) and a matched samples two-way ANOVA followed by Sidak’s multiple comparisons adjustment (P: pregnant), or nparLD tests followed by Holm-Sidak’s multiple comparisons adjustments for overall differences taking into account all time points and Mann-Whitney tests for data at individual time points (Q, R). All statistical tests were two-sided.
Fig. 4:
Fig. 4:. cGAS is necessary to increase HSC frequency and erythropoiesis during pregnancy.
We assessed hematopoiesis in pregnant or non-pregnant female Vav1-iCre;cGASfl/fl or littermate control mice (all panels reflect 4 to 7 mice per treatment in 3 independent experiments; each dot represents a different mouse): (A-C) blood cell counts, (D-I) bone marrow cellularity in one tibia and one femur (D) and the frequencies of HSCs (E), MPPs (F), LSK cells (G), MEPs (H), and CD71+Ter119+ erythroid progenitors (I) in the bone marrow. (J-O) Spleen cellularity (J) and the frequencies of HSCs (K), MPPs (L), LSK cells (M), MEPs (N), and CD71+Ter119+ erythroid progenitors (O) in the spleen. (P) The percentage of HSCs that incorporated a 72 hour (non-pregnant) or 24 hour (pregnant) pulse of BrdU in Vav1-iCre;cGASfl/fl or littermate control mice (3 mice per treatment). (Q) Donor cell reconstitution of CD45+ hematopoietic cells, Mac-1+Gr-1+ myeloid cells, B220+ B cells, and CD3+ T cells in the blood of mice that were competitively transplanted with 1.5 × 10⁶ donor spleen cells from pregnant Vav1-iCre;cGASfl/fl or littermate control dams (3 donor mice were transplanted into a total of 12–13 recipients per genotype in 3 independent experiments). The flow cytometry gates are shown in Figs. S1 and S2. All data represent mean ± standard deviation (*p < 0.05; **p < 0.01; ***p < 0.001). Statistical significance was assessed using two-way ANOVAs followed by Sidak’s multiple comparisons adjustments (A-D, J, L-O), Mann-Whitney tests followed by Holm-Sidak’s multiple comparisons adjustments (E, I, K), multiple Student’s t-tests followed by Holm-Sidak’s multiple comparisons adjustments (F-H, K), a Student’s t-test (P: non-pregnant) and a matched samples two-way ANOVA followed by Sidak’s multiple comparisons adjustment (P: pregnant), or nparLD tests followed by Holm-Sidak’s multiple comparisons adjustments for overall differences taking into account all time points and Mann-Whitney tests for data at individual time points (Q). All statistical tests were two-sided.
Fig. 5:
Fig. 5:. STING-dependent interferon expression increases during pregnancy and promotes splenic erythopoiesis.
(A) Changes in interferon regulated gene expression among bone marrow and spleen HSCs as well as unfractionated bone marrow and spleen cells from pregnant and non-pregnant female STINGgt/gt and littermate wild-type mice. (B-H) Spleen cellularity (B) and the frequencies of HSCs (C), MPPs (D), LSK cells (E), MEPs (F), and CD71+Ter119+ erythroid progenitors (G) as well as the number of CD71+Ter119+ erythroid progenitors (H) in the spleen of pregnant or non-pregnant female Ifnar1−/− or littermate control mice. Each dot represents a different mouse (5 to 7 mice per treatment in 4 independent experiments). The flow cytometry gates are shown in Fig. S2. All data represent mean ± standard deviation (*p < 0.05; **p < 0.01; ***p < 0.001). Statistical significance was assessed using Mann-Whitney tests followed by Holm-Sidak’s multiple comparisons adjustments (B-F, H), or two-way ANOVAs followed by Sidak’s multiple comparisons adjustments (G),
Fig. 6:
Fig. 6:. Retrotransposon expression is increased in HSCs during pregnancy in humans and was associated with the development of anemia.
(A) Gene set enrichment analysis on RNA sequencing data from LinCD34+CD38 cells isolated from the blood of pregnant and non-pregnant females. (B) Changes in retrotransposon expression in LinCD34+CD38 cells from the blood of pregnant females (n=11; 3 of whom were taking reverse transcriptase inhibitors; GA means gestational age) as compared to average values from LinCD34+CD38 cells obtained from non-pregnant females (n=3). (C) Differential expression of interferon regulated genes in LinCD34+CD38 cells from pregnant as compared to non-pregnant females. HSCs were categorized based on high LINE/SINE expression and no reverse transcriptase inhibitor treatment (column 1), low LINE/SINE expression and no reverse transcriptase inhibitor treatment (column 2), all reverse transcriptase inhibitor treated without regard to LINE/SINE expression (column 3), and reverse transcriptase inhibitor treated and high LINE/SINE expression (column 4). (D-F) Blood cell counts from individuals with and without reverse transcriptase inhibitor treatment, before and during pregnancy, lines connect the same individual. The flow cytometry gates are shown in Fig. S12. All data represent mean ± standard deviation (*p < 0.05; **p < 0.01; ***p < 0.001). Statistical significance was assessed using paired t-tests followed by Holm Sidak’s multiple comparisons adjustments (D - F). All statistical tests were two-sided. RTis: reverse transcriptase inhibitors.

Similar articles

Cited by

References

    1. Nakada D et al., Oestrogen increases haematopoietic stem-cell self-renewal in females and during pregnancy. Nature 505, 555–558 (2014). - PMC - PubMed
    1. Kickler TS, Spivak JL, Effect of repeated whole blood donations on serum immunoreactive erythropoietin levels in autologous donors. JAMA 260, 65–67 (1988). - PubMed
    1. Ebert BL, Bunn HF, Regulation of the erythropoietin gene. Blood 94, 1864–1877 (1999). - PubMed
    1. Cheshier SH, Prohaska SS, Weissman IL, The effect of bleeding on hematopoietic stem cell cycling and self-renewal. Stem Cells Dev 16, 707–717 (2007). - PubMed
    1. Li Y et al., Inflammatory signaling regulates embryonic hematopoietic stem and progenitor cell production. Genes Dev 28, 2597–2612 (2014). - PMC - PubMed

Publication types