. 2024 Oct 24;20(10):e1012341.
doi: 10.1371/journal.ppat.1012341. eCollection 2024 Oct.

Epstein-Barr virus reactivation induces divergent abortive, reprogrammed, and host shutoff states by lytic progression

Affiliations

Epstein-Barr virus reactivation induces divergent abortive, reprogrammed, and host shutoff states by lytic progression

Elliott D SoRelle et al. PLoS Pathog. .

Abstract

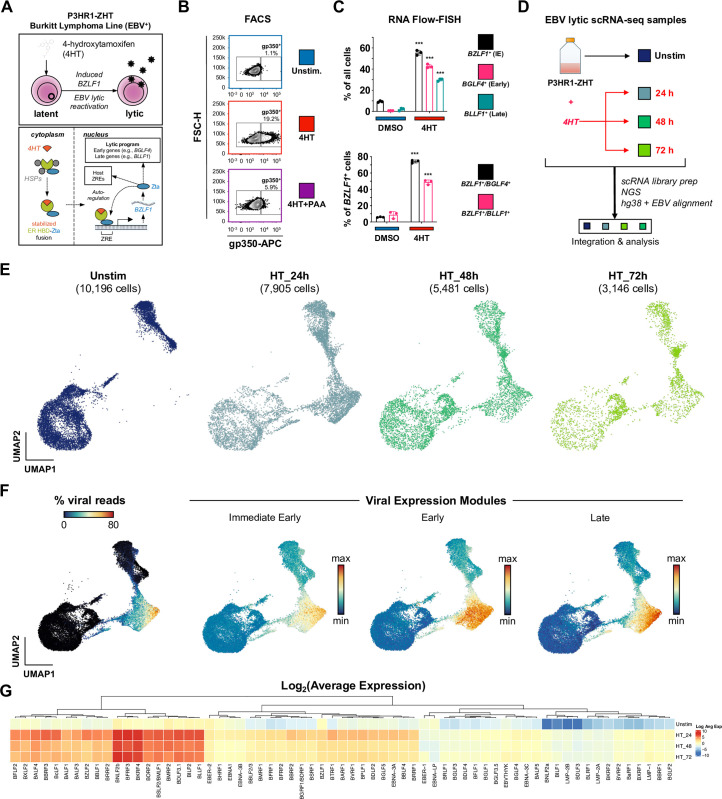
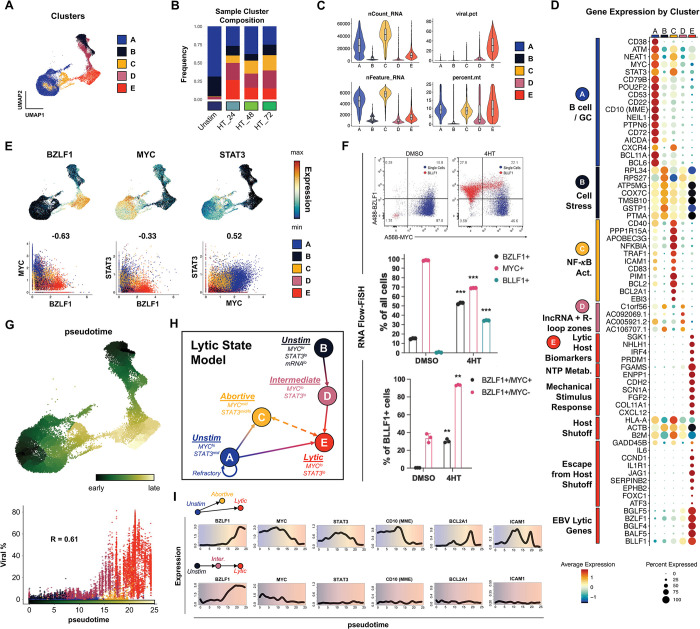
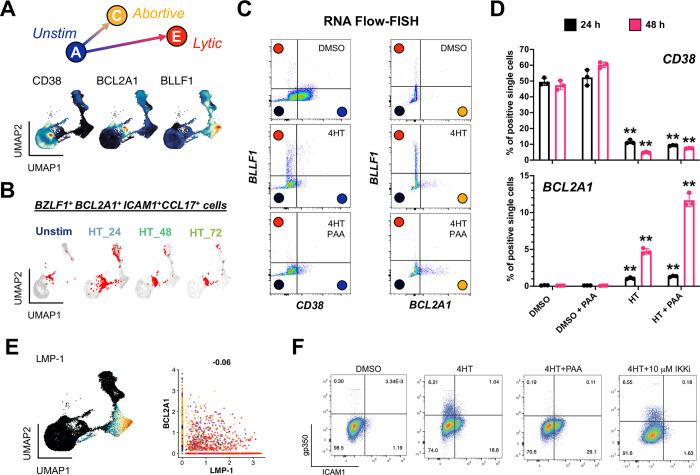
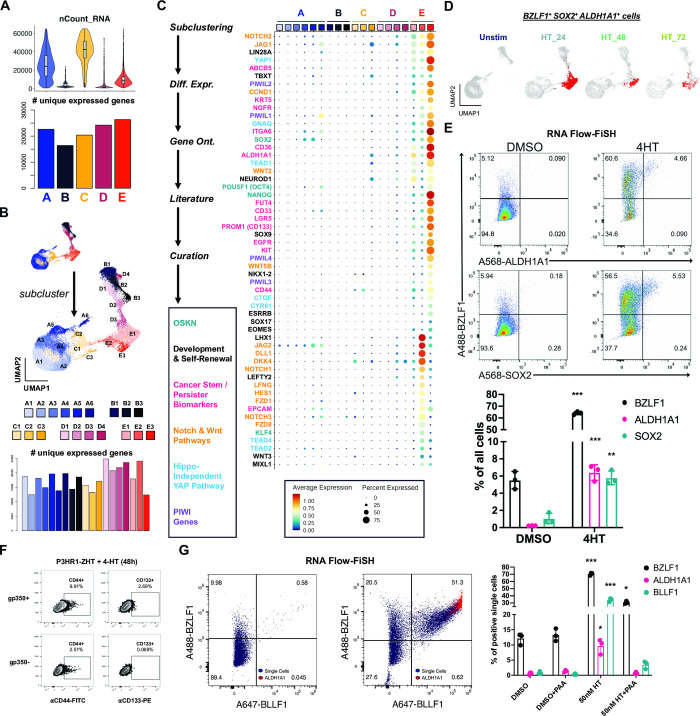
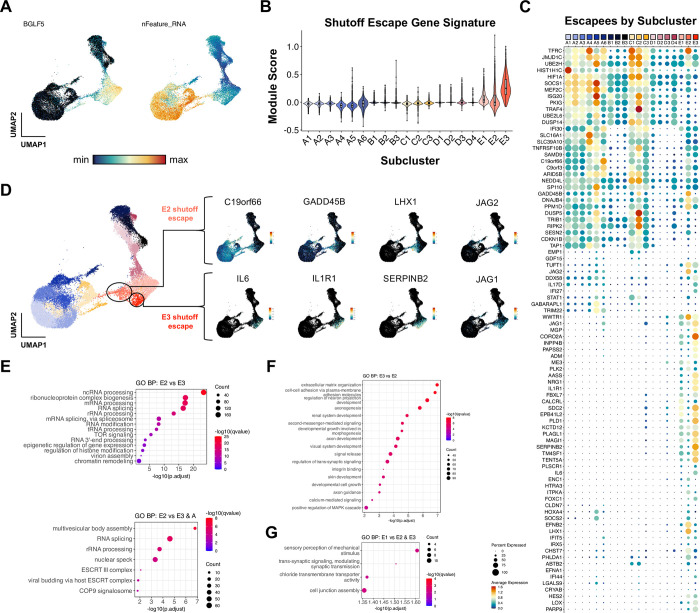
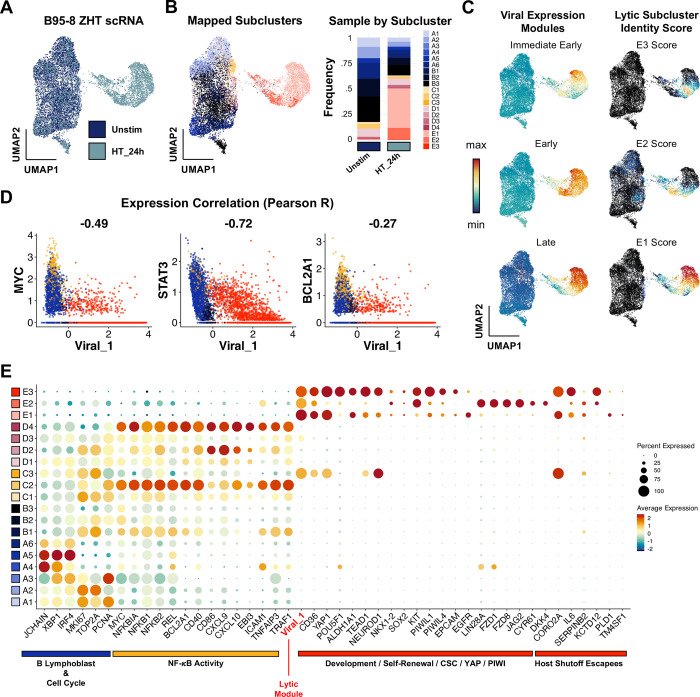
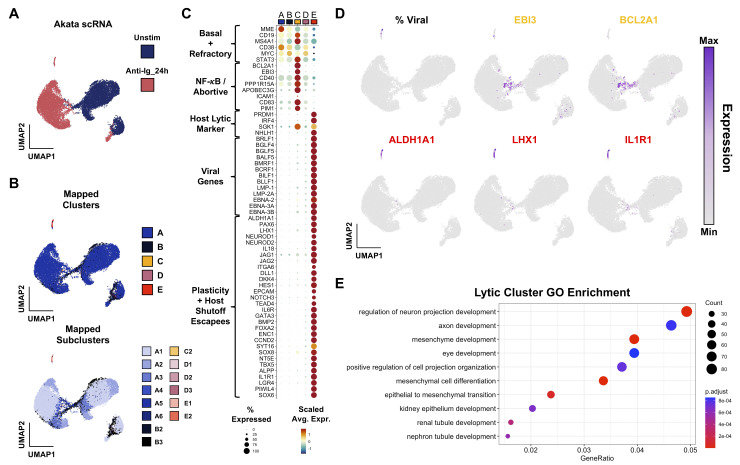
Viral infection leads to heterogeneous cellular outcomes ranging from refractory to abortive and fully productive states. Single cell transcriptomics enables a high resolution view of these distinct post-infection states. Here, we have interrogated the host-pathogen dynamics following reactivation of Epstein-Barr virus (EBV). While benign in most people, EBV is responsible for infectious mononucleosis, up to 2% of human cancers, and is a trigger for the development of multiple sclerosis. Following latency establishment in B cells, EBV reactivates and is shed in saliva to enable infection of new hosts. Beyond its importance for transmission, the lytic cycle is also implicated in EBV-associated oncogenesis. Conversely, induction of lytic reactivation in latent EBV-positive tumors presents a novel therapeutic opportunity. Therefore, defining the dynamics and heterogeneity of EBV lytic reactivation is a high priority to better understand pathogenesis and therapeutic potential. In this study, we applied single-cell techniques to analyze diverse fate trajectories during lytic reactivation in three B cell models. Consistent with prior work, we find that cell cycle and MYC expression correlate with cells refractory to lytic reactivation. We further found that lytic induction yields a continuum from abortive to complete reactivation. Abortive lytic cells upregulate NFκB and IRF3 pathway target genes, while cells that proceed through the full lytic cycle exhibit unexpected expression of genes associated with cellular reprogramming. Distinct subpopulations of lytic cells further displayed variable profiles for transcripts known to escape virus-mediated host shutoff. These data reveal previously unknown and promiscuous outcomes of lytic reactivation with broad implications for viral replication and EBV-associated oncogenesis.


Conflict of interest statement

The authors have declared that no competing interests exist.

Figures

Fig 1
Fig 1. EBV lytic reactivation in the P3HR1-ZHT Burkitt Lymphoma line at single-cell resolution.
(A) Schematic of 4HT-inducible BZLF1 (Zta) expression initiating lytic reactivation in the Burkitt Lymphoma-derived P3HR1-ZHT cell line. (B) Flow cytometry validation 24 h after 4HT-induced lytic reactivation and inhibition of complete reactivation by phosphonoacetic acid (PAA) in P3HR1-ZHT. Cellular expression of the viral glycoprotein gp350 (encoded by the late lytic gene BLLF1) serves as a proxy for successful reactivation. Co-treatment with the viral DNA polymerase inhibitor PAA prevents complete reactivation by blocking viral DNA replication, which is required for expression of late viral genes / gene products including gp350. (C) RNA Flow-FISH validation of select immediate early (IE), early, and late lytic gene expression in P3HR1-ZHT. The majority of cells express detectable BZLF1 24 h after 4HT treatment. Substantial fractions express early genes including the EBV DNA polymerase (BGLF4) and late genes including BLLF1. However, not all BZLF1+ cells exhibit early and late gene expression, indicating variable progression of reactivation in individual cells. Asterisks denote significantly higher expression in 4HT-treated samples versus DMSO controls (n = 3 per condition; two-tailed Welch’s t-test; ***p<0.001). (D) Experimental design schematic for time-resolved scRNA-seq study of EBV reactivation in P3HR1-ZHT. Single-cell libraries were prepared from unstimulated cells and from cells at three timepoints (24 h, 48 h, and 72 h) after 4HT treatment. Libraries were sequenced, mapped to a multispecies reference genome, integrated into a single data object, and analyzed. (E) UMAP representation of single cells captured across the experimental timecourse. Plots display the number of cells in each library after QC filtering. (F) EBV gene expression overview in merged timecourse scRNA-seq data. (From left to right) Viral fraction of captured transcripts per cell; scores for an immediate early (IE) expression module (BZLF1, BRLF1); scores for an early gene expression module (BRRF1, BBLF4, BALF1, LF3, BARF1, BaRF1, BVLF1, and BALF3); scores for a late gene expression module (BZLF2, BLLF1, BILF2, BBRF3, BcLF1, BRRF2, BSRF1, BCRF1, and BBRF1). Modules were curated based on viral expression kinetics determined by CAGE-seq [162]. (G) Hierarchically clustered average expression of all detected viral genes by timepoint.
Fig 2
Fig 2. P3HR1-ZHT phenotypic heterogeneity and response trajectories during lytic induction.
(A) P3HR1-ZHT cell clusters identified in merged timecourse data via unsupervised methods. (B) Cluster composition of cells from individual timepoints. Cluster colors are coded as in 2A. (C) QC feature distributions by cluster. The total number of mapped reads per cell is given by nCount_RNA. The number of unique RNA features (i.e., genes, lncRNAs) per cell is given by nFeature_RNA. The viral fraction of mapped reads per cell (viral.pct) and mitochondrial transcript fractions (percent.mt) were calculated using the PercentageFeatureSet() function in Seurat [154]. (D) Differential gene expression by cluster. Genes are annotated by their known biological roles and functions derived from gene ontology (GO) analysis and primary literature. Dot size represents the percentage of cells in each cluster that express a given gene and color encodes average expression across the cluster. (E) UMAP expression profiles (top row) and pairwise correlation plots (bottom row, Pearson R) for BZLF1, MYC, and STAT3. Correlation plots depict individual cells colored by cluster. (F) RNA Flow-FISH validation of reduced MYC expression in BZLF1+BLLF1+ cells (top panel). Asterisks in the middle panel bar plot denote significantly reduced frequency of MYC+ P3HR1-ZHT cells and increased frequencies of BZLF1+ and BLLF1+ cells after 4HT treatment (n = 3 per condition; two-tailed Welch’s t-test; ***p<0.001). Asterisks in the bottom panel bar plot denote significantly increased frequencies of BZLF1+MYC+ and BZLF1+MYC- cells after 4HT treatment (n = 3 per condition; two-tailed Welch’s t-test; **p<0.01). (G) UMAP of graph-based pseudotime trajectory calculation for timecourse-merged scRNA-seq data. Trajectory root cells were selected from both clusters A and B, which were present in the unstimulated (day 0) P3HR1-ZHT library (top panel). Viral read content in individual cells ordered by pseudotime and coded by cluster (bottom panel). (H) Cluster- and pseudotime-informed annotated cell state model of EBV lytic reactivation in P3HR1-ZHT. Solid line arrows denote cell response trajectories supported by time-resolved scRNA-seq data. The dashed line denotes a putative state interconversion. (I) Gene expression dynamics along distinct pseudotime trajectories in the lytic reactivation timecourse. Highlighted genes were selected from those differentially expressed across unstimulated, abortive, and fully lytic cells.
Fig 3
Fig 3. Validation of an abortive response with elevated NF-κB activity distinct from full lytic reactivation.
(A) Identification of CD38, BCL2A1, and BLLF1 as respective biomarkers for unstimulated, abortive, and lytic P3HR1-ZHT cells. (B) Co-detection of BZLF1 and NF-κB pathway transcriptional targets in abortive cells (co-positive cells in red) by timepoint. (C) RNA Flow-FISH validation of full (BLLF1+) and abortive (BCL2A1+) reactivation as orthogonal responses at 48 h post 4HT treatment. DMSO control-treated cells are predominantly CD38+ and exhibit minimal spontaneously lytic (full or abortive) cells (top panel). 4HT treatment induces distinct full lytic and abortive subsets (middle panels). Inhibition of viral DNA synthesis with PAA blocks full lytic reactivation and increases the frequency of BCL2A1+ abortive cells (bottom panels). Colored circles denote predicted corresponding model states defined from scRNA-seq. (D) Frequencies of CD38+ and BCL2A1+ cells presented in 3C by treatment condition at 24 h and 48 h. Asterisks denote significantly decreased frequencies of CD38+ cells and increased frequencies of BCL2A1+ cells upon 4HT and 4HT+PAA treatment versus respective control treatments (n = 3 per condition; two-tailed Welch’s t-test; **p<0.01). (E) EBV LMP-1, which encodes a potent activator of NF-κB signaling, is expressed in late lytic cells (left panel) but not associated with abortive cells that exhibit upregulated NF-κB transcriptomic signature including BCL2A1 (right panel, Pearson R = -0.06). (F) Flow cytometry analysis of protein biomarkers of full lytic reactivation (gp350) and NF-κB activity (ICAM1) at 48 h post 4HT treatment. Consistent with mRNA measurements, separate gp350+ and ICAM1+ populations are induced following 4HT treatment. Co-treatment with PAA reduces gp350+ cell frequency and increases ICAM1+ fractions. IKK inhibitor co-treatment reduces ICAM1+ cell frequency but does not substantially affect gp350+ cell frequency.
Fig 4
Fig 4. Cancer-associated cellular plasticity and self-renewal signature identification in EBV lytic cell subsets.
(A) Total mapped RNA reads per cell (top panel) versus total unique genes expressed across each cluster (bottom panel). (B) Unsupervised identification of high-resolution subclusters across P3HR1-ZHT time course scRNA-seq data. (C) Differentially expressed genes upregulated in lytic subclusters (E1, E2, and E3). Genes were identified by comparing each subclusters versus all others, summarized by gene ontology methods, cross-referenced against primary literature, and curated by biological annotation. (D) Co-expression of BZLF1 and genes associated with cellular pluripotency and cancer stemness (SOX2, ALDH1A1) in single cells (co-positive cells in red) by timepoint. (E) RNA Flow-FISH validation of ALDH1A1 and SOX2 expression in BZLF1+ cells (top panel) at 24 h post 4HT treatment. Frequencies of ALDH1A1+ and SOX2+ cells significantly increase in response to 4HT induction of the lytic cycle versus DMSO control treatment (bottom panel; n = 3 per condition; two-tailed Welch’s t-test; ***p<0.001; **p<0.01). (F) Flow cytometry protein level validation of elevated CD44 and CD133 expression in gp350+ versus gp350- P3HR1-ZHT cells. (G) RNA Flow-FISH analysis of ALDH1A1 expression by lytic cycle progression at 24 h post 4HT treatment. Rare spontaneously reactivated BZLF1+BLLF1+ cells express ALDH1A1 without lytic induction treatment (left panel). The frequency of BZLF1+BLLF1+ALDH1A1+ cells increases upon 4HT treatment (middle panel). ALDH1A1+ P3HR1-ZHT cells are significantly enriched after 4HT treatment but not in the context of co-treatment with PAA to block viral DNA synthesis (right panel; n = 3 per condition; two-tailed Welch’s t-test; ***p<0.001; **p<0.01; *p<0.05).
Fig 5
Fig 5. Distinct virus-mediated host shutoff responses and escapees in lytic subclusters.
(A) UMAP representation of host shutoff mediator BGLF5 expression (left panel) and per cell feature RNA (right panel) in P3HR1-ZHT timecourse scRNA-seq data. (B) Module scores for a curated set of genes that escape host shutoff (GADD45B, IL6, CCND1, IL1R1, JAG1, SERPINB2, EPHB2, FOXC1, ATF3, ZNF526, P2RY11, and HES4) by high resolution cluster. (C) Subcluster-level expression of host shutoff escapees curated from primary literature. (D) Detail of distinct host shutoff escapee signatures in two lytic subclusters (E2 and E3). (E) Biological process gene ontology (GO) analysis for genes upregulated in lytic subcluster E2 versus E3 (top panel) and E2 versus E3 + A (unstimulated cells). (F) Biological process GO analysis for genes upregulated in lytic subcluster E3 versus E2. (G) Biological process GO analysis for genes upregulated in lytic subcluster E1 versus E2 and E3.
Fig 6
Fig 6. Lytic subset reprogramming and host shutoff escape signatures are conserved in B958-ZHT lymphoblastoid cells.
(A) UMAP representation of scRNA-seq data from the inducible lytic marmoset lymphoblastoid cell line B958-ZHT before (Unstim) and 24 h after 4HT treatment. (B) Mapping of cell subclusters defined from P3HR1-ZHT analyses to B958-ZHT scRNA-seq data via transfer anchor integration (left panel). Subcluster composition is presented for unstimulated and 4HT-treated cell libraries (right panel). (C) Viral expression module (IE, early, late) and mapped lytic subcluster scores in timecourse merged B958-ZHT data. Of note, the assigned subclusters in 6B represent qualitative classifications based on maximum annotation signature scores for each cell. Accordingly, a given cell may score highly for more than one related signature while being assigned to a single classification. The underlying quantitative signature scores for E1, E2, and E3 presented here thus reflect a lytic phenotypic continuum rather than purely discrete states. (D) Conserved anticorrelation between EBV gene expression (Viral_1 module score) and genes characteristic of unstimulated and abortive phenotypes (MYC, STAT3, BCL2A1). Values denote pairwise Pearson R coefficients. (E) Conservation of key gene expression signatures identified from P3HR1-ZHT (a BL cell line) within B958-ZHT (a lymphoblastoid cell line) during EBV lytic reactivation.
Fig 7
Fig 7. Validation of abortive and reprogramming gene expression signatures in Akata BL cells stimulated by anti-Ig.
(A) Integrated scRNA-seq data from Akata cells without stimulation (blue) and 24 h after anti-Ig treatment to induce lytic reactivation (rose). (B) Cluster and subcluster mapping from P3HR1-ZHT data to Akata data via transfer anchor integration. Clusters are colored as for P3HR1-ZHT and B958-ZHT datasets. Colors represent the reference phenotype with the maximal integration score for each cell. (C) Cluster-resolved expression in integrated Akata scRNA-seq dataset. (D) UMAP visualization of viral read fraction and representative markers of abortive (yellow) and reprogramming (red) signatures. LHX1 and IL1R1 are known escapees of host shutoff. (E) GO enrichment of DE genes upregulated in anti-Ig-induced Akata lytic cells.

Update of

Similar articles

Cited by

References

    1. Wu X, Thi VLD, Huang Y, Billerbeck E, Saha D, Hoffmann H-H, et al.. Intrinsic immunity shapes viral resistance of stem cells. Cell. 2018;172(3):423–38. e25. doi: 10.1016/j.cell.2017.11.018 - DOI - PMC - PubMed
    1. Russell AB, Elshina E, Kowalsky JR, Te Velthuis AJ, Bloom JD. Single-cell virus sequencing of influenza infections that trigger innate immunity. Journal of virology. 2019;93(14):e00500–19. doi: 10.1128/JVI.00500-19 - DOI - PMC - PubMed
    1. Shalek AK, Satija R, Shuga J, Trombetta JJ, Gennert D, Lu D, et al.. Single-cell RNA-seq reveals dynamic paracrine control of cellular variation. Nature. 2014;510(7505):363–9. doi: 10.1038/nature13437 - DOI - PMC - PubMed
    1. Shalek AK, Satija R, Adiconis X, Gertner RS, Gaublomme JT, Raychowdhury R, et al.. Single-cell transcriptomics reveals bimodality in expression and splicing in immune cells. Nature. 2013;498(7453):236–40. doi: 10.1038/nature12172 - DOI - PMC - PubMed
    1. Heaton NS, Langlois RA, Sachs D, Lim JK, Palese P, tenOever BR. Long-term survival of influenza virus infected club cells drives immunopathology. Journal of Experimental Medicine. 2014;211(9):1707–14. doi: 10.1084/jem.20140488 - DOI - PMC - PubMed

MeSH terms