. 2024 Oct 25;386(6720):eadk9167.
doi: 10.1126/science.adk9167. Epub 2024 Oct 25.

Dietary pro-oxidant therapy by a vitamin K precursor targets PI 3-kinase VPS34 function

Affiliations

Dietary pro-oxidant therapy by a vitamin K precursor targets PI 3-kinase VPS34 function

Manojit M Swamynathan et al. Science. .

Abstract

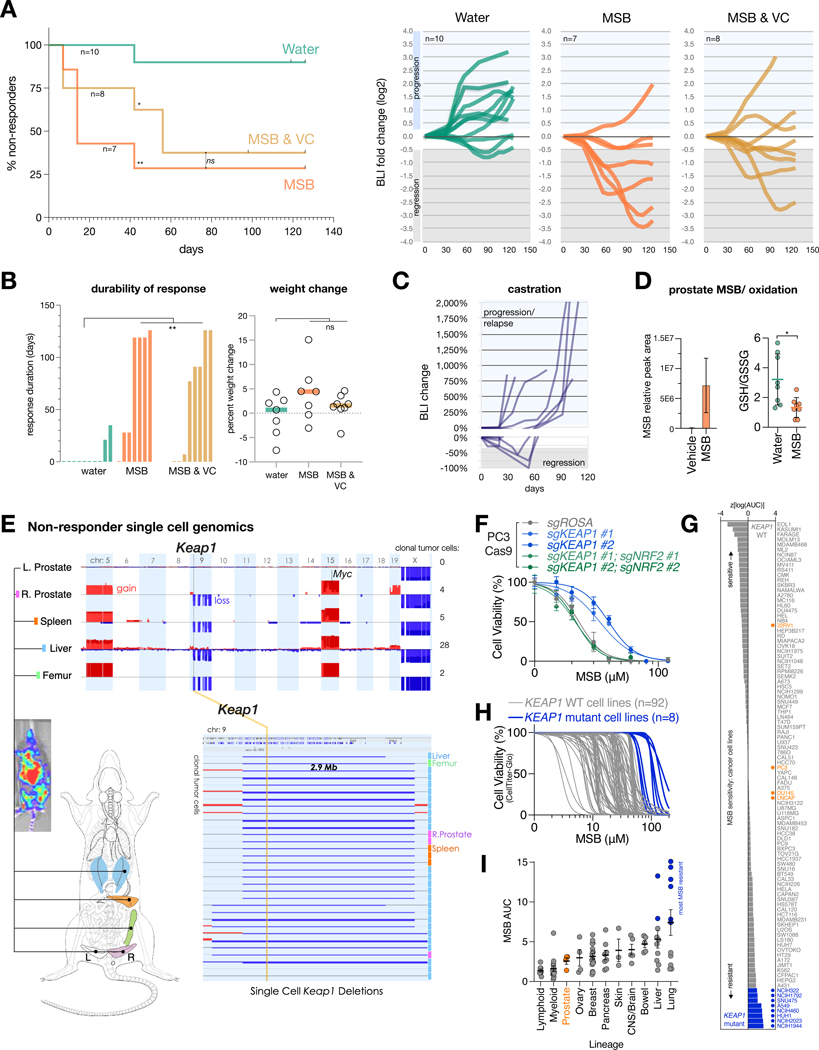
Men taking antioxidant vitamin E supplements have increased prostate cancer (PC) risk. However, whether pro-oxidants protect from PC remained unclear. In this work, we show that a pro-oxidant vitamin K precursor [menadione sodium bisulfite (MSB)] suppresses PC progression in mice, killing cells through an oxidative cell death: MSB antagonizes the essential class III phosphatidylinositol (PI) 3-kinase VPS34-the regulator of endosome identity and sorting-through oxidation of key cysteines, pointing to a redox checkpoint in sorting. Testing MSB in a myotubular myopathy model that is driven by loss of MTM1-the phosphatase antagonist of VPS34-we show that dietary MSB improved muscle histology and function and extended life span. These findings enhance our understanding of pro-oxidant selectivity and show how definition of the pathways they impinge on can give rise to unexpected therapeutic opportunities.


Conflict of interest statement

Competing Interests

R.L.W. received research funding from a grant involving AstraZeneca UK Limited. Unrelated to this work, M.E. has stock options in Agios Pharmaceuticals and was on the advisory board of Vividion Therapeutics. D.G.N has patent WO2008110777 issued (Modulators of vegf splicing as pro- and anti-angiogenic agents) with royalties paid and owns stock in D.G.N in Arvinas, Inc, D.A.T. receives stock options from Leap Therapeutics, Cygnal Therapeutics, Mestag Therapeutics, Xilis and Dunad, all unrelated to the project. Also unrelated to this project, D.A.T. is a member of the Scientific Advisory Board for Leap Therapeutics, Cygnal Therapeutics, Mestag Therapeutics, Xilis and Dunad, a scientific co-founder of Mestag Therapeutics and has received research grant support from Fibrogen, Mestag, and ONO Therapeutics and has has received consulting income from Amgen, all unrealted to this work. S.D.D. is founder and CSO of Amaroq Therapeutics Ltd and RNAfold.AI Pty Ltd, T.J. consults Flagship pioneering and LeapTx, L.C.T. consults Health Advances LLC unrelated to this work.

Figures

Figure 1.
Figure 1.. MSB suppresses PC progression and induces oxidative stress.
(A) Left: Kaplan-Meier analysis of treatment response as defined by 4 consecutive BLI measurements showing partial response using RECIST criteria (at least 30% reduction in BLI, see also fig. S1A). P values were calculated using the Mantel-Cox test. ns, not significant. *P < 0.05, **P < 0.01. Right: line plots showing disease progression over time based on weekly log2-fold change in tumor BLI signal for each trial mouse (moving average of 5 consecutive measurements). Bounds based on RECIST criteria for regression (at least 30%) and progression (at least 20%) are indicated in gray and blue shading, respectively. Start-/ endpoint BLI images and analyses are shown in fig. S1A–C. (B) Left: Durability of treatment response (at least 30% reduction) in the three trial arms. Right: percent weight change over 18 weeks (126 days). One-way analysis of variance (ANOVA) test for multiple comparisons of treatments vs water group was used. **P < 0.01, ns, not significant. (C) Reference RapidCaP trial for standard of care castration therapy as published in (4), showing regression and relapse kinetics. (D) Left: LC-MS analysis of MSB abundance in the prostates of animals treated with water or MSB (n=5 biologically independent samples). Right: Redox status indicated by the GSH/GSSG ratios in prostates of mice treated with water (n=8 biologically independent samples) or MSB (n=8 biologically independent samples). Data are mean ±s.e.m (left) and mean ±s.d (right). P values were calculated using two-tailed unpaired Student’s t-test. *P < 0.05. (E) Single nucleus whole genome copy number analysis (CNA) of a resistant RapidCaP clone that has metastasized from prostate to liver, spleen, and bone and harbors a deletion involving Keap1. See Figures S1C and S2G for disease progression. (F) Cell viability curves for the indicated CRISPR-Cas9 derived isogenic human PC3 cell lines treated with increasing concentrations of MSB for 24 hours (n=3 biologically independent samples). Data are mean ± s.d. (G) Waterfall plot of z-scores of log(AUC) values, representing MSB sensitivities of 100 cancer cell lines. Blue indicates cancer cell lines with KEAP1-loss of function, damaging or hotspot mutations. PC cell lines are shown in orange. (H) Cell viability curves of the 100 cancer cell lines (gray = KEAP1 WT; blue = KEAP1 mutant) treated with increasing concentrations of MSB for 24 hours (n=3 biologically independent samples). (I) Relationship between MSB potency and lineage for a subset of cancer cell lines tested in (H). Cancer cell types are ranked by their average MSB sensitivity. Blue indicates cancer cell lines with KEAP1-loss of function, damaging or hotspot mutations. PC cell lines are shown in orange. Data are mean ± s.e.m.
Figure 2.
Figure 2.. MSB triggers an oxidative cell death modality.
(A) GSH/GSSG ratios (n=3 biologically independent samples). (B) Cytoplasmic ROS levels quantified by staining of CM-H2DCFDA followed by flow cytometry (n=3 biologically independent samples) in vehicle, NAC (0.5 mM), MSB (20 μM), or MSB+NAC treated Pten−/−; Trp53−/− MEFs, 4 hours post treatment. Data are mean ± s.d. P values were calculated using one-way ANOVA. **P < 0.01, ****P < 0.0001. (C) Heatmap plotting ΔAUCn values depicts the extent of protection conferred by different cysteine metabolites from MSB-induced cell death. ΔAUCn > 0 or yellow color indicates that the respective cysteine metabolite protects from MSB induced cell death. (D) A heatmap of the differential sensitivities for 40 compounds (rows) in the CRISPR-Cas9 derived isogenic PC3 cell lines (columns). ΔAUCn > 0 (or yellow) indicates increased resistance and ΔAUCn < 0 (or red) indicates increased sensitivity to a particular compound. ΔAUCn = 0 (or black) indicates no differential sensitivity between the isogenic cell lines. Erastin, RSL3, MSB, and H2O2 (indicated in blue) are grouped together through unsupervised hierarchical clustering analysis. (E) Top: modulatory profiling depicting the effect of 14 cell death modulators (columns) on MSB-induced cell death or other distinct cell death pathways induced by the indicated compounds (rows) in Pten−/−; Trp53−/− MEFs. ΔAUCn > 0 (or yellow color) indicates a protective effect of the modulator from the cell death pathway/compound, while ΔAUCn < 0 (or red color) indicates that the given modulator renders cells more sensitive to the cell death pathway/compound. ΔAUCn = 0 (or black color) indicates that the given modulator has no effect on the cytotoxic effect of the compound. Bottom: viability curves of Pten−/−; Trp53−/− MEFs treated with increasing concentrations of MSB for 24 hours, alone or in combination with GSH (0.5 mM, left) or ferrostatin-1 (2.5 μM, right) (n=3 biologically independent samples). Data are mean ± s.d. (F) Left: modulatory profiling depicting the effect of 11 redox/ROS modulators (columns) on toxicity induced by MSB, other pro-oxidative, or non-oxidative compounds (rows) in Pten−/−; Trp53−/− MEFs. Right: viability curves of Pten−/−; Trp53−/− MEFs treated with increasing concentrations of erastin (top) or MSB (bottom) for 24 hours, alone or in combination with the lipophilic antioxidant vitamin E (100 μM) (n=3 biologically independent samples). Data are mean ± s.d. (G) Production of lipid reactive oxygen species measured and quantified by staining of C11-BODIPY 6 hours post vehicle, NAC (0.5 mM), MSB (20 μM), NAC+MSB, erastin (0.3 μM) or erastin+NAC treatment in Pten−/−; Trp53−/− MEFs followed by flow cytometry (n=3 biologically independent samples). Data are mean ± s.d. P values were calculated using one-way ANOVA. **P < 0.01, ***P < 0.001. (H) Transmission electron microscopy images of Pten−/−; Trp53−/− EpCaP cells (left, scale bar, 1 μm) or PC3 cells (right, scale bar, 2 μm) upon vehicle or MSB (30 μM) treatment. (I) Quantification of the number of enlarged vesicles in EpCaP cells (left) or PC3 cells (right) treated with vehicle or MSB (30 μM). Data are mean ± s.d. P values were calculated using two-tailed unpaired Student’s t-test. ****P < 0.0001.
Figure 3.
Figure 3.. Genome-wide functional regulators of MSB-kill.
(A) Genome-wide CRISPR screens showing log2 fold change in abundance for genes upon MSB vs vehicle treatment in PC3-Cas9 cells. Gene ranked leading edge and lagging tail of the sensitizing screen at 15 μM MSB and of the resistance screen at 30 μM MSB are shown left and right, respectively (light blue circles in background). Inserts show endocytosis regulators (red and purple crosses) among the top 50 (dark blue circles). Core apoptosis and autophagy genes are marked as green and gray crosses, respectively. The role of VPS15 in generating early endosome identity as part of the VPS34 complex and its antagonist, MTM1, is drawn. (B) Top: domain architecture of human VPS15 (encoded by PIK3R4). Locations of domain targeting sgRNAs are shown (arrowheads). Bottom: competition assay in indicated human PC cells stably expressing Cas9. Data are mean ± s.e.m, n=4 biologically independent samples. (C) CRISPR design and results for validation of MTM1 gene targeting, shown as in (B). (D) Left: confocal images of RapidCaP derived cells stably expressing tdTomatoFP (red), fixed after 4 hours of treatment with vehicle or MSB (15 μM). The cells were cultured in medium supplemented with fluorescein-dextran (3 kDa) for the duration of the treatment. Arrowheads point to dextran-positive vacuoles. Scale bar, 5 μm. Right: quantification of the number of dextran positive vacuoles per cell after 4 hours of treatment with vehicle (n=47 cells) or MSB (n=49 cells). Data are mean ± s.e.m. P values were calculated using two-tailed unpaired Student’s t-test. ****P < 0.0001. (E) 17,199 genes ranked based on the correlation of their essentiality profile with that of PIK3R4 in 1095 cancer cell lines using CRISPR screening data from the Broad's DepMap database (23Q2). (F) Summary of protein and gene constituents of VPS34 complex I and II. The complex I - II - exclusive genes are highlighted.
Figure 4.
Figure 4.. VPS34 is a functional target of menadione.
(A) Cell death analysis using EC100 dose of VPS34-IN1. Still images from time lapse (20 minute interval) recording of treated EpCaP cells at indicated time points. Arrows point to cell blebbing events in the field of view. Scale bar, 10 μm, inset box width, 20 μm. Please see associated Movies S1–S3. (B) Kaplan-Meier event analysis for VPS34-IN1 (40 μM) (n=177 cells), VPS34-IN1 (40 μM) + NAC (500 μM) (n=84 cells), and vehicle (n=74 cells), scoring for 1) onset of vacuolization, as defined by time of appearance of cytoplasmic vesicles ≥ 3 μm diameter and 2) burst time as scored by between-frame depletion of cytosolic tdTomato, indicating PM rupture (please see associated Movies S1–S3). P values were calculated using Log-rank (Mantel-Cox) test: VPS34-IN1 vs VPS34-IN1+NAC (vacuolization: P = 0.5912, burst: P = 0.3036); VPS34-IN1 vs vehicle (vacuolization: P < 0.0001, burst: P < 0.0001). (C) Cell death analysis recorded and labeled as in (A), but using EC100 dose of MSB. Scale bar, 10 μm, inset box width, 20 μm. Please see associated Movies S4 and S5. (D) Kaplan-Meier event analysis for MSB (30 μM) (n=127 cells), MSB (30 μM) + NAC (500 μM) (n=200 cells), scoring for 1) onset of vacuolization and 2) burst time, as described in (B). P values were calculated using Log-rank (Mantel-Cox) test: MSB vs MSB+NAC (vacuolization: P < 0.0001, burst: P < 0.0001); MSB vs vehicle (vacuolization: P < 0.0001, burst: P < 0.0001). (E) Still images of the PI(3)P - early endosome marker GFP-2xFYVE in time lapse recordings from (A) and (C) with indicated treatments and times. Scale bar, 10 μm, inset box width, 20 μm. Please see associated Movies S6–S9. (F) Quantification of 2XGFP-FYVE puncta from time lapse experiments shown in (A-E) for vehicle, MSB and VPS34-IN1 treatment over time. Note that the marked reduction in both treatment conditions occurs prior to cell burst (before 480 minutes), as determined in (B) and (D). (G) Number of PI(3)P positive vesicles in PC3-Cas9 cells fixed after 4 hours of treatment with indicated small molecules or expression of indicated sgRNAs (vehicle n=40, MSB-low, 15 μM, n=15, MSB-high, 25 μM, n=51, VPS34-IN1, 10 μM, n=14, sgROSA n=21, sgPIK3C3 #5 n=13, sgPIK3C3 #8 n=22). Data are mean ± s.e.m. P values were calculated using one-way ANOVA. ns, not significant, **P < 0.01, ****P < 0.0001. (H) Cartoon for RAB5-mediated recruitment of VPS34 complex II to an endosomal membrane and its suppression by the kinase inhibitor VPS34-IN1 and pro-oxidant MSB. (I) Left top: confocal images of EpCaP cells stably expressing tdTomato and transiently expressing RAB5-GFP after 4 hours of treatment with vehicle or MSB (15 μM). Scale bar, 5 μm. Left bottom: quantification of mean RAB5-GFP positive vesicle volume per cell after vehicle (n=14) or MSB (15 μM, n=12) treatment. Data are mean ± s.e.m. P values were calculated using two-tailed unpaired Student’s t-test. ****P < 0.0001. Right: quantification of RAB5-mRFP positive vacuoles per cell in VPS34 (Pik3c3loxP/loxP) conditional KO-MEF after vehicle (n=33), MSB (20 μM, n=23), VPS34-IN1 (10 μM, n=13) treatment, control (n=22) or Cre-mediated kinase ablation (n=16). Data are mean ± s.d. P values were calculated using one-way ANOVA. ns, not significant, ***P < 0.001, ****P < 0.0001.
Figure 5.
Figure 5.. Dietary menadione extends lifespan in a myotubular myopathy model.
(A) Top: Domain architecture of human class III PI 3-Kinase VPS34. Bottom: Heatmap representation of percent depletion in free thiol status of VPS34 cysteines in MSB-treated cells compared to vehicle. (B) Left: Log2 fold change in relative abundance of GFP-positive Pik3c3Δ/Δ cells, expressing the indicated VPS34 mutants, 18 days post Cre infection (n=3 each). Right: competition-based proliferation assay in Cre and GFP-expressing Pik3c3loxP/loxP MEFs expressing the indicated VPS34 mutants. Percent GFP-positive cells, normalized to day 6 post Cre.GFP infection, are measured over time. Data are mean ± s.e.m. P values were calculated using one-way ANOVA. ns, not significant, **P < 0.01, ****P < 0.0001. (C) Confocal images of Pik3c3loxP/loxP MEFs stably expressing RAB5-mRFP (gray) and the indicated VPS34 mutants, 10 days post adeno-empty or Cre infection. Arrowheads point to RAB5 coated endocytic vacuoles (“v”). “nl” indicates normal RAB5-positive early endocytic vesicles. Scale bar, 5 μm. (D) Kaplan–Meier survival curves for Mtm1 WT and KO male mice, enrolled on the day of weaning to receive regular drinking water or MSB dissolved in the drinking water (Mtm1 WT, water n=16; Mtm1 WT, MSB n=14; Mtm1 KO, water n=16; Mtm1 KO, MSB n=17). P value was calculated by Log-rank (Mantel-Cox) test. ****P < 0.0001. (E) Body mass of Mtm1 WT and KO male mice from trial shown in (D): Mtm1 WT, water n=15; Mtm1 WT, MSB n=13; Mtm1 KO, water n=16; Mtm1 KO, MSB n=17. P value was calculated using two-tailed unpaired Student’s t-test. **P < 0.01. (F) Photographs of untreated and treated Mtm1 WT and KO male littermates from 2 litters (36 days old), showing observed differences in size between genotypes and treatment groups. (G) Representative images of hematoxylin and eosin staining in TA muscle sections of Mtm1 WT and KO mice from the indicated trial arms. Scale bar, 50 μm. (H) Left: Minimum Feret diameter (MinFeret) distribution of TA fibers in Mtm1 WT and KO male mice from the indicated treatment arms. Middle Panels: Frequency of TA fibers with MinFeret diameter lower than 35 μm and higher than 35 μm, respectively. Right panels: Fraction of fibers with mislocalized nuclei and abnormal SDH staining. P values were calculated using one-way ANOVA. ns, not significant, *P < 0.05, **P < 0.01, ***P < 0.01, ****P < 0.0001 (I) Representative images of SDH activity in TA muscle sections of Mtm1 WT and KO mice from the indicated trial arms. Scale bar, 50 μm. (J) Representative images depicting TA ultrastructure by TEM, from untreated or MSB treated Mtm1 WT and KO mice. Magnification of a triad is shown in TA of Mtm1 WT mice. “mito” or “mi” indicates mitochondria. Scale bar, 1 μm.

Comment in

References

    1. Siegel RL, Giaquinto AN, Jemal A, Cancer statistics, 2024. CA Cancer J Clin 74, 12–49 (2024). - PubMed
    1. Lippman SM et al., Effect of selenium and vitamin E on risk of prostate cancer and other cancers: the Selenium and Vitamin E Cancer Prevention Trial (SELECT). JAMA 301, 39–51 (2009). - PMC - PubMed
    1. Klein EA et al., Vitamin E and the risk of prostate cancer: the Selenium and Vitamin E Cancer Prevention Trial (SELECT). JAMA 306, 1549–1556 (2011). - PMC - PubMed
    1. Cho HJ et al., RapidCaP, a Novel GEM Model for Metastatic Prostate Cancer Analysis and Therapy, Reveals Myc as a Driver of Pten-Mutant Metastasis. Cancer Discovery 4, 318–333 (2014). - PMC - PubMed
    1. Nowak DG et al., MYC Drives Pten/Trp53-Deficient Proliferation and Metastasis due to IL6 Secretion and AKT Suppression via PHLPP2. Cancer Discov 5, 636–651 (2015). - PMC - PubMed

Publication types

MeSH terms