. 2024 Dec;11(46):e2407705.
doi: 10.1002/advs.202407705. Epub 2024 Oct 24.

Unfractionated Heparin Enhances Sepsis Prognosis Through Inhibiting Drp1-Mediated Mitochondrial Quality Imbalance

Affiliations

Unfractionated Heparin Enhances Sepsis Prognosis Through Inhibiting Drp1-Mediated Mitochondrial Quality Imbalance

Ruixue Liu et al. Adv Sci (Weinh). 2024 Dec.

Abstract

Unfractionated heparin (UFH) is commonly used as an anticoagulant in sepsis treatment and has recently been found to have non-anticoagulant effects, but underlying mechanisms remain unclear. This retrospective clinical data showed that UFH has significant protective effects in sepsis compared to low-molecular-weight heparin and enoxaparin, indicating potential benefits of its non-anticoagulant properties. Recombinant protein chip screening, surface plasmon resonance, and molecular docking data demonstrated that UFH specifically bound to the cytoplasmic Drp1 protein through its zone 2 non-anticoagulant segment. In-vitro experiments verified that UFH's specific binding to Drp1 suppressed Drp1 translocation to mitochondria following "sepsis" challenge, thereby improving mitochondrial morphology, function and metabolism in vascular endothelial cells. Consequently, UHF comprehensively protected mitochondrial quality, thus reducing vascular leakage and improving prognosis in a sepsis rat model. These findings highlight the potential of UFH as a sepsis treatment strategy targeting non-anticoagulation mechanism.

Keywords: Drp1; endothelial dysfunction; mitochondria quality; sepsis; unfractionated heparin.


Conflict of interest statement

The authors declare no conflict of interest.

Figures
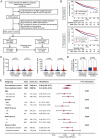
Figure 1
Figure 1
Efficacy of UFH therapy in sepsis outcomes. A) Flowchart illustrating the selection of patients with sepsis from the MIMIC‐IV database. B) Kaplan–Meier survival curves comparing survival rates of patients with sepsis with and without UFH therapy before (upper) and after (lower) propensity score matching. C) Duration of hospital and ICU stay before and after propensity score matching. D) Incidence of intracranial hemorrhage and gastrointestinal bleeding in patients following propensity score matching. E) Forest plot of hazard ratios (HRs) for mortality in pre‐ and post‐matched cohorts, analyzed according to age, sex, Simplified Acute Physiology Score (SAPS) II, Sequential Organ Failure Assessment (SOFA) score, and route of UFH administration. P < 0.05 was considered to indicate a statistically significant effect. LMWH, low‐molecular‐weight heparin; eGFR, estimated glomerular filtration rate.
Figure 2
Figure 2
Efficacy of ENO therapy on sepsis outcomes. A) Flowchart illustrating the selection of patients with sepsis from the MIMIC‐IV database. B) Kaplan–Meier survival curves comparing the effect of ENO on the survival rates of patients with sepsis before and after propensity score matching. C) Forest plot of hazard ratios (HRs) for mortality in pre‐ and post‐matched cohorts analyzed by age, sex, Simplified Acute Physiology Score (SAPS) II, and Sequential Organ Failure Assessment (SOFA) score. P < 0.05 was considered to indicate a statistically significant effect. LMWH, low‐molecular‐weight heparin; eGFR, estimated glomerular filtration rate.
Figure 3
Figure 3
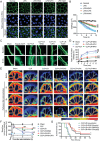
Multifaceted effects of UFH in a septic rat model. A) Effect of UFH on survival rate and duration of sepsis (n = 9 per group) in the cecal ligation and puncture (CLP)‐induced sepsis rat model. B) Comparative analysis of biochemical markers, including lactate, interleukin (IL)‐6, IL‐1β, and tumor necrosis factor (TNF)‐α, after UFH treatment (n = 5 per group). C) Assessment of coagulation parameters, including prothrombin time (PT), thrombin time (TT), and activated partial thromboplastin time (APTT), after UFH treatment (n = 5 per group). D) Microscopic observation of the coagulation dynamics (n = 3). Data are presented as mean ± standard deviation. E) Sodium dodecyl sulfate‐polyacrylamide gel electrophoresis results for purification of recombinant Drp1 (upper left) and the steps for applying small‐molecule microarrays (upper right). The lower panel shows scan images of the control (6× His‐tag biotin) and experimental (Drp1–biotin) samples on the chip. Red arrows indicate the positive control (biotin), blue arrows indicate the negative control (dimethyl sulfoxide), and yellow arrows indicate positive small‐molecule hits. F) Potentially positive small‐molecule analysis results. The fold change was calculated to indicate the extent to which the experimental sample was higher than the control sample, with a threshold of fold change ≥ 1.5 used to identify a potentially specific positive small molecule for the experimental sample. a: P < 0.05 compared with Sham group, b: P < 0.05 compared with Sepsis (CLP) group. c: P<0.05 compared with Sepsis + LR group.
Figure 4
Figure 4
Interaction Analysis of UFH with Drp1. A) Schematic representation of UFH and NAH docking with Drp1. B) Surface plasmon resonance assays depicting the affinity of UFH, NAH, and ENO for Drp1. C) Surface plasmon resonance assays showing the binding affinity of UFH, NAH, and ENO for AT III protein.
Figure 5
Figure 5
Drp1 localization in vascular endothelial cells (VECs) under sepsis. A) Drp1 expression in the blood vessels of rats from each group (n = 3). B) Confocal images and quantification of Drp1‐ and MitoTracker‐labeled mitochondria in lipopolysaccharide (LPS)‐treated VECs as an in‐vitro sepsis model; scale bars, 20 µm (n = 3). C) Drp1 expression in the subcellular regions of VECs in each group (n = 3). Lowercase letters a and b above bars indicate a significant difference (P < 0.05) compared with the Sham or Normal group and compared with the CLP or LPS group, respectively.
Figure 6
Figure 6
Comparative effects of ENO, UFH, and NAH treatments on mitochondrial quality of the vasculature in sepsis. A) Electron microscopy images of mitochondrial morphology in the vessel tissues of control and cecal ligation and puncture (CLP)‐induced septic rats with different treatments; scale bars, 500 nm (n = 3). B) Representative images of O2 flux per mass in each group (top left). The summarized data of the oxygen consumption capacity, as measured by high‐resolution respirometry in complex I and II, including CI leak, CI P (OXPHOS), CI + CII P, CI + CII ETS (electron transfer system capacity), and CII ETS (n = 3). Lowercase letters a and b above indicate a significant difference (P < 0.05) compared with the Sham group and CLP group, respectively.
Figure 7
Figure 7
Comparative effects of ENO, UFH, and NAH treatments on mitochondrial quality of vascular endothelial cells (VECs) in sepsis. A) Representative confocal microscopy images of mitochondria in VECs (scale bars, 50 µm). B) Representative confocal microscopy images of mitochondrial membrane potential (ΔΨm); scale bars, 50 µm (n = 3). C) Representative confocal microscopy images of reactive oxygen species (ROS) production, measured according to the fluorescent intensity, in VECs; scale bars, 30 µm (n = 3). D) Detect the ROS level in each group using flow cytometry in VECs (n = 3). E) Effect of heparin on mitochondrial respiration in VECs (n = 3). Lowercase letters a and b above indicate a significant difference (P < 0.05) compared with the normal group and LPS group, respectively.
Figure 8
Figure 8
Differential impacts of ENO, UFH, and NAH on vascular endothelial integrity and prognosis in the rat sepsis model. A) Immunofluorescent detection of tight junctions (ZO‐1) in vascular endothelial cells (VECs) across treatment groups; scale bars = 50 µm (n = 3). B) Transmembrane electrical resistance (TEER) measurements of VEC monolayers in each group. C) FITC–BSA permeability in mesenteric microvessels; scale bars = 20 µm (n = 3). D) Quantitative analysis of vascular leakage. E) Speckle tomography visualization of mesenteric blood flow (n = 3). F) Quantification of mesenteric perfusion rates. G) Survival analysis after treatment with ENO, UFH, or NAH in rats with sepsis (n = 9). Lowercase letters a, b, and c above indicate a statistically significant difference (P < 0.05) compared with the Sham or Normal group, compared with the CLP or LPS group, and compared with the LR group, respectively.
Figure 9
Figure 9
Schematic of the non‐anticoagulant mechanism of unfractionated heparin in ameliorating sepsis outcomes by modulating mitochondrial quality.

Similar articles

Cited by

References

    1. Cecconi M., Evans L., Levy M., Rhodes A., Lancet 2018, 392, 75. - PubMed
    1. Hou X., Zhang X., Zhao W., Zeng C., Deng B., McComb D. W., Du S., Zhang C., Li W., Dong Y., Nat. Nanotechnol. 2020, 15, 41. - PMC - PubMed
    1. Rudd K. E., Johnson S. C., Agesa K. M., Shackelford K. A., Tsoi D., Kievlan D. R., Colombara D. V., Ikuta K. S., Kissoon N., Finfer S., Fleischmann‐Struzek C., Machado F. R., Reinhart K. K., Rowan K., Seymour C. W., Watson R. S., West T. E., Marinho F., Hay S. I., Lozano R., Lopez A. D., Angus D. C., Murray C. J. L., Naghavi M., Lancet 2020, 395, 200. - PMC - PubMed
    1. Bode C., Weis S., Sauer A., Wendel‐Garcia P., David S., Crit. Care 2023, 27, 478. - PMC - PubMed
    1. Ranieri V. M., Thompson B. T., Barie P. S., Dhainaut J.‐F., Douglas I. S., Finfer S., Gårdlund B., Marshall J. C., Rhodes A., Artigas A., Payen D., Tenhunen J., Al‐Khalidi H. R., Thompson V., Janes J., Macias W. L., Vangerow B., Williams M. D., N. Engl. J. Med. 2012, 366, 2055. - PubMed

MeSH terms

LinkOut - more resources