. 2024 Oct 23;12(10):e009712.
doi: 10.1136/jitc-2024-009712.

Alum-anchored IL-12 combined with cytotoxic chemotherapy and immune checkpoint blockade enhanced antitumor immune responses in head and neck cancer models

Affiliations

Alum-anchored IL-12 combined with cytotoxic chemotherapy and immune checkpoint blockade enhanced antitumor immune responses in head and neck cancer models

Kellsye P Fabian et al. J Immunother Cancer. .

Abstract

Background: First-line treatment with pembrolizumab plus chemotherapy in recurrent and metastatic head and neck squamous cell carcinomas (HNSCC) has improved survival. However, the overall response rate with this standard of care regimen (SOC) remains limited. Interleukin (IL)-12 is a potent cytokine that facilitates the crosstalk between innate and adaptive immunity, making it crucial in the antitumor response. Alum-anchored murine IL-12 (mANK-101) has been demonstrated to elicit robust antitumor responses in diverse syngeneic models, which were correlated with increased immune effector functions and prolonged local retention of IL-12. This study investigates the therapeutic benefit of combining mANK-101 with SOC in the MOC1 and MOC2 murine HNSCC tumor models.

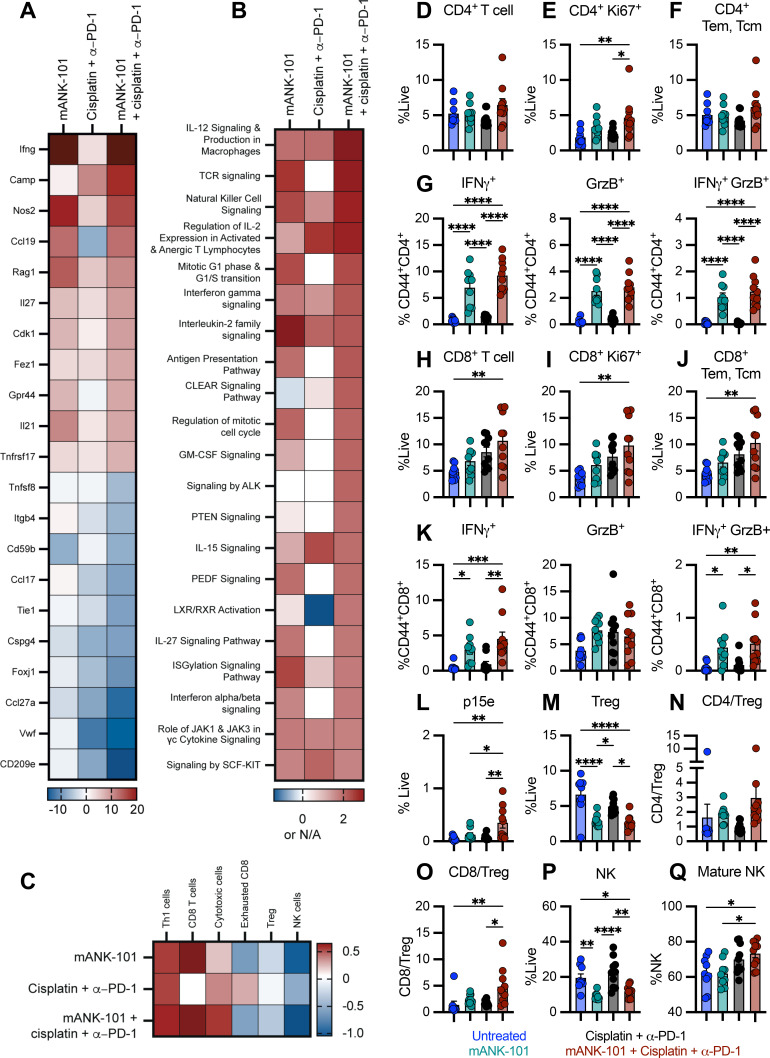
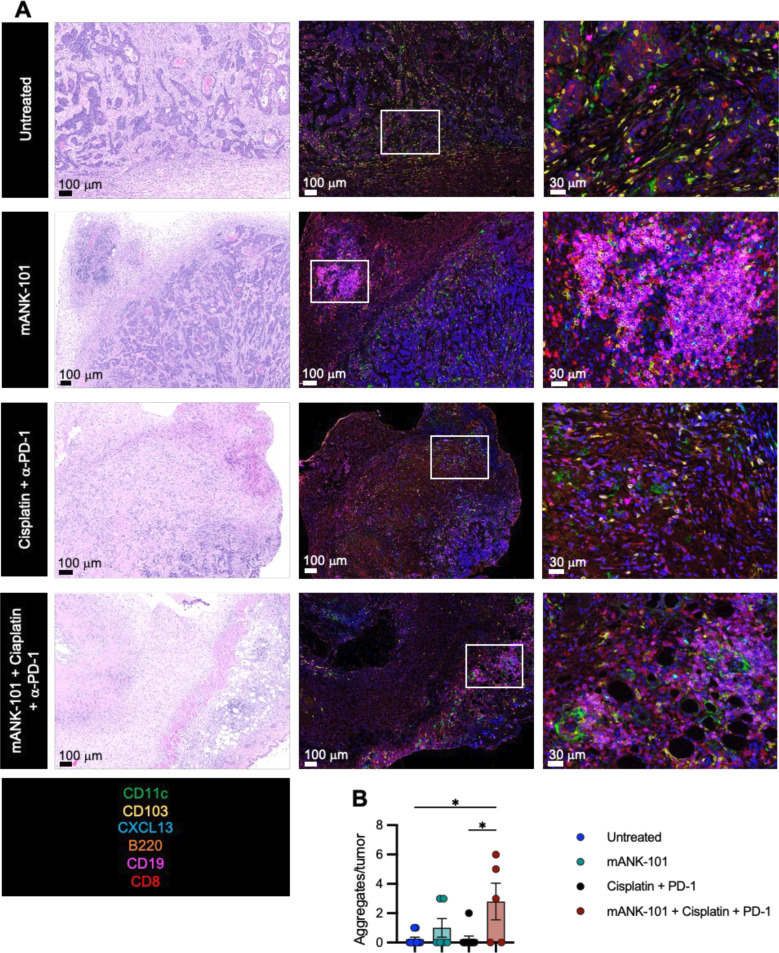
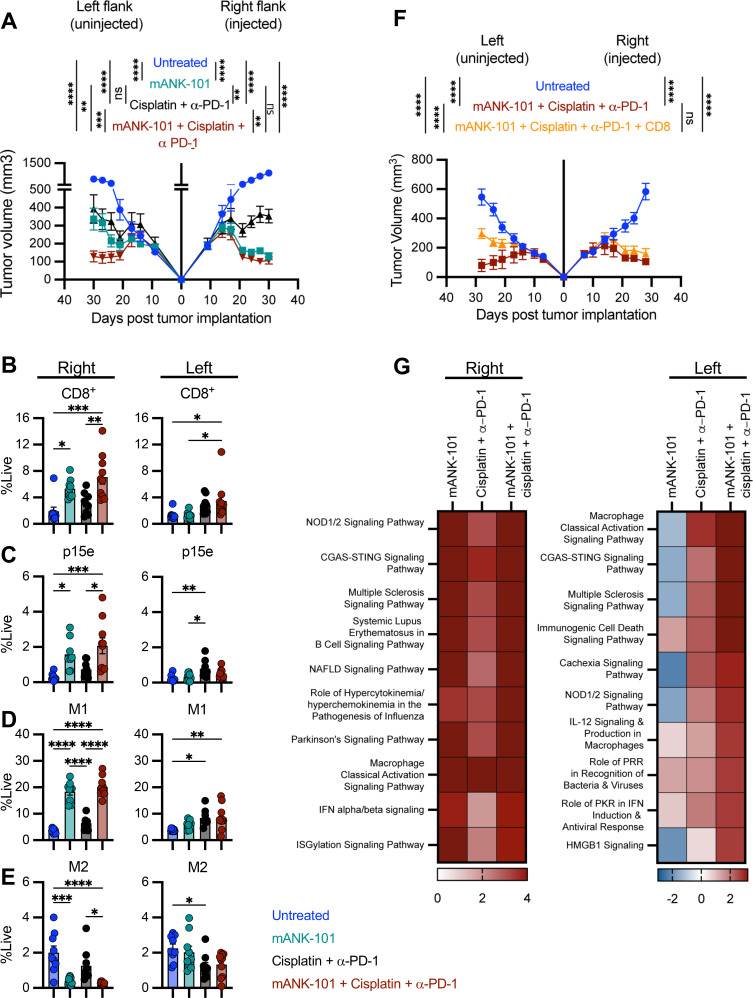
Methods: MOC1 and MOC2 tumor-bearing C57BL/6 mice were administered with a single intratumoral injection of mANK-101 and weekly intraperitoneal injections of cisplatin and α-programmed death 1 (PD-1) for 3 weeks. For MOC1, flow cytometry and cytokine array were performed to assess the immune effector functions associated with the combinational treatment. Multiplex immunofluorescence was employed to characterize the influence of the treatment on the immune architecture in the tumors. RNA analysis was implemented for in-depth examination of the macrophage and effector populations.

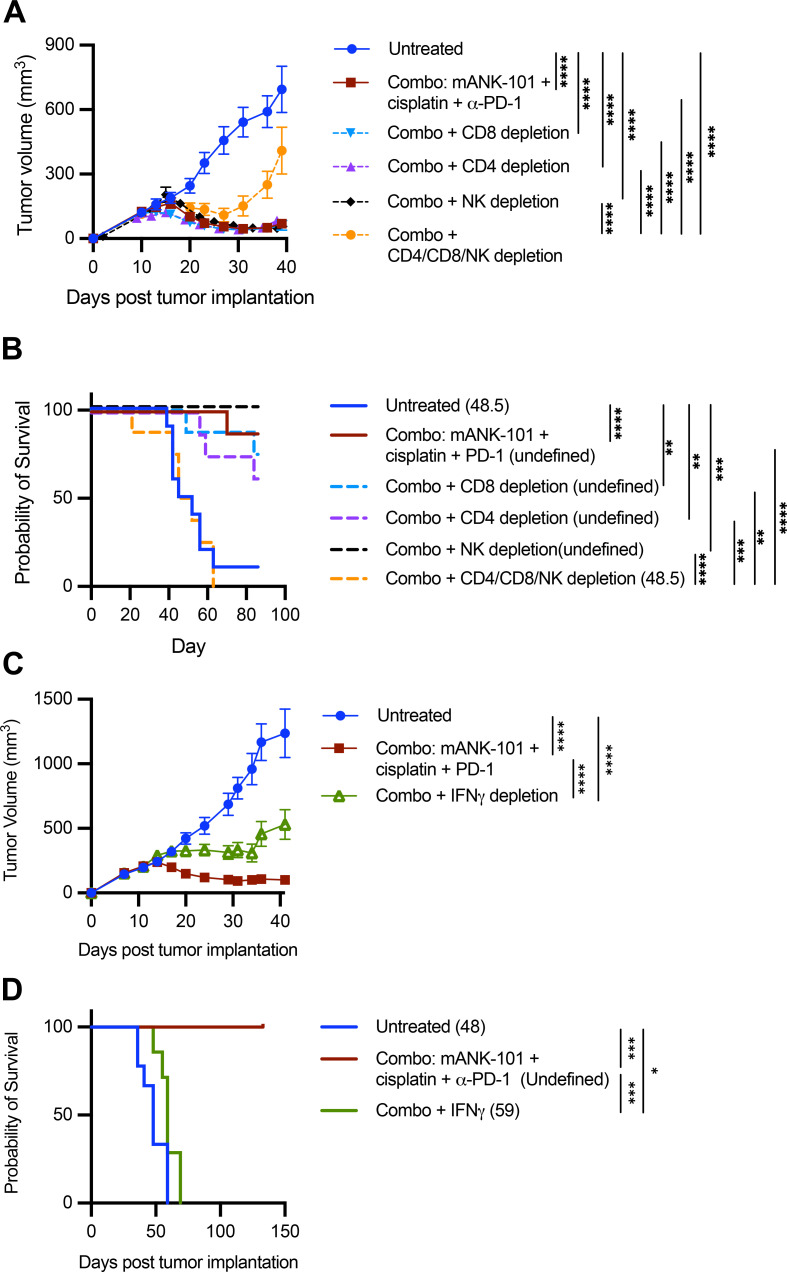
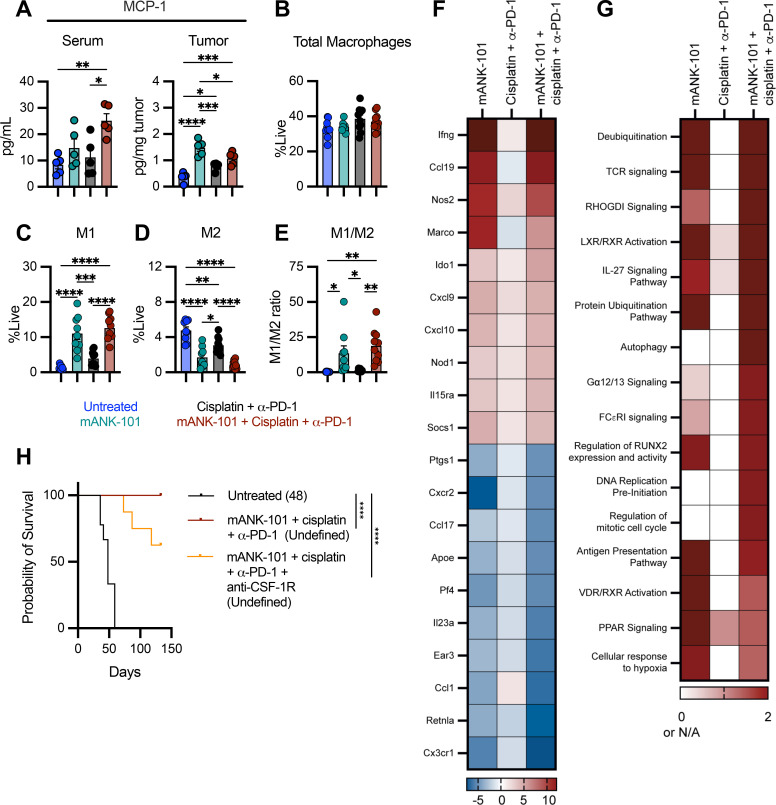
Results: In the MOC1 and MOC2 models, combination therapy with mANK-101, cisplatin, and α-PD-1 resulted in superior tumor growth inhibition and resulted in the highest rate of tumor-free survival when compared with treatment cohorts that received mANK-101 monotherapy or SOC treatment with α-PD-1 plus cisplatin. Furthermore, the combination therapy protected against tumor re-growth on rechallenge and controlled the growth of distal tumors. The improved therapeutic effect was associated with increased CD8+ T-cell recruitment, increased CD8+ and CD4+ activity, and repolarization of the macrophage population from M2 to M1 at the tumor site. Elevated and prolonged interferon-γ expression is central to the antitumor activity mediated by the combination therapy. In addition, the combination therapy with mANK-101+cisplatin+α-PD-1 induced the formation of tertiary lymphoid structure-like immune aggregates in the peritumoral space.

Conclusion: The current findings provide a rationale for the combination of alum-tethered IL-12 with cisplatin and α-PD-1 for HNSCC.

Keywords: Abscopal; Chemotherapy; Cytokine; Head and Neck Cancer; Solid Tumor.


Conflict of interest statement

Competing interests: HK and SB work for Ankyra Therapeutics.

Figures

Figure 1
Figure 1. Combination therapy with mANK-101, cisplatin, and α-PD-1 elicits antitumor effect in the MOC1 and MOC2 murine oral squamous cell carcinoma models. (A–D) Female C57BL/6 mice (8–12 weeks old; n=10/group) were implanted with 5×10⁶ MOC1 cells on the right flank on day 0 and treated with a single i.t. injection of 5 μg mANK-101 on day 10, when the tumor volume average was ~200 mm3. The mice were also treated with cisplatin (5 mg/kg, i.p.), and α-PD-1 (200 µg, i.p.) on days 10, 17, and 24 as described in (A) the treatment schematic diagram. Tumor growth was monitored. (B) Mean and (C) individual growth curves are presented. Insets denote the number of animals that were tumor-free at the end of the study. (D) Animal survival was followed, with number in parentheses indicating the mOS. (E–F) A new cohort of MOC1 tumor-bearing animals was treated as described in A. On day 55, tumor-free animals resulting from the triple therapy were re-challenged with 5×10⁶ MOC1 cells. Naïve C57BL/6 mice were used as untreated controls. (E) Tumor growth mean and (F) survival post-tumor rechallenge were monitored. (G–H) Female C57BL/6 mice (8–12 weeks old; n=8/group) were implanted on the right and left flanks with 5×10⁶ MOC1 cells each. The mice were treated as described in A. Sera and primary tumors (n=4–5/group) were collected on days 15 and 22. The samples were analyzed for (G) IL-12p70 and (H) IFN-γ via multiplex cytokine array. (I) Female C57BL/6 mice (8–12 weeks old; n=8/group) were implanted with 1×10⁵ MOC2 cells and were treated as described in A. Tumor growth was monitored and mean tumor volume is shown. Statistical tests: tumor growth: two-way ANOVA with Tukey’s post hoc test; survival: Mantel-Cox test; comparison between groups: one-way ANOVA with Tukey’s post hoc test. Error bars, SEM. *p<0.05, **p<0.01, ***p<0.001, ****p<0.0001. ANOVA, analysis of variance; IFN, interferon; i.p., intraperitoneal; mOS, median overall survival; ns, not significant; PD-1, programmed death 1; TF, tumor-free.
Figure 2
Figure 2. Combination therapy with mANK-101, cisplatin, and α-PD-1 elicits a superior antitumor effect compared with monotherapy and double combination therapy. Female C57BL/6 mice (8–12 weeks old; n=11–12/group) were implanted with 5×10⁶ MOC1 cells on the right flank on day 0, were treated as described in figure 1A, and were monitored. (A–C) Mean and (D) individual growth curves are presented. Insets denote the number of animals that were tumor-free at the end of the study. (E) Body weight changes over time were also monitored. Statistical tests: tumor growth: two-way ANOVA with Tukey’s post hoc test. Error bars, SEM. *p<0.05, **p<0.01, ***p<0.001. ANOVA, analysis of variance; PD-1, programmed death 1; TF, tumor-free.
Figure 3
Figure 3. Combination therapy with mANK-101, cisplatin, and α-PD-1 promotes antitumor immune responses. (A–C) Female C57BL/6 mice (8–12 weeks old; n=5–10/group) were implanted with 5×10⁶ MOC1 cells on the right flank on day 0 and were treated with mANK-101 (5 µg, i.t.), cisplatin (5 mg/kg, i.p.), and α-PD-1 (200 µg, i.p.) on day 10. On day 15, gene expression analysis was performed on tumor-infiltrating CD45+ cells by NanoString Mouse PanCancer IO360. Heatmaps showing (A) the top 10 upregulated and downregulated transcripts in the combination group compared with the untreated control based on fold-change, (B) the pathway enrichment analysis based on z-score and (C) cell type profiles based on cell type z-score. (D–Q) On day 15, flow cytometric analysis was performed to determine (D) the frequency of CD4+ T cells, (E) the frequency of Ki67+ CD4+ T cells and (F) the frequency of memory CD4 T cells. The CD44+CD4+ compartment was further analyzed for the frequency of (G) IFN-γ+, granzyme B+, and IFN-γ+granzyme B+ cells. The frequencies of (H) CD8+ T cells, (I) Ki67+ CD8+ T cells and (J) memory CD8 T cells were also determined. Likewise, the CD44+CD8+ T cells that were interrogated for (K) IFN-γ+, granzyme B+, and IFN-γ+ granzyme B+ expression. Staining was also performed to identify (L) p15e tetramer-positive CD8+ T cells as well as (M) FoxP3+CD4+ Treg cells. (N) CD4/Treg and (O) CD8/Treg ratios were calculated. (P) The frequency of CD49b+ NK cells, as well as (Q) the frequency of NK cells that are mature (CD11b+) were determined. Statistical tests: one-way ANOVA with Tukey’s post hoc test. Error bars, SEM *p<0.05, **p<0.01, ***p<0.001, ****p<0.0001. ANOVA, analysis of variance; GrzB, granzyme B; IFN, interferon; i.p., intraperitoneal; i.t., intratumoral; N/A, not applicable; NK, natural killer; PD-1, programmed death 1; Tcm, central memory T cell; Tem, effector memory T cell; Treg, regulatory T cell.
Figure 4
Figure 4. Combination therapy with mANK-101, cisplatin, and α-PD-1 results in the emergence of immune aggregates in the MOC1 tumor. Female C57BL/6 mice (8–12 weeks old; n=8–10/group) were implanted with 5×10⁶ MOC1 cells on the right flank on day 0 and were treated as described in figure 1A. On day 28, the tumors were harvested and fixed for (A) H&E (leftmost panels) and multiplex immunofluorescence staining (middle and rightmost panels). (B) Immune aggregates composed of closely associated B220+CD19+ B cells, CD11c+ DCs, CD8+ T cells with CD103 and CXCL13 expression were counted. Statistical tests: one-way ANOVA with Tukey’s post hoc test. Error bars, SEM. *p<0.05. ANOVA, analysis of variance; DC, dendritic cell; PD-1, programmed death 1.
Figure 5
Figure 5. The antitumor immune response elicited by mANK-101, cisplatin, and α-PD-1 triple combination therapy is dependent on an IFN-γ response. Female C57BL/6 mice (8–12 weeks old; n=8–10/group) were implanted with 5×10⁶ MOC1 cells on the right flank on day 0 and were treated as described in figure 1A. (A–B) CD4 (100 µg, i.p.), CD8 (100 µg, i.p.), and NK1.1 (100 μg, i.p.) depleting antibodies were administered on days 6, 7, and 8 and then once weekly thereafter. Tumor growth was monitored. (A) Mean tumor volume and (B) survival are shown. Numbers in parentheses indicate mOS. (C–D) IFN-γ blocking antibody (100 µg, i.p) was administered 2 days prior to treatment, same day as treatment, and 2 days after treatment, then 3×/week thereafter. Tumor growth was monitored. (C) Mean tumor volume over time and (D) survival are shown. Statistical tests: tumor growth: two-way ANOVA with Tukey’s post hoc test; survival: Mantel-Cox test. Error bars, SEM. *p<0.05, **p<0.01, ***p<0.001, ****p<0.0001. ANOVA, analysis of variance; IFN, interferon; i.p., intraperitoneal; mOS, median overall survival; PD-1, programmed death 1.
Figure 6
Figure 6. Combination therapy with mANK-101+cisplatin+α-PD-1 promotes a shift from M2 to M1 in the tumor microenvironment. Female C57BL/6 mice (8–12 weeks old; n=8–10/group) were implanted with 5×10⁶ MOC1 cells on the right flank on day 0 and were treated with mANK-101 (5 µg, i.t.), cisplatin (5 mg/kg, i.p.), and a-PD-1 (200 µg, i.p.). On day 15, sera and tumors were collected and analyzed for (A) MCP-1 expression. Flow cytometric analysis of the tumor was also performed on day 15 to determine the (B) total macrophage populations (CD11b+F4/80+) and (C) M1 (CD11b+F4/80+CD38+CD206) and (D) M2 (CD11b+F4/80+CD38CD206+) frequencies, from which the (E) M1/M2 ratio was calculated. (F) On day 15, RNA analysis was performed on tumor-infiltrating CD45+ cells by NanoString Mouse Myeloid Innate Immunity Panel. Heatmaps showing (F) the top 10 upregulated and downregulated transcripts in the combination group compared with the untreated control based on fold-change and (G) the pathway enrichment analysis based on z-score are presented. (H) C57BL/6 mice (8–12 weeks old; n=8–10/group) were implanted with 5×10⁶ MOC1 cells on the right flank on day 0 and were treated as described in figure 1A. CSFR1 blocking antibody (100 µg, i.p) was administered 2 days prior to treatment, same day as treatment, and 2 days after treatment, then 3 ×/week thereafter. Animal survival was followed. Statistical tests: one-way ANOVA with Tukey’s post hoc test; survival: Mantel-Cox test. Error bars, SEM. *p<0.05. ANOVA, analysis of variance; i.p., intraperitoneal; i.t., intratumoral; MCP, monocyte chemoattractant protein; M1, type 1 macrophage; M2, type 2 macrophage; N/A, not applicable; PD-1, programmed death 1.
Figure 7
Figure 7. Combination therapy with mANK-101+cisplatin+α-PD-1 elicits abscopal responses. Female C57BL/6 mice (8–12 weeks old; n=8/group) were implanted on the right and left flanks with 5×10⁶ MOC1 cells each. The mice were treated as described in figure 1A, with the right flank intratumorally injected with 5 µg mANK-101 and the left flank tumor uninjected. (A) Tumor growth on both flanks was monitored. On day 15, flow cytometric analysis was performed to determine the frequency of (B) CD8+ T cells, (C) p15e tetramer-positive CD8+ T cells, (D) M1 macrophages (CD11b+F4/80+CD38+CD206) and (E) M2 macrophages (CD11b+F4/80+CD38CD206+) in the right and left tumors. (F) Female C57BL/6 mice (8–12 weeks old; n=9–10/group) were implanted with 5×10⁶ MOC1 cells on the right and left flanks on day 0, were treated as described in figure 1A and were also administered with CD8 (100 µg, i.p.) depleting antibodies on days 6, 7, and 8 and then once weekly thereafter. Tumor growth on both flanks were monitored and presented. RNA analysis was performed on tumor-infiltrating CD45+ cells isolated on day 15 via NanoString Mouse PanCancer IO360 and (G) heatmaps representing enriched pathways in the right and left tumors are shown. Statistical tests: tumor growth: two-way or one-way ANOVA with Tukey’s post hoc test; comparison between groups: one-way ANOVA with Tukey’s post hoc test. Error bars, SEM. *p<0.05, **p<0.01, ***p<0.001, ****p<0.0001. ANOVA, analysis of variance; IFN, interferon; i.p., intraperitoneal; M1, type 1 macrophage; M2, type 2 macrophage; PD-1, programmed death 1.

References

    1. Barsouk A, Aluru JS, Rawla P, et al. Epidemiology, Risk Factors, and Prevention of Head and Neck Squamous Cell Carcinoma. Med Sci (Basel) 2023;11 doi: 10.3390/medsci11020042. - DOI - PMC - PubMed
    1. Johnson DE, Burtness B, Leemans CR, et al. Head and neck squamous cell carcinoma. Nat Rev Dis Primers. 2020;6:92. doi: 10.1038/s41572-020-00224-3. - DOI - PMC - PubMed
    1. Solomon B, Young RJ, Rischin D. Head and neck squamous cell carcinoma: Genomics and emerging biomarkers for immunomodulatory cancer treatments. Semin Cancer Biol. 2018;52:228–40. doi: 10.1016/j.semcancer.2018.01.008. - DOI - PubMed
    1. Burtness B, Harrington KJ, Greil R, et al. Pembrolizumab alone or with chemotherapy versus cetuximab with chemotherapy for recurrent or metastatic squamous cell carcinoma of the head and neck (KEYNOTE-048): a randomised, open-label, phase 3 study. Lancet. 2019;394:1915–28. doi: 10.1016/S0140-6736(19)32591-7. - DOI - PubMed
    1. Yu C, Li Q, Zhang Y, et al. Current status and perspective of tumor immunotherapy for head and neck squamous cell carcinoma. Front Cell Dev Biol. 2022;10:941750. doi: 10.3389/fcell.2022.941750. - DOI - PMC - PubMed

MeSH terms