. 2024 Oct 23;12(10):e010148.
doi: 10.1136/jitc-2024-010148.

Targeting CD93 on monocytes revitalizes antitumor immunity by enhancing the function and infiltration of CD8+ T cells

Affiliations

Targeting CD93 on monocytes revitalizes antitumor immunity by enhancing the function and infiltration of CD8+ T cells

Da Jiang et al. J Immunother Cancer. .

Erratum in

Abstract

Background: Limited activation and infiltration of CD8+ T cells are major challenges facing T cell-based immunotherapy for most solid tumors, of which the mechanism is multilayered and not yet fully understood.

Methods: Levels of CD93 expression on monocytes from paired non-tumor, peritumor and tumor tissues of human hepatocellular carcinoma (HCC) were evaluated. The underlying mechanisms mediating effects of CD93+ monocytes on the inhibition and tumor exclusion of CD8+ T cells were studied through both in vitro and in vivo experiments.

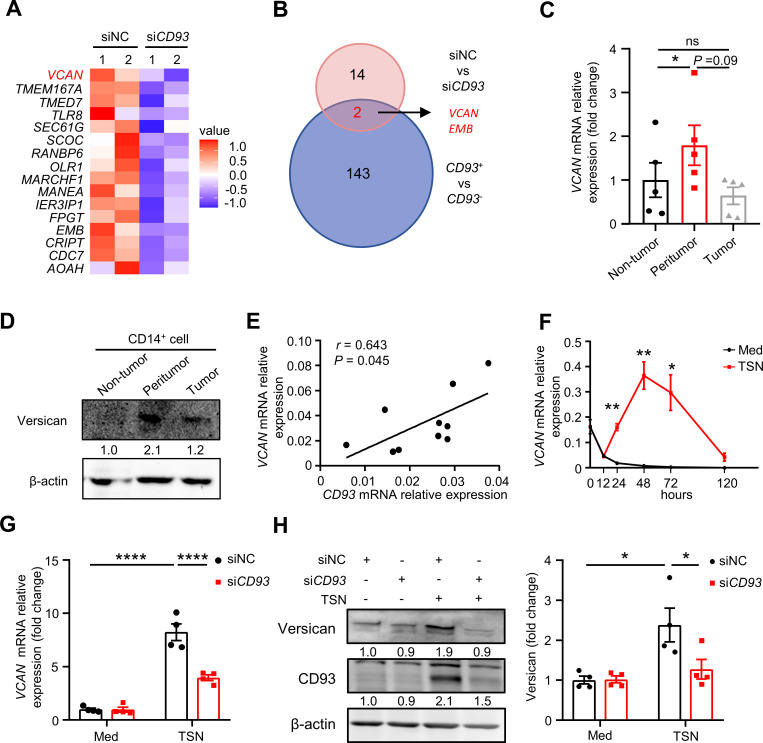
Results: In this study, we found that monocytes in the peritumoral tissues of HCC significantly increased levels of CD93 expression, and these CD93+ monocytes collocated with CD8+ T cells, whose density was much higher in peritumor than intratumor areas. In vitro experiments showed that glycolytic switch mediated tumor-induced CD93 upregulation in monocytes via the Erk signaling pathway. CD93 on the one hand could enhance PD-L1 expression through the AKT-GSK3β axis, while on the other hand inducing monocytes to produce versican, a type of matrix component which interacted with hyaluronan and collagens to inhibit CD8+ T cell migration. Consistently, levels of CD93+ monocytes positively correlated with the density of peritumoral CD8+ T cells while negatively correlated with that of intratumoral CD8+ T cells. Targeting CD93 on monocytes not only increased the infiltration and activation of CD8+ T cells but also enhanced tumor sensitivity to anti-PD-1 treatment in mice in vivo.

Conclusion: This study identified an important mechanism contributing to the activation and limited infiltration of CD8+ T cells in solid tumors, and CD93+ monocytes might represent a plausible immunotherapeutic target for the treatment of HCC.

Keywords: Hepatocellular Carcinoma; Immunotherapy; Macrophage; Monocyte; Tumor microenvironment - TME.


Conflict of interest statement

Competing interests: None declared.

Figures

Figure 1
Figure 1. CD93+ monocytes accumulate in the peritumor of human HCC and indicate worse patient survival. (A) Distribution of CD68+CD93+ cells in HCC tissues was determined by IF staining. Red, CD93; Green, CD68; Light Gray, CD31; Blue, DAPI. Scale bar=50 µm, n=10. B-D, CD14+ monocytes were purified from non-tumor, peritumor, or tumor tissues of HCC. Levels of CD93 expression in/on these cells were analyzed by western blotting (B, n=3), flow cytometry (C, n=4), or Q-PCR (D, n=5). (E) CD93 expression by different cells within HCC tissues was measured using scRNA-seq data from an online database. (F) 99 HCC patients who underwent curative resection with follow-up data were divided into two groups according to the median value of the CD68+ or CD68+CD93+ cell density in peritumoral tissues (CD68+ cells: low, ≤405.7 cells/mm2 (n=49); high, >405.7 cells/mm2 (n=50); CD68+CD93+ cells: low, ≤22.1 cells/mm2 (n=49); high, >22.1 cells/mm2 (n=50)). The overall survival and tumor recurrence of these patients were analyzed via the Kaplan-Meier method and log-rank test. Results shown in A, C and D are expressed as mean±SEM. *p<0.05, **p<0.01. The following statistical analyses were performed: one-way ANOVA (A, C and D), or log-rank test (F and G). ANOVA, analysis of variance; HCC, hepatocellular carcinoma; IF, immunofluorescence.
Figure 2
Figure 2. Glycolytic switch induces CD93 upregulation on monocytes via the Erk signaling pathway. CD14+ cells were purified from the peripheral blood of healthy donors. (A–C) Cells were left untreated (Med) or treated with HepG2 TSN. The kinetics of CD93 expression by these cells were determined via Q-PCR (A, n=3), flow cytometry (B, n=4) and western blotting (C, n=4). (D, E) CD14+ cells were left untreated (Med) or treated with HepG2 TSN for 12 hours (D, n=7) or 24 hours (E, n=3) in the presence or absence of 2DG (20 mM) or 3PO (20 µM). Their expression of CD93 was measured by Q-PCR and flow cytometry. (F, G) Cells were left untreated or treated with HepG2 TSN for 24 hours in the presence or absence of NF-κB inhibitor JSH-23 (10 µM), or STAT3 inhibitor AG490 (10 µM), or JNK inhibitor SP600125 (10 µM), or Erk inhibitor U0126 (25 µM), or p38 inhibitor SB203580 (25 µM). Their levels of CD93 expression were determined by western blotting (F, n=3) or flow cytometry (G, n=4). (H) Cells were left untreated or treated with HepG2 TSN for 30 min in the presence or absence of 2DG (20 mM). Their levels of p-Erk and Erk expression were determined by western blotting. n=3. Results shown in A, B, D, E, G are expressed as mean±SEM. *p<0.05, **p<0.01, ***p<0.001, ****p<0.0001. The following statistical analyses were performed: paired two-tailed Student’s t-test (A, B), one-way ANOVA (D, E), or two-way ANOVA (G). ANOVA, analysis of variance.
Figure 3
Figure 3. CD93 mediates tumor-induced PD-L1 expression on monocytes. (A–E) CD14+ cells were purified from the peripheral blood of healthy donors. Cells were transfected with control siRNA (siNC) or siCD93 before being treated with medium (Med) or HepG2 TSN for 24 hours. Their levels of CD93 (A, n=4), IL-6, IL-1β, TNF-α (B, n=6), HLA-DR, CD86 (C, n=4) were determined by flow cytometry or ELISA. The expression levels of PD-L1 were determined by flow cytometry (D, n=6) and western blotting (E, n=4). (F) Frozen sections of HCC samples were stained with anti-human CD68 antibody (green), anti-human CD93 antibody (red), anti-human PD-L1 antibody (white), and DAPI (blue). The co-localization of cell signals in the peritumoral regions was analyzed by confocal microscopy. Scale bar=50 µm, n=3. G, CD14+ cells were purified from tumor tissues of nine patients with HCC. Correlations between the expression levels of CD93 and PD-L1 in these cells were analyzed via flow cytometry. Results shown in A–E are expressed as mean±SEM. *p<0.05, **p<0.01, ***p<0.001, ****p<0.0001. The following statistical analyses were performed: two-way ANOVA (A–E), or Pearson’s correlation and linear regression analysis (G). ANOVA, analysis of variance; HCC, hepatocellular carcinoma; IF, immunofluorescence.
Figure 4
Figure 4. CD93 increases levels of PD-L1 through the AKT-GSK3β signaling pathway. (A–E) CD14+ cells were purified from the peripheral blood of healthy donors. (A) Cells were transfected with siNC or siCD93, and left untreated or treated with HepG2 TSN for 24 hours. Their levels of CD93, p-GSK3β, GSK3β, p-AKT, AKT, p-p38, p38, p-FAK, and FAK expression were determined by western blotting. n=4. (B–E) Cells were left untreated or treated with HepG2 TSN in the presence or absence of AKTi (5 µM) for 24 hours, or LiCl (20 mM) for 24 hours. Their levels of p-GSK3β, GSK3β, and p-AKT expression were determined by western blotting (B, D), and their PD-L1 expression was analyzed by western blotting (B, D, n=3) and flow cytometry (C, E, n=5). (F, G) CD14+ cells were purified from tumor tissues of nine patients with HCC. Correlations between levels of PD-L1 and p-AKT expression, or PD-L1 and p-GSK3β expression in these cells were analyzed by western blotting. Results shown in (C, E) are expressed as mean±SEM. *p<0.05, **p<0.01, ****p<0.0001. The following statistical analyses were performed: two-way ANOVA (C, E) or Pearson’s correlation and linear regression analysis (F, G). ANOVA, analysis of variance; HCC, hepatocellular carcinoma.
Figure 5
Figure 5. CD93 enhances the production of versican by monocytes. (A) CD14+ cells were purified from the peripheral blood of healthy donors, transfected with siNC or siCD93, and then treated with HepG2 TSN for 24 hours. RNA-seq was performed with these differently-treated cells. The first 16 most downregulated genes in the siCD93 group versus the siNC control were shown. n=2. (B) Online HCC scRNA-seq data analysis revealed 145 genes upregulated in CD93+ versus CD93 macrophages. These genes were compared with the downregulated genes in siCD93-treated versus siNC-treated monocytes from our RNA-seq data, and the two overlapped genes were shown. (C–E) CD14+ monocytes were purified from non-tumor, peritumor, or tumor tissues of HCC. Levels of VCAN expression in these cells were analyzed by Q-PCR (C, n=5) or western blotting (D, n=3). Correlations between the mRNA levels of VCAN and CD93 in these cells were analyzed by Q-PCR (E, n=10). (F) CD14+ cells were purified from the peripheral blood of healthy donors, then left untreated (Med) or treated with HepG2 TSN. The kinetics of VCAN expression by these cells were determined via Q-PCR. n=4. (G, H) CD14+ cells purified from the peripheral blood of healthy donors were transfected with control siRNA (siNC) or siCD93 before being treated with medium (Med) or HepG2 TSN for 24 hours. Their levels of VCAN expression were determined by Q-PCR (G, n=4) and western blotting (H, n=4). Results shown in (C, F, H) are expressed as mean±SEM. *p<0.05, **p<0.01, ****p<0.0001. The following statistical analyses were performed: one-way ANOVA (C), Pearson’s correlation and linear regression analysis (E), paired two-tailed Student’s t-test (F) or two-way ANOVA (G, H). ANOVA, analysis of variance; HCC, hepatocellular carcinoma.
Figure 6
Figure 6. Monocyte-derived versican suppresses the migration of CD8+ T cells. (A) VCAN expression by different cells within HCC tissues was measured using scRNA-seq data from an online database. (B) Distribution of Versican+, CD68+, α-SMA+, and CD8+ cells in HCC tumor tissues was analyzed by IF staining. Scale bar=50 µm, n=4. (C) Correlations between levels of VCAN expression and CD8 infiltration were analyzed using TCGA data. (D) Paraffin-embedded sections of human HCC tissues were stained with anti-human CD93 and anti-CD8 antibodies. The patients were then divided into two groups according to the median value of peritumoral numbers of CD93+ cells. The levels of CD8+ T cells infiltration in peritumoral tissues (right panel) and intratumoral tissues (left panel) were compared between the two groups (CD93Low, n=6; CD93High, n=7). (E, F) CD14+ monocytes and CD8+ T cells were purified from the peripheral blood of healthy donors. Membrane of the 24-well Boyden chamber was coated with collagen I (1 mg/mL) plus hyaluronan (50 µg/mL), in the presence or absence of versican (10 µg/mL) (E), or the CCM or TCM from siNC or siVCAN -treated monocytes (F). CD8+ T cells were added to the upper compartment of the chamber, and their transmembrane migration was measured after 24 hours of incubation. n=4. Results shown in (D–F) were expressed as mean±SEM. *p<0.05, ***p<0.001, ****p<0.0001. The following statistical analyses were performed: Pearson’s correlation and linear regression analysis (C), two-tailed Student’s t-test (D, E) or two-way ANOVA (F). ANOVA, analysis of variance; HCC, hepatocellular carcinoma; IF, immunofluorescence; TCGA, the Cancer Genome Atlas.
Figure 7
Figure 7. Targeting CD93+ monocytes inhibits tumor progression and enhances tumor sensitivity to anti-PD-1 treatment in mice in vivo. (A) C57BL/6 mice with established orthotopic, Luminescence-positive, Hepa1-6 tumors were injected with siNC-containing liposome, or siCD93-containing liposome at indicated times via tail vein. (B, C) Real-time tumor growth and tumor size were monitored. (n=4). (D) Levels of Versican+F4/80+ cells infiltration in peritumoral tissues were measured by IF staining (n=4). (E–G) The infiltration and levels of IFN-γ and TNF-α expression of/by CD8+ T cells were measured on day 16 via flow cytometry (n=4). (H) C57BL/6 mice with established orthotopic, Luminescence-positive, Hepa1-6 tumors were injected with siNC-containing liposome or siCD93-containing liposome via tail vein in the presence or absence of IgG or anti-PD-1 antibodies at indicated times. (I, J) Real-time tumor growth and tumor size were monitored (n=4). (K–M) Tumor infiltration and levels of IFN-γ and TNF-α expression of/by CD8+ T cells were measured on day 16 via flow cytometry (n=4). Results shown in (B, D–G, I, K–M) were expressed as mean±SEM. *p<0.05, **p<0.01, ***p<0.001, ****p<0.0001. The following statistical analyses were performed: one-way ANOVA with Turkey’s correction (D–G, K–M), two-way ANOVA with Turkey’s correction (B, I). ANOVA, analysis of variance; IF, immunofluorescence.

References

    1. Sharma P, Goswami S, Raychaudhuri D, et al. Immune checkpoint therapy-current perspectives and future directions. Cell. 2023;186:1652–69. doi: 10.1016/j.cell.2023.03.006. - DOI - PubMed
    1. Kubli SP, Berger T, Araujo DV, et al. Beyond immune checkpoint blockade: emerging immunological strategies. Nat Rev Drug Discov. 2021;20:899–919. doi: 10.1038/s41573-021-00155-y. - DOI - PubMed
    1. Kennedy PT, Zannoupa D, Son MH, et al. Neuroblastoma: an ongoing cold front for cancer immunotherapy. J Immunother Cancer. 2023;11:e007798. doi: 10.1136/jitc-2023-007798. - DOI - PMC - PubMed
    1. Mempel TR, Lill JK, Altenburger LM. How chemokines organize the tumour microenvironment. Nat Rev Cancer. 2024;24:28–50. doi: 10.1038/s41568-023-00635-w. - DOI - PMC - PubMed
    1. Speiser DE, Ho PC, Verdeil G. Regulatory circuits of T cell function in cancer. Nat Rev Immunol. 2016;16:599–611. doi: 10.1038/nri.2016.80. - DOI - PubMed