. 2024 Oct 24;8(1):e202402917.
doi: 10.26508/lsa.202402917. Print 2025 Jan.

SNX5 promotes antigen presentation in B cells by dual regulation of actin and lysosomal dynamics

Affiliations

SNX5 promotes antigen presentation in B cells by dual regulation of actin and lysosomal dynamics

Fernanda Cabrera-Reyes et al. Life Sci Alliance. .

Abstract

B cells rapidly adapt their endocytic pathway to promote the uptake and processing of extracellular antigens recognized through the B-cell receptor (BCR). The mechanisms coupling changes in endomembrane trafficking to the capacity of B cells to screen for antigens within lymphoid tissues remain unaddressed. We investigated the role of SNX5, a member of the sorting nexin family, which interacts with endocytic membranes to regulate vesicular trafficking and macropinocytosis. Our results show that in steady state, B cells form SNX5-rich protrusions at the plasma membrane, which dissipate upon interaction with soluble antigens, whereas B cells activated with immobilized antigens accumulate SNX5 at the immune synapse where it regulates actin-dependent spreading responses. B cells silenced for SNX5 exhibit enlarged lysosomes, which are not recruited to the synaptic membrane, decreasing their capacity to extract immobilized antigens. Overall, our findings reveal that SNX5 is critical for actin-dependent plasma membrane remodeling in B cells involved in antigen screening and immune synapse formation, as well as endolysosomal trafficking required to promote antigen extraction and presentation.


Conflict of interest statement

The authors declare that they have no conflict of interest.

Figures
Figure 1.
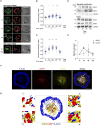
Figure 1.. SNX5 regulates membrane ruffle formation and pinocytosis in B cells.
(A) Visualization of membrane ruffles in B cells under steady-state conditions by transmission electron microscopy. Scale bar: 2 μm. (B) Representative live-cell images via epifluorescence of B cells expressing SNX5-GFP and GFP as a control. Cells were incubated with soluble antigen after 10 min for different time points indicated. Images were acquired every 1 min and show a single plane. Arrows indicate ruffles. Bright-field images are shown at the beginning and end of the acquisition. Scale bar: 3 μm. (C) Representative confocal images of B cells activated with antigen (magenta) and labeled for SNX5 (green). Scale bar: 3 μm. (D) Representative images of Ctrl (siCtrl) or SNX5-silenced B cells using siRNA (siSNX5-B) acquired using differential interference contrast microscopy at various time points. Panels show segmented cells for each condition. Scale bar: 10 μm. (C, E) Quantification of the circularity index of images in (C) for two independent experiments, with n > 25 cells. A t test was conducted. (F) B cells were activated with antigen (blue) and labeled for endolysosomal compartments (LAMP1+, green) and SNX5 (red). A zoomed image of SNX5 (red), LAMP1 (green), and antigen (blue) from regions 1 and 2 delimited by a square is provided. (G) 3D volumetric model reconstructions for LAMP1 endolysosomal compartments containing uptaken antigen and SNX5 at early (10 min) and late time points (60 min). The image shows models for lysosomes (LAMP1, red), antigen (Ag, blue), and SNX5 (green) in activated B cells. The fourth panel shows lysosome models with antigen (LAMP1+Ag, red) and without antigen (LAMP1-Ag, black) volume, and the fifth (rightmost) panel shows LAMP1+Ag with SNX5 (red) and LAMP1-Ag with SNX5 (black). Representative models were selected from one cell. (H) Quantification of the volume percentage of Ag+ and LAMP1+ endolysosomal compartments (relative to the total LAMP1+ compartments) that contain antigens and also express SNX5. Center column: volume of LAMP1+ compartments containing antigen (LAMP1+Ag+) was selected and normalized by the total LAMP1 volume. Right column: volume of LAMP1+Ag compartments that intersected with SNX5 (LAMP1+Ag+SNX5), normalized by the volume of LAMP1 intersected with SNX5 (LAMP1+SNX5+). See the Materials and Methods section.
Figure S1.
Figure S1.. Characterization of SNX5-silenced B Cells.
(A) Silencing of SNX5 in B cells detected by Western blot. (A, B)Relative expression of SNX5 from image shown in (A). One-way ANOVA followed by multiple comparison test under Tukey’s criteria for three independent experiments. (C) Representative images of Ctrl and SNX5-silenced B cells incubated with poly-L-lysine–coated coverslips and stained for F-actin (red). Images are presented as z-projections of a stack (scale bars: 3 μm). (D) Representative images of Ctrl and SNX5-silenced B cells incubated with dextran (10 kD) for 2 h, chased for 4 h, and stained for dextran (red) and LAMP1 (green) (scale bars: 10 μm). (D, E) Quantification of dextran accumulation in LAMP1+ vesicles by Pearson’s coefficient considering each z-stack from immunofluorescence images shown in (D). Source data are available for this figure.
Figure S2.
Figure S2.. Co-localization of SNX5 with early endosomes upon BCR activation with antigen (immunocomplex).
(A) Same image as Fig 1F, showing the Rab5 compartment. B cells were transfected with Rab5-YFP, activated with antigen (blue), and stained for SNX5 (red) (scale bars: 3 μm). A zoom image of SNX5 (red), Rab5-YFP (green), and antigen (blue) from regions 1 and 2 delimited by a square is shown. (B) Quantification of the colocalization of SNX5 with Rab5-YFP by Manders’ coefficient M1 from immunofluorescence images shown in (A). n > 10 cells (C) Quantification of the colocalization of SNX5 with LAMP1 by Manders’ coefficient M1 from immunofluorescence images shown in principal Fig 1E. n > 10 cells.
Figure 2.
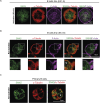
Figure 2.. B-cell receptor (BCR) activation triggers the recruitment of SNX5 to the IS.
(A) Representative confocal images of B cells incubated with beads containing BCR ligand+ or BCR ligand (control beads) for different time points (min). Cells were fixed and labeled for SNX5 (green) and centrosome (α-tubulin, red). White circles and dashed lines indicate bead position and cell boundaries, respectively. White arrows indicate the position of the centrosome. The square on the left at 120 min shows a zoomed view of a bead. The scale bar in the bright field corresponds to 3 μm. (B, C) SNX5 and centrosome (α-tubulin) polarity indexes were calculated from the images in A at the IS for three independent experiments, n > 25 cells. 120 min (−) corresponds to cells incubated with control beads. One-way ANOVA followed by multiple comparison test under Tukey’s criteria, * corresponds to the mean with respect to the control. *0.01 < P < 0.05; **0.001 < P < 0.01; ***P < 0.001. (D) Western blot analysis of synaptic membranes containing BCR-associated protein complexes isolated from B cells stimulated with magnetic beads for indicated times. Exo70, SNX5, and GAPDH were detected in samples. Representative images of two independent experiments. (E) Quantification of SNX5 and Exo70 normalized to input protein levels in total lysates. N = 2. (F) Representative confocal images of B cells incubated with antigen-coated coverslips for 60 min and stained for F-actin (blue), LAMP1+ compartments (red), and SNX5 (yellow). The stack where the immune synapse (IS) is located is shown (scale bars: 10 μm). (G) 3D reconstruction from immunofluorescence images shown in Fig 2F. A zoom image of SNX5 (yellow), LAMP1 (red), and F-actin (blue) from regions 1, 2, 3, and 4 delimited by a square is provided. Source data are available for this figure.
Figure S3.
Figure S3.. Localization of SNX5 with BCR and actin at the B cell synaptic plane.
(A) Localization of SNX5 at the B-cell synaptic plane. B cells were seeded onto antigen-coated coverslips for 60 min and stained for SNX5 (green), B-cell receptor (BCR) (red), and F-actin (magenta). The first row shows the stack where the immune synapse (IS) is located, and the second row shows the central plane of the cell. A zoom image of SNX5, BCR, and F-actin from regions 1, 2, and 3 delimited by a square is shown. (B) Distribution of SNX5 in activated cells. B cells were seeded onto antigen-coated coverslips for 60 min and stained for SNX5 (green), BCR (red), and F-actin (magenta). The first row shows the stack where the IS is located, and the second row onward shows the z-axis in the cell. Arrows indicate tubulations of BCR where SNX5 is located (scale bars: 3 μm).
Figure S4.
Figure S4.. Localization of SNX5 with microtubules at the synaptic plane of activated B cells and in non-activated cells.
(A) Representative confocal images of the localization of SNX5 and microtubules at the B-cell synaptic plane. The B-cell line (IIA1.6) was seeded onto antigen-coated coverslips for 60 min and stained for SNX5 (green), α-tubulin (red), and F-actin (magenta). The image shows a plane of the IS (scale bars: 10 μm). (B) Representative confocal images of the localization of SNX5 and microtubules in the B-cell line (IIA 1.6) in non-activated conditions. Cells were plated on poly-L-lysine–coated slides and stained for SNX5 (green), α-tubulin (red), and F-actin (magenta). Arrows indicate localization of SNX5 at microtubules. The image shows a plane where the centrosome is located (scale bars: 10 μm). (C) Representative confocal images of the localization of SNX5 and microtubules in non-activated primary B cells. Cells were plated on poly-L-lysine–coated slides and stained for SNX5 (green) and α-tubulin (red). Arrows indicate localization of SNX5 at microtubules. The image shows a plane where the centrosome is located (scale bars: 5 μm).
Figure 3.
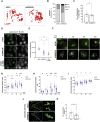
Figure 3.. Lysosomal integrity is compromised in SNX5-silenced B cells, triggering defects in their recruitment at the IS.
(A) 3D volumetric model reconstructions for LAMP1+ endolysosomal compartments of Ctrl (siCtrl) or SNX5-silenced B cells (siSNX5-B). (B) Quantification of the volume of LAMP1+ endolysosomal compartments per cell in 3D reconstructions from two independent experiments, n > 25 cells. Percentage distribution of lysosome volume per cell categorized as <6 μm3, 6–12 μm3, or >12 μm3 is shown. (C) Number of LAMP1+ endolysosomal compartments in Ctrl and SNX5-silenced B cells under steady-state conditions. (D) Immunofluorescence of Ctrl and SNX5-silenced B cells treated with LysoSensor Green. The positive control (Ctrl+) refers to cells treated with 1 mM LLOMe for 60 min (scale bars: 10 μm). (E) Quantification of fluorescence intensity in z-projections of Fig 1D. One-way ANOVA followed by multiple comparison test under Tukey’s criteria; * indicates the mean difference with respect to the control for three independent experiments, with n > 25 cells. Scale bars represent 10 μm. (F) Representative epifluorescence images of Ctrl and SNX5-silenced B cells incubated with antigen-coated beads for different time points, followed by staining for LAMP1+ endolysosomal compartments (green) and centrosome (γ-tubulin). Images are presented as z-projections of a stack. White circles and dashed lines indicate bead position and cell boundaries, respectively. (F, G) LAMP1 polarity indexes were calculated from the images in (F) at the IS (see the Materials and Methods section) for the indicated times. Two-way ANOVA with Sidak’s multiple comparison test was conducted for three independent experiments, with n > 25 cells. * corresponds to the mean with respect to its control. & corresponds to the comparison of the mean between siCtrl and siSNX5-B. &&&& < 0.0001. (H) Quantification of the percentage of LAMP1+ fluorescence around beads. Two-way ANOVA with Sidak’s multiple comparison test was conducted for three independent experiments, with n > 25 cells. * corresponds to the mean with respect to its control. & corresponds to the comparison of the mean between siCtrl and siSNX5-B. &&&& < 0.0001. (F, I) Centrosome polarity indexes calculated from the images in (F) for the indicated times. Two independent experiments, n > 30 cells. Two-way ANOVA with Sidak’s multiple comparison test was conducted. (J) Representative confocal images of Ctrl and SNX5-silenced B cells incubated with antigen-coated coverslips for 60 min and stained for LAMP1 (green). Dashed lines indicate cell boundaries (scale bars: 3 μm). The stack where IS is located is shown. (J, K) Quantification of the number of LAMP1+ compartments at the synaptic interface of images in (J) for three independent experiments, with n > 25 cells. A t test was conducted. * corresponds to the comparison of the mean between siCtrl and siSNX5-B.
Figure 4.
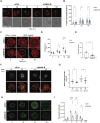
Figure 4.. Actin-dependent B-cell spreading during immune synapse formation is regulated by SNX5.
(A) Representative epifluorescence images of Ctrl and SNX5-silenced B cells incubated with antigen-coated beads for different time points, stained for F-actin (red). Images are presented as z-projections of a stack. White circles indicate bead positions. The scale bar in bright field corresponds to 3 μm. (B) Quantification of the percentage of F-actin fluorescence around the bead. Values were normalized by the initial fluorescence (0 min). Two-way ANOVA with Sidak’s multiple comparison test was conducted for three independent experiments, with n > 25 cells. (C) Representative confocal images of Ctrl and SNX5-silenced B cells seeded onto antigen-coated coverslips for 30 and 60 min and stained for F-actin (red). Non-activated cells were seeded on poly-L-lysine. (D) Quantification of the spreading area of F-actin (μm2) from three independent experiments, with n > 30 cells. Two-way ANOVA with Sidak’s multiple comparison test was performed. * corresponds to the mean with respect to its control. & is the comparison of the mean between siCtrl and siSNX5-B. &&&& < 0.0001. (C, E) Quantification of actin foci in B cells from the experiment shown in (C) at 60 min of activation, for two independent experiments, with n > 25 cells. A t test was conducted. (F) Representative epifluorescence images of Ctrl and SNX5-silenced B cells incubated with antigen-coated beads for 10 and 30 min stained for F-actin (red) and B-cell receptor (green). The stack where the IS is located is shown. (G) Quantification of the B-cell receptor recruitment index to the center of the IS. Two-way ANOVA with Sidak’s multiple comparison test was conducted for two independent experiments, with n > 25 cells. (H) Representative confocal images of Ctrl and SNX5-silenced B cells seeded onto antigen-coated coverslips for 60 min and stained for p-HS1. The stack where the IS is located is shown. Dashed lines indicate cell boundaries (scale bars: 3 μm). (H, I) Quantification of fluorescence intensity of p-HS1 from images in (H). Two-way ANOVA with multiple comparison test under Tukey’s criteria was performed for two independent experiments. * corresponds to the mean with respect to its control. & is the comparison of the mean between siCtrl and siSNX5-B. &&&& < 0.0001.
Figure S5.
Figure S5.. SNX5-silenced B cells display lower ERK signaling upon activation with antigens and no changes in BCR cell surface levels or BCR internalization.
(A) Ctrl and SNX5-silenced B cells were seeded on wells coated with or without antigen for different time points. pErk and Erk levels were evaluated by Western blot. (B) Quantification of pErk normalized to Erk protein levels. N = 2. (C) Internalization rate of B-cell receptor (BCR) in Ctrl and SNX5-silenced B cells. Cells were activated with or without soluble antigen for 0, 5, and 10 min. Surface BCR was labeled under non-permeabilizing conditions, and levels of BCR levels at the cell surface (mean fluorescence intensity) were quantified by flow cytometry. N = 2. (D) Measurement of BCR cell surface levels in Ctrl and SNX5-silenced B cells under steady state. Cells were labeled for BCR under non-permeabilizing conditions, and SNX5 was labeled after permeabilization. Surface BCR and total SNX5 mean fluorescence intensity levels for siCtrl and siSNX5-B were quantified by flow cytometry. N = 3.
Figure 5.
Figure 5.. Impaired antigen extraction in SNX5-silenced B cells.
(A) 3D volumetric model reconstructions for LAMP1 endolysosomal compartments (red) and F-actin (blue) of Ctrl or SNX5-silenced B cells under activation with B-cell receptor ligand+ at 60 min. The stack where the IS is located is shown. (B) Quantification of actin intersection with LAMP1+ endolysosomal compartments at the IS, n > 23 cells. A t non-parametric test (Mann–Whitney U) was conducted. (C) Representative epifluorescence images of Ctrl and SNX5-silenced B cells incubated with antigen-coated beads coupled to OVA protein for different time points. Cells were stained for OVA (red) and LAMP1 (green). Images are presented as z-projections of a stack. White circles indicate bead positions and cell boundaries, respectively. (D) Quantification of the percentage of OVA fluorescence remaining on beads and lysosomes around beads, after incubation with B cells during different time points. Values were normalized by fluorescence at time 0. Two-way ANOVA with Sidak’s multiple comparison test was conducted for three independent experiments, with n > 25 cells. * corresponds to the mean with respect to its control. & corresponds to the comparison of the mean between siCtrl and siSNX5-B. &&&& < 0.0001 (scale bars: 3 μm). (E, F) Antigen presentation assays. (E) Antigen presentation assay with control and SNX5-silenced cells. (F) Peptide control for the cells used. Mean amounts of IL-2 are shown for a representative image of two independent experiments performed in triplicate for control and SNX5-silenced cells. Two-way ANOVA with Sidak’s multiple comparison test was conducted. * corresponds to the mean with respect to its control.
Figure 6.
Figure 6.. Scheme depicting how endolysosomal dynamics and actin-dependent membrane spreading at the IS are regulated by SNX5.
(A) Under resting conditions, SNX5 is mainly localized to ruffles. B-cell receptor engagement enhances its localization to endolysosomal compartments. (B) SNX5-silenced cells decrease membrane ruffle formation and exhibit alteration in lysosome homeostasis (changes in pH and increase in size). (C) B cells undergo spreading upon contact with immobilized antigens, where SNX5 is recruited to the synaptic membrane in close association with the B-cell receptor, endolysosomal compartments, and actin. (D) In the absence of SNX5, there is an impaired recruitment of lysosomes, reduced cell spreading, and actin foci at the IS, leading to decreased antigen uptake and presentation.

References

    1. Harwood NE, Batista FD (2010) Early events in B cell activation. Annu Rev Immunol 28: 185–210. 10.1146/annurev-immunol-030409-101216 - DOI - PubMed
    1. Lanzavecchia A (1985) Antigen-specific interaction between T and B cells. Nature 314: 537–539. 10.1038/314537a0 - DOI - PubMed
    1. Mitchison NA (2004) T-cell–B-cell cooperation. Nat Rev Immunol 4: 308–312. 10.1038/nri1334 - DOI - PubMed
    1. Carrasco YR (2023) Building the synapse engine to drive B lymphocyte function. Immunol Lett 260: 68–72. 10.1016/j.imlet.2023.06.010 - DOI - PubMed
    1. Yuseff MI, Lennon-Dumenil AM (2013) Studying MHC class II presentation of immobilized antigen by B lymphocytes. Methods Mol Biol 960: 529–543. 10.1007/978-1-62703-218-6_39 - DOI - PubMed

LinkOut - more resources