. 2024 Oct 25;81(1):437.
doi: 10.1007/s00018-024-05475-x.

Human TRPV1 is an efficient thermogenetic actuator for chronic neuromodulation

Affiliations

Human TRPV1 is an efficient thermogenetic actuator for chronic neuromodulation

Dmitry I Maltsev et al. Cell Mol Life Sci. .

Abstract

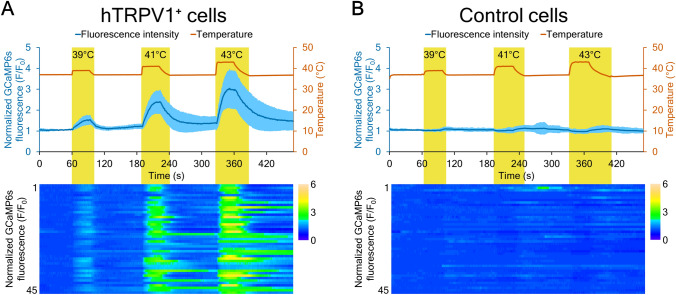
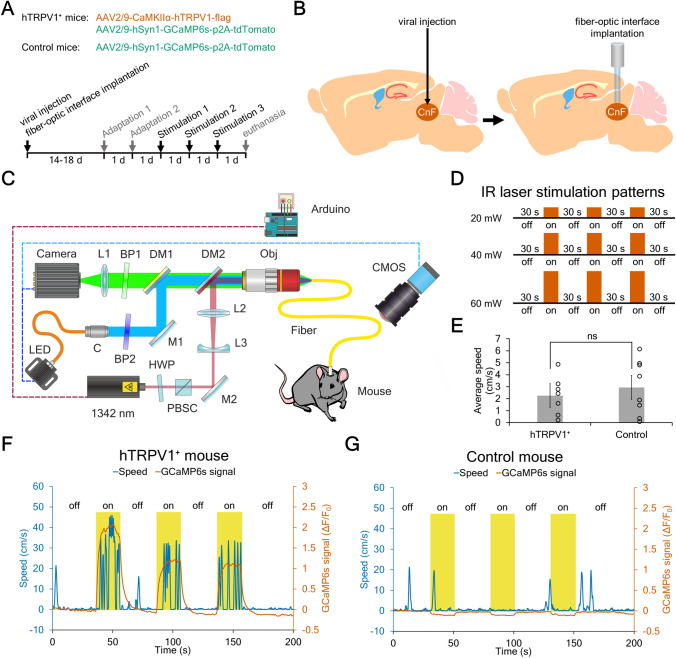
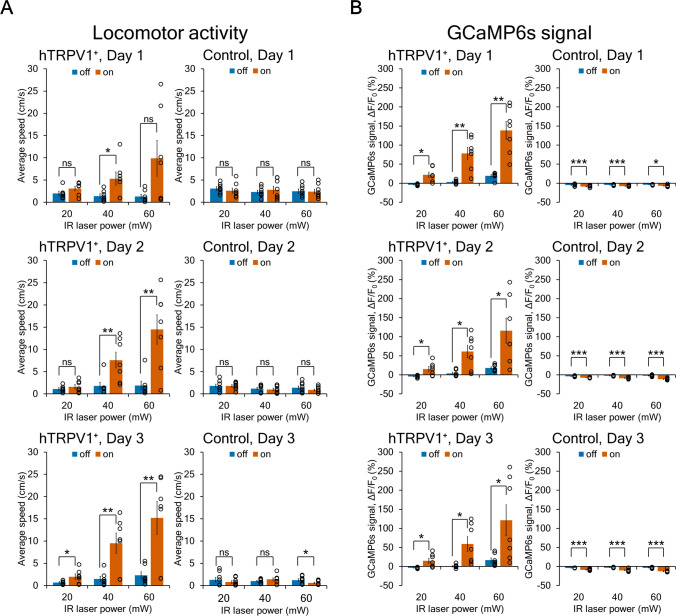
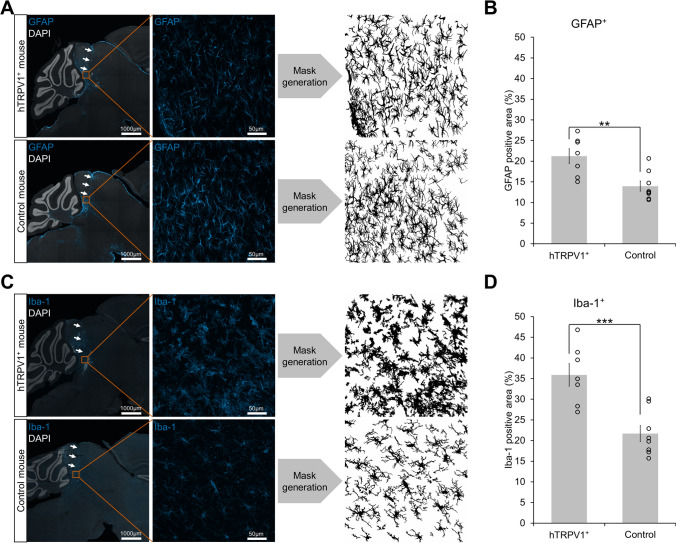
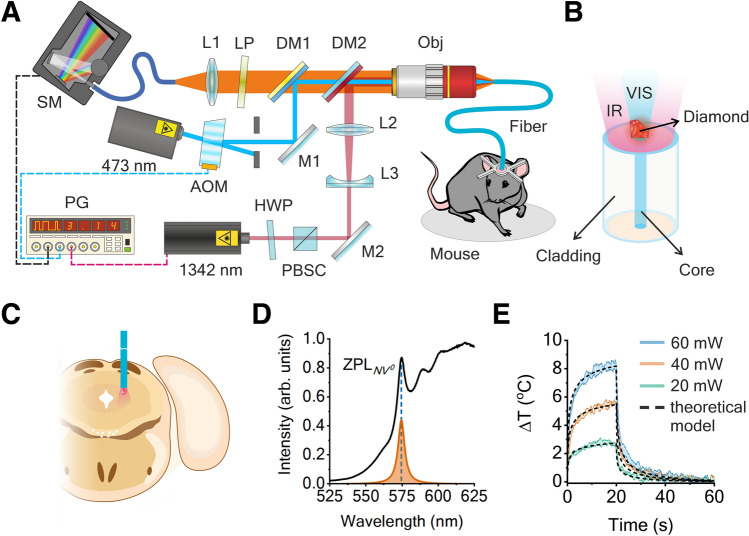
Thermogenetics is a promising neuromodulation technique based on the use of heat-sensitive ion channels. However, on the way to its clinical application, a number of questions have to be addressed. First, to avoid immune response in future human applications, human ion channels should be studied as thermogenetic actuators. Second, heating levels necessary to activate these channels in vivo in brain tissue should be studied and cytotoxicity of these temperatures addressed. Third, the possibility and safety of chronic neuromodulation has to be demonstrated. In this study, we present a comprehensive framework for thermogenetic neuromodulation in vivo using the thermosensitive human ion channel hTRPV1. By targeting hTRPV1 expression to excitatory neurons of the mouse brain and activating them within a non-harmful temperature range with a fiber-coupled infrared laser, we not only induced neuronal firing and stimulated locomotion in mice, but also demonstrated that thermogenetics can be employed for repeated neuromodulation without causing evident brain tissue injury. Our results lay the foundation for the use of thermogenetic neuromodulation in brain research and therapy of neuropathologies.

Keywords: Calcium imaging; Neuromodulation; Neuronal activity; TRP channels; TRPV1; Thermogenetics.


Conflict of interest statement

The authors declare that they have no competing interests.

Figures

Fig. 1
Fig. 1
Quick heating of hTRPV1⁺ HEK293TN cells even below the activation threshold elicits elevations in cytosolic Ca2+. A Changes in the GCaMP6s calcium sensor fluorescence in hTRPV1⁺ cells (N = 45) in response to heating up to 39, 41, and 43 °C from the baseline temperature of 37 °C. B Absence of changes in the GCaMP6s calcium sensor fluorescence in control cells (N = 45) in response to heating up to 39, 41, and 43 °C from the baseline temperature of 37 °C. In A and B the upper graphs show time-courses of the averaged GCaMP6s signal (the Y-axis on the left) and temperature at the imaging site (the Y-axis on the right), and the lower heat-maps demonstrate respective individual cell responses. Yellow stripes indicate periods of time when temperature at the imaging site was above the baseline temperature of 37 °C. Quantitative data are shown as mean ± SD. See also Supplementary Video S1. The heating/temperature control setup and two independent replicates of the same experiment are shown in Suppl. Fig. S1
Fig. 2
Fig. 2
Theromogenetic stimulation of hippocampal CA1 pyramidal cells in acute brain slices. A Viral vector delivery sites in hTRPV1⁺ and control mice. B Experimental setup for the IR-laser-induced heating of cells with concurrent patch-clamp recording and calcium imaging. This setup consists of heating and targeting lasers with the 1375 nm and 520 nm wavelengths, respectively, optics for combining both lasers into the same optical path, an optical fiber with a flat endface, an upright epi-fluorescence microscope, and the equipment for electrophysiological recordings. Mic Obj: microscope objective; PD: photodiode. C Representative images of the same field of view in various modes: fluorescence mode for calcium imaging (left image), transmitted light mode for electrophysiological recordings (middle image), and a mode for visualization of the reflected light from the 520 nm laser spot for targeting the heating 1375 nm laser to a desired site on an acute slice (right image). Scale bar: 50 µm. D and E Intraneuronal calcium changes (upper graphs) (see also Supplementary Video S2), electrophysiological traces (voltage) (middle graphs), and heating patterns (lower graphs) for pyramidal cells in hTRPV1⁺ (D) and control mice (E). All graphs are given on the same time scale. Insets highlighted by dashed lines in the upper graphs show that intracellular calcium elevates in a pyramidal cell of an hTRPV1⁺ mouse (indicated by arrow), but does not increase in a pyramidal cell of a control mouse during IR-laser-induced heating. The initial decline of the GCaMP6s signals in cells of both hTRPV1⁺ and control mice is linked to the well-known effect of the heating-induced decrease in fluorescence of GFP. Heating of target areas in acute brain slices was carried out by 20 s IR laser treatments with 40 s intervals. In each series of thermal stimulation, the IR laser power was sequentially increased by changing the diode current from 0.5 to 1.0 A with a 0.1 A step (lower graphs). The temperatures corresponding to the diode currents applied were determined in a separate calibration experiment (Suppl. Fig. S2A-D). The baseline temperature of slices (the temperature of the ACSF) was 35 °C. F Average elevation of membrane potential (∆Vm) for pyramidal cells of control and hTRPV1⁺ mice dependent on temperatures that are reached during heating steps with variable IR laser power. Average ∆Vm for heating periods was determined after removing APs from electrophysiological traces by frequency filtering. An inset above the histogram shows a representative trace used for calculation of average ∆Vm. Quantitative data are shown as mean ± SEM. Statistics: Welch’s t-test. *p < 0.05, **p < 0.01, ***p < 0.001. hTRPV1⁺: N = 10 cells from 4 mice. Control: N = 10 cells from 3 mice. Details of statistical analysis are shown in Supplementary Table S1. G IR laser stimulation induces generation of APs by pyramidal cells in the hippocampi of hTRPV1⁺ mice but not in the hippocampi of control mice. Numbers of APs were counted for 20 s heating periods when the IR laser was on. Quantitative data are shown as mean ± SEM. H An AP train that elicits a single calcium burst. The electrophysiological trace corresponding to the fragment highlighted by a dashed line in the middle graph of panel (D)
Fig. 3
Fig. 3
Theromogenetic stimulation of neuronal circuits in vivo. A Experimental design. B Targeting the cuneiform nucleus (CnF) with viral intracerebral injections followed by fiber-optic interface implantation. C Experimental setup for simultaneous thermogenetic stimulation using the IR laser and detection of the GCaMP6s calcium sensor signal. Arduino: Arduino controller; BP1 and BP2: bend-pass interference filters; C: multimode collimator; CMOS: videorecorder with CMOS sensor; DM1 and DM2: dichroic mirrors; Fiber: optical fiber; HWP: Zero-Order Half-Wave Plate; L1, L2, and L3: lenses; LED: light-emitting diode with the wavelength of 470 nm; M1 and M2: broadband dielectric mirrors; Obj: objective; PBSC: polarizing beamsplitter cube. D IR-laser stimulation patterns. Heating periods when the IR laser was on were commonly 20 s. If a mouse ran to too fast, the IR laser was switched off earlier than the 20-s period over. E The average speed of mice within the 30 s period prior to the first application of the heating IR laser on the first day of thermal stimulation. Quantitative data are shown as mean ± SEM. Statistics: Student’s t-test. p = 0.5198. t = 0.6616. F = 2.066. hTRPV1⁺: N = 7 mice. Control: N = 8 mice. ns: not significant. F and G Thermogenetic stimulation of excitatory neurons in CnF evokes locomotion and elevates the GCaMP6s signal in hTRPV1⁺ mice (F), but not in control mice (G). IR laser power was 40 mW. Graphs indicate representative curves of motion speed (blue) and integral intensity of the GCaMP6s signal (vermillion) in hTRPV1⁺ and control mice during periods when the IR-laser was on or off (yellow). See also Supplementary Video S3
Fig. 4
Fig. 4
Thermal stimulation increases running speed and elevates GCaMP6s signal in hTRPV1+ mice but not in control mice. A Average speed of hTRPV1+ and control mice during periods when the IR laser was on or off, on stimulation days 1, 2, and 3. B Average integral GCaMP6s signal in the CnF of hTRPV1+ and control mice during periods when the IR laser was on or off, on stimulation days 1, 2, and 3. Expression of hTRPV1 was confirmed by immunohistochemical staining (Suppl. Fig. S5) Quantitative data are shown as mean ± SEM. Statistics: paired t-test. *p < 0.05, **p < 0.01, ***p < 0.001. hTRPV1⁺: N = 7 mice. Control: N = 8 mice. Details of statistical analysis are shown in Supplementary Tables S2 and S3
Fig. 5
Fig. 5
Repeated theromogenetic neuromodulation is accompanied by activation of astrocytes and microglial cells. A GFAP immunopositive cells underneath the track (arrows) in hTRPV1+ and control mice (maximal projections). B GFAP positive area underneath the track in hTRPV1+ and control mice. C Iba-1 immunopositive cells underneath the track (arrows) in hTRPV1+ and control mice (maximal projections). D Iba-1 positive area underneath the track in hTRPV1+ and control mice. Quantitative data are shown as mean ± SEM. Statistics: Student’s t-test. B p = 0.0047. t = 3.407. F = 1.793. D p = 0.0008. t = 4.359. F = 1.705. *p < 0.05, **p < 0.01, ***p < 0.001. hTRPV1+: N = 7 mice. Control: N = 8 mice. Confocal images were acquired with the same settings for both hTRPV1+ and control mice
Fig. 6
Fig. 6
Thermal stimulation increases the number of c-Fos positive cells in the CnF of hTRPV1+ mice. A Experimental design. B Average speed of hTRPV1+ and control mice during periods when the IR laser was on or off. Statistics: paired t-test. hTRPV1+ mice: p = 0.1698. t = 1.839. Control mice: p = 0.6462. t = 0.4955. C Average integral GCaMP6s signal in the CnF of hTRPV1+ and control mice during periods when the IR laser was on or off. Statistics: paired t-test. hTRPV1+ mice: p = 0.0395. t = 3.012. Control mice: p = 0.0236. t = 3.562. D Representative images of sites of thermal stimulation in the brains of hTRPV1+ and control mice. Brain slices were co-stained for revealing hTRPV1 (anti-FLAG antibody), GCaMP6s (anti-GFP antibody), and c-Fos (anti-c-Fos antibody). Scale bars: 1000 µm. E Representative images of c-Fos immunopositive cells underneath sites of fiber-optic implantation in the brains of hTRPV1+ and control mice. Scale bars: 100 µm. F Numbers of c-Fos immunopositive cells in the CnFs of ipsi- and contralateral hemispheres of hTRPV1+ and control mice. Statistics: Kruskal–Wallis test with Dunn’s post hoc test. p = 0.0154. KW = 10.406. *p < 0.05, **p < 0.01, ***p < 0.001. Confocal images were acquired with the same settings for both hTRPV1+ and control mice. G Representative images illustrating co-localization of c-Fos with hTRPV1 in neurons at the site underneath the track of the fiber-optic interface. Vermilion arrows indicate c-Fos⁺/FLAG⁺ double positive neurons. Green arrows indicate FLAG⁺ positive neurons without co-labeling with antibodies against c-Fos. Scale bar: 100 µm. H Percentages of c-Fos⁺/FLAG⁺ double positive cells among total FLAG+ or c-Fos+ neuronal populations. hTRPV1+: N = 5 mice. Control: N = 5 mice. Quantitative data are shown as mean ± SEM
Fig. 7
Fig. 7
Thermometry in vivo. A Experimental setup for simultaneous IR laser treatment and acquiring photoluminescence readout from negatively charged nitrogen vacancy (NV0) color centers in diamond. AOM: acousto-optic modulator; DM1 and DM2: dichroic mirrors; Fiber: dual cladding optical fiber; HWP: Zero-Order Half-Wave Plate; L1, L2, and L3: spherical lenses; LP: low pass filter; M1 and M2: broadband dielectric mirrors; Obj: objective; PBSC: polarizing beamsplitter cube; PG: pulse generator; SM: spectrometer. B A dual core optical fiber with an NV0 vacancy-containing diamond attached to its endface. IR: infrared irradiation, VIS: visible light. C A dual core optical fiber was inserted slightly above the CnF. D Experimental spectrum and its approximation for determining the position of the zero-phonon line ZPLNV⁰. E Temperature kinetics at the tip of the optical fiber upon IR laser treatments with laser power of 20 (green line), 40 (vermilion line), and 60 (blue line) mW over 20 s. Temperature kinetics curves given as ∆T (°C) were determined experimentally (N = 3 mice, solid lines) and theoretically (dashed black lines). Quantitative data are shown as mean ± SEM

References

    1. Boyden ES, Zhang F, Bamberg E et al (2005) Millisecond-timescale, genetically targeted optical control of neural activity. Nat Neurosci 8:1263–1268. 10.1038/nn1525 - PubMed
    1. Deisseroth K (2015) Optogenetics: 10 years of microbial opsins in neuroscience. Nat Neurosci 18:1213–1225. 10.1038/nn.4091 - PMC - PubMed
    1. Emiliani V, Entcheva E, Hedrich R et al (2022) Optogenetics for light control of biological systems. Nat Rev Methods Primers 2:55. 10.1038/s43586-022-00136-4 - PMC - PubMed
    1. Zhang F, Wang L-P, Brauner M et al (2007) Multimodal fast optical interrogation of neural circuitry. Nature 446:633–639. 10.1038/nature05744 - PubMed
    1. Alexander GM, Rogan SC, Abbas AI et al (2009) Remote control of neuronal activity in transgenic mice expressing evolved G protein-coupled receptors. Neuron 63:27–39. 10.1016/j.neuron.2009.06.014 - PMC - PubMed

LinkOut - more resources