

A comment on the Revised Diffusion Model for Conflict tasks (RDMC)
- PMID: 39448516
- PMCID: PMC12000171
- DOI: 10.3758/s13423-024-02574-5
A comment on the Revised Diffusion Model for Conflict tasks (RDMC)
Abstract
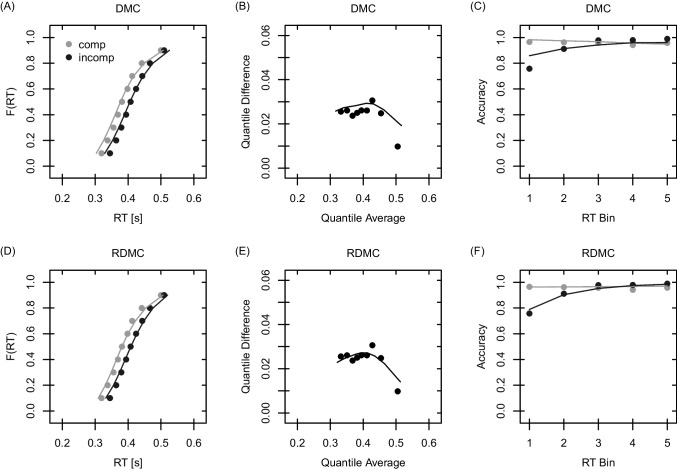
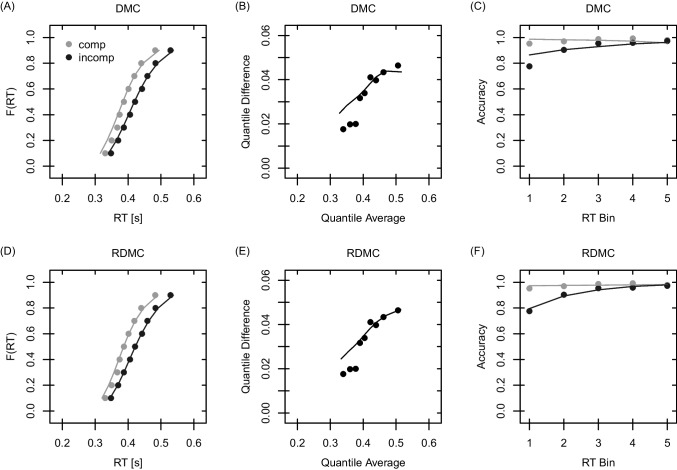
In conflict tasks, such as the Simon, Eriksen flanker, or Stroop task, a relevant and an irrelevant feature indicate the same or different responses in congruent and incongruent trials, respectively. The congruency effect refers to faster and less error-prone responses in congruent relative to incongruent trials. Distributional analyses reveal that the congruency effect in the Simon task becomes smaller with increasing RTs, reflected by a negative-going delta function. In contrast, for other tasks, the delta function is typically positive-going, meaning that congruency effects become larger with increasing RTs. The Diffusion Model for Conflict tasks (DMC; Ulrich et al., Cognitive Psychology, 78, 148-174, 2015) accounts for this by explicitly modeling the information accumulated from the relevant and the irrelevant features and attributes negatively- versus positively-sloped delta functions to different peak times of a pulse-like activation resulting from the task-irrelevant feature. Because the underlying function implies negative drift rates, Lee and Sewell (Psychonomic Bulletin & Review, 31(5), 1-31, 2024) recently questioned this assumption and suggested their Revised Diffusion Model for Conflict tasks (RDMC). We address three issues regarding RDMC compared to DMC: (1) The pulse-like function is not as implausible as Lee and Sewell suggest. (2) RDMC itself comes with a questionable assumption that different parameters are required for congruent and incongruent trials. (3) Moreover, we present data from a new parameter recovery study, suggesting that RDMC lacks acceptable recovery of several parameters (in particular compared to DMC). In this light, we discuss RDMC as not (yet) a revised version of DMC.
Keywords: Decay; Diffusion Model for Conflict tasks; Diffusion model; Inhibition; Parameter recovery.
© 2024. The Author(s).
Conflict of interest statement
Declarations. Conflicts of interest/Competing interests: The authors have no relevant financial or non-financial interests to disclose.
Figures

Similar articles
-
A revised diffusion model for conflict tasks.Psychon Bull Rev. 2024 Feb;31(1):1-31. doi: 10.3758/s13423-023-02288-0. Epub 2023 Jun 12. Psychon Bull Rev. 2024. PMID: 37507646 Free PMC article. Review.
-
The role of task-relevant and task-irrelevant information in congruency sequence effects: Applying the diffusion model for conflict tasks.Cogn Psychol. 2023 Feb;140:101528. doi: 10.1016/j.cogpsych.2022.101528. Epub 2022 Dec 28. Cogn Psychol. 2023. PMID: 36584549
-
A diffusion model for the congruency sequence effect.Psychon Bull Rev. 2022 Dec;29(6):2034-2051. doi: 10.3758/s13423-022-02119-8. Epub 2022 Jun 8. Psychon Bull Rev. 2022. PMID: 35676612 Review.
-
Automatic and controlled stimulus processing in conflict tasks: Superimposed diffusion processes and delta functions.Cogn Psychol. 2015 May;78:148-74. doi: 10.1016/j.cogpsych.2015.02.005. Epub 2015 Apr 22. Cogn Psychol. 2015. PMID: 25909766
-
Conflict resolution in the Eriksen flanker task: Similarities and differences to the Simon task.PLoS One. 2019 Mar 28;14(3):e0214203. doi: 10.1371/journal.pone.0214203. eCollection 2019. PLoS One. 2019. PMID: 30921368 Free PMC article. Clinical Trial.
References
-
- Anderson, M. C. (2003). Rethinking interference theory: Executive control and the mechanisms of forgetting. Journal of Memory and Language,49(5), 415–445.
-
- Anderson, M. C., Bjork, R. A., & Bjork, E. L. (1994). Remembering can cause forgetting: Retrieval dynamics in long-term memory. Journal of Experimental Psychology: Learning, Memory, and Cognition,20(5), 1063–1087. - PubMed
-
- Ardia, D., Boudt, K., Carl, P., Mullen, K. M., & Peterson, B. G. (2011). Differential Evolution with DEoptim. The R Journal,3(1), 27–34. 10.32614/RJ-2011-005
-
- Bäuml, K.-H., Pastötter, B., & Hanslmayr, S. (2010). Binding and inhibition in episodic memory–cognitive, emotional, and neural processes. Neuroscience and Biobehavioral Reviews,34, 1047–1054. 10.1016/j.neubiorev.2009.04.005 - PubMed
-
- Botvinick, M. M., Braver, T. S., Barch, D. M., Carter, C. S., & Cohen, J. D. (2001). Conflict monitoring and cognitive control. Psychological Review,108(3), 624–652. 10.1037/0033-295X.108.3.624 - PubMed
Publication types
MeSH terms
Grants and funding
LinkOut - more resources
Full Text Sources
