. 2024 Oct 24;15(1):9095.
doi: 10.1038/s41467-024-53217-1.

Interaction between subventricular zone microglia and neural stem cells impacts the neurogenic response in a mouse model of cortical ischemic stroke

Affiliations

Interaction between subventricular zone microglia and neural stem cells impacts the neurogenic response in a mouse model of cortical ischemic stroke

Suvra Nath et al. Nat Commun. .

Abstract

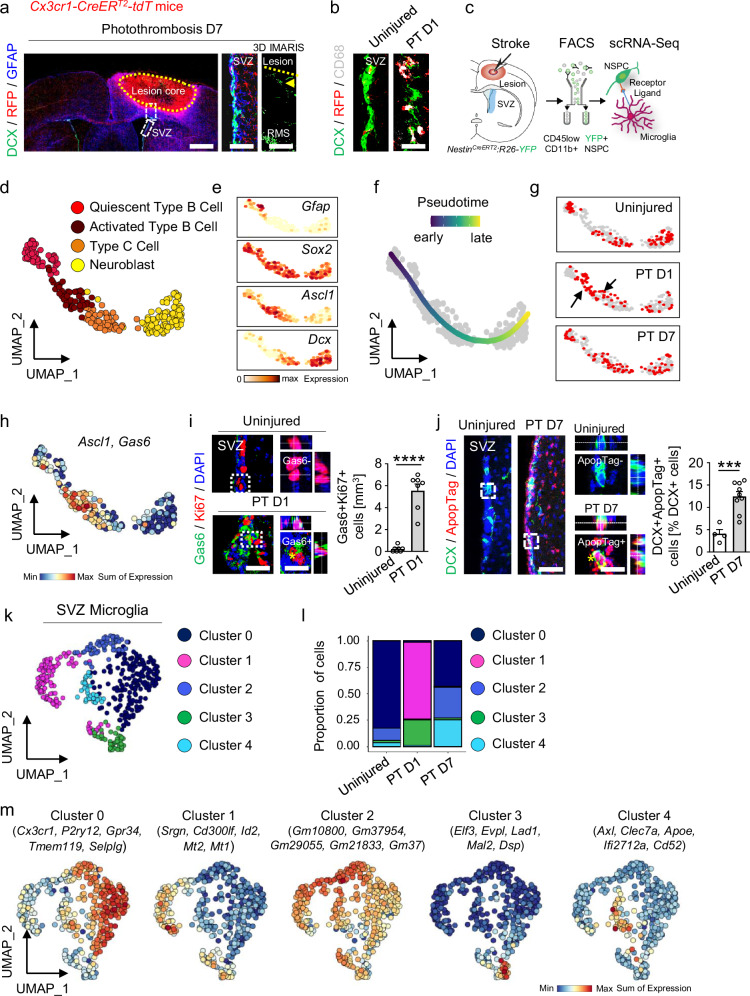
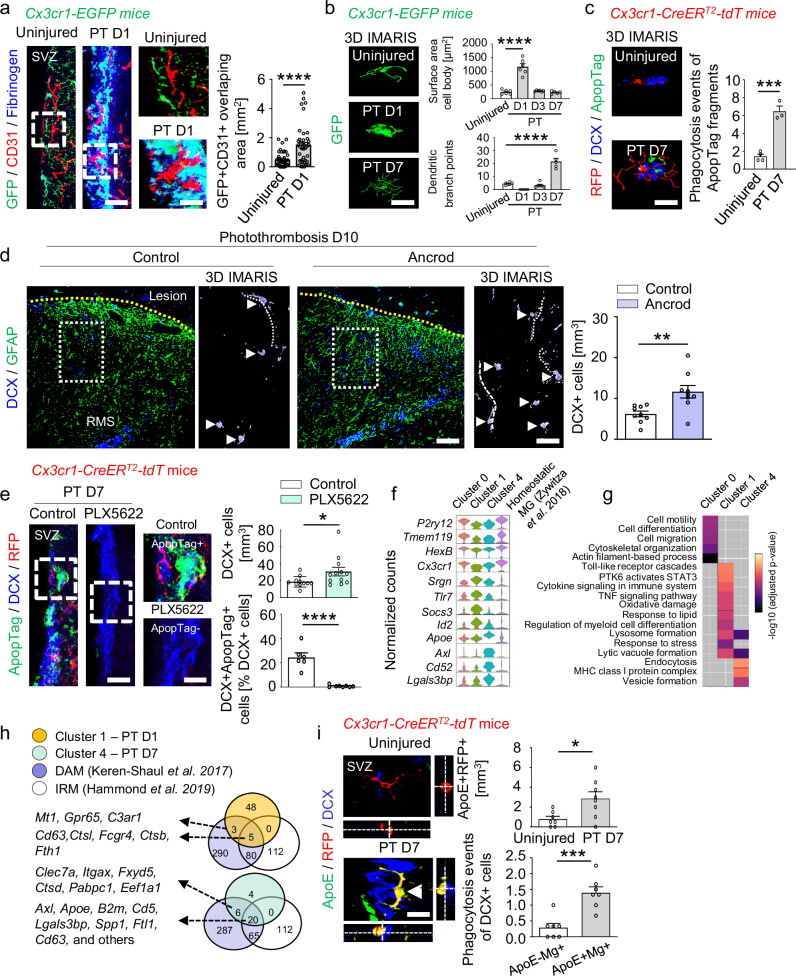
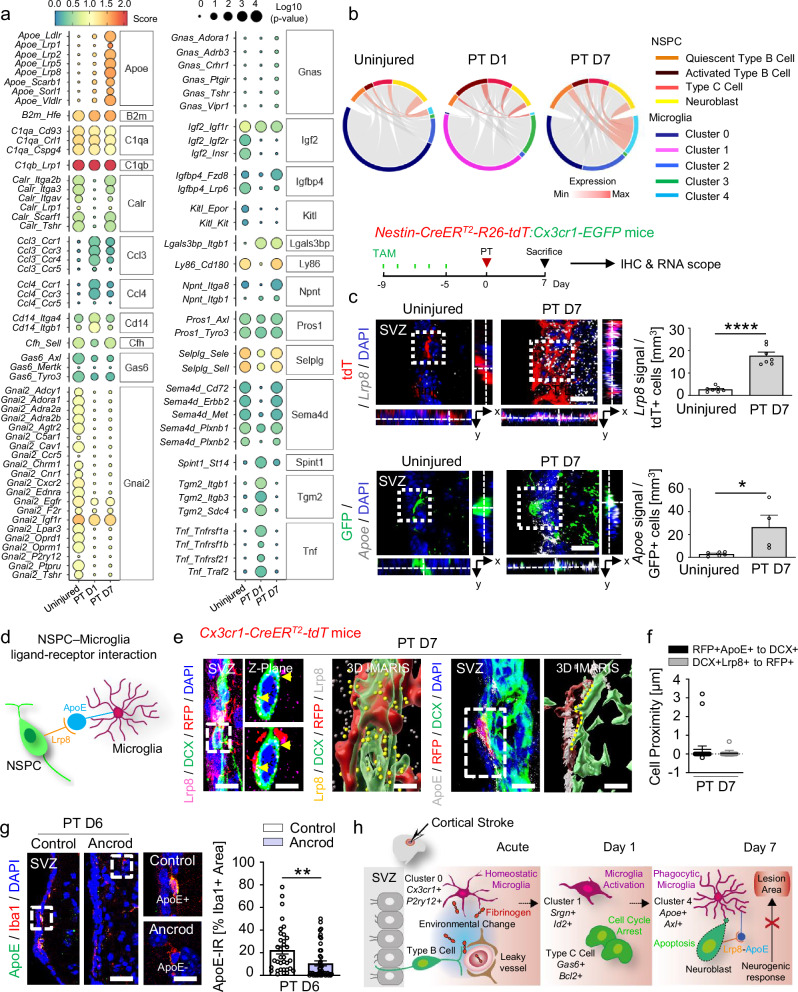
After a stroke, the neurogenic response from the subventricular zone (SVZ) to repair the brain is limited. Microglia, as an integral part of the distinctive SVZ microenvironment, control neural stem / precursor cell (NSPC) behavior. Here, we show that discrete stroke-associated SVZ microglial clusters negatively impact the innate neurogenic response, and we propose a repository of relevant microglia-NSPC ligand-receptor pairs. After photothrombosis, a mouse model of ischemic stroke, the altered SVZ niche environment leads to immediate activation of microglia in the niche and an abnormal neurogenic response, with cell-cycle arrest of neural stem cells and neuroblast cell death. Pharmacological restoration of the niche environment increases the SVZ-derived neurogenic repair and microglial depletion increases the formation and survival of newborn neuroblasts in the SVZ. Therefore, we propose that altered cross-communication between microglial subclusters and NSPCs regulates the extent of the innate neurogenic repair response in the SVZ after stroke.


Conflict of interest statement

The authors declare no competing interests.

Figures

Fig. 1
Fig. 1. SVZ neuroblast cell death and distinct SVZ microglial subclusters after cortical stroke.
a DCX immunostaining (green) in combination with RFP (red) and GFAP (blue) labeling in the SVZ and the lesion penumbra 7 days after PT. White boxes indicate enlarged areas showing the SVZ showing DCX and RFP expression, and IMARIS reconstruction of the lesion penumbra, with few DCX + migratory neuroblasts (arrowhead) (n = 1). The lesion core is indicated by a dotted line. Scales (l to r): 750, 100, 260 µm. b DCX immunostaining (green) with RFP (red) and CD68 (gray) labeling in the SVZ 1 day after PT, indicating early SVZ microglia activation after cortical stroke (n = 1). Scale, 15 µm. c scRNA-Seq and analysis of SVZ NSPCs and microglia after PT. d UMAP representation of four NSPC clusters from Supplementary Fig. 1i. e NSPC cluster-specific gene expression defining their localization along the UMAP of Supplementary Fig. 1i. f UMAP visualization of fate-mapped NSPCs captures differentiation from quiescent type B cells to neuroblasts after PT. g Pseudotime progression along the NSPC differentiation trajectory after PT. Black arrows indicate type B cell activation and differentiation at day 1 after PT. h Ascl1 + proliferative type C cells co-express Gas6 after PT. i Immunolabeling for Gas6 (green) and Ki67 (red) in the SVZ 1 day after PT. Dashed boxes indicate magnifications of Gas6 − Ki67 + (top) and Gas6 + Ki67 + cells (bottom, asterisk). Scales, 24(left), 13 µm (magnified images). Right, quantification (n  =  7 mice). j Immunolabeling for DCX (green) and ApopTag (red) in the SVZ 7 days after PT. Dashed boxes indicate magnifications of ApopTag−DCX + (top) and ApopTag + DCX + cells (bottom, asterisk) of control and 7 days after PT, respectively. Scales, 50 (left), 16 µm (magnified images). Right, quantification (n  =  4 mice, uninjured; n = 9 mice, PT D7). k UMAP representation of five distinct microglial clusters obtained after subcluster analysis of the identified microglial cluster in Supplementary Fig. 1i. l Quantification of microglial cluster proportions. m UMAP plots of expression of core signature genes of SVZ microglial cluster. All graphs show the mean ± SEM. ***P < 0.001, ****P < 0.0001, unpaired Student’s t tests. RMS, rostral migratory stream; SVZ, subventricular zone. Source data are provided as a Source Data file.
Fig. 2
Fig. 2. Stroke-associated microglia phagocytose dying neuroblasts and reduce the SVZ neurogenic response.
a Immunolabeling for GFP (microglia, green), CD31 (blood vessels, red), and fibrinogen (blue) 1 day after PT. Scales, 18 (left), 10 µm (magnified images). Quantification of overlap between GFP + microglia and CD31 + blood vessels 1 day after PT (n = 3 mice; 46 cells, uninjured; 40 cells, PT D1). b Reconstructions of microglia (green) and IMARIS quantification of GFP + microglia 1, 3, and 7 days after PT (n  =  6 mice, uninjured, PT D1, PT D3; n = 5 mice, PT D7). Scale, 7 μm. c IMARIS reconstruction of DCX + ApopTag + dying neuroblasts engulfed by RFP + microglia (red) 7 days after PT (bottom). Scale, 7 μm. Quantification of ApopTag + fragments in RFP+ microglia in the SVZ (n  =  4 mice, uninjured; n  =  3 mice, PT D7). d Immunolabeling for DCX (blue) and GFAP (green) in the lesion penumbra 10 days after PT. Dotted rectangles indicate magnified images. Arrowheads indicate individual DCX + cells, and dotted lines indicate DCX + processes. Scales, 130 (left), 63 µm, (magnified images). Right, quantification 10 days after PT (n = 9 mice). e Immunolabeling for ApopTag (green), DCX (blue), and RFP (red) in the SVZ 7 days after PT in PLX5622-fed mice. Dashed rectangles indicate magnified images showing ApopTag + DCX + (top) and ApopTag−DCX + cells (bottom). Scales, 38 (left), 7 μm (magnified images). Quantification of DCX + cells (top) and percentage of ApopTag + DCX + cells (bottom) 7 days after PT in PLX5622-fed mice (top: n = 11, control; n = 12, PLX5622; bottom: n  =  6, control, n = 8, PLX5622). f Violin plots of markers enriched in stroke-associated microglial clusters 1 and 4, compared with cluster 0 and ref.. g Gene ontology term enrichment analysis (adjusted p-value < 0.05) using the same clusters. Gray boxes indicate no enrichment. h Venn diagram showing the overlap between genes of neurodegenerative disease–associated microglia (purple, disease-associated microglia (DAM); and white, injury-responsive microglia (IRM)) and DEGs 1 (orange) and 7 days (green) after PT. i Immunolabeling for ApoE (green), RFP (red), and DCX (blue), 7 days after PT. Arrowhead indicates ApoE + RFP + microglia phagocytosing a DCX + neuroblast. Scale, 14 μm. Quantification in uninjured mice and 7 days after PT (top) (n  =  7 mice, uninjured; n  =  8 mice, PT D7) and of DCX + cells engulfed by microglia (Mg, bottom) (n  =  7 mice) in the SVZ 7 days after PT. All plots show mean ± SEM. *P < 0.05, **P < 0.01, ***P < 0.001, ****P < 0.0001, one-way ANOVAs with Bonferroni corrections for multiple comparisons (b) and unpaired Student’s t tests (a, ce, i). RMS, rostral migratory stream; SVZ, subventricular zone. Source data are provided as a Source Data file.
Fig. 3
Fig. 3. Ligand-receptor pair interactions between NSPCs and microglia after cortical stroke.
a Dot plot of interaction scores for ligand-receptor pairs and operating signaling pathways 1 and 7 days after PT. b Chord plot of ApoE-Lrp8 ligand-receptor interactions across clusters and NSPC subpopulations within the consensus atlas, based on co-expression 1 and 7 days after PT. c In situ hybridization for Lrp8 (gray) with immunolabeling for RFP + NSPCs (red) in the SVZ 7 days after PT. Scale bar, 12 μm. Quantification of Lrp8 + RFP + cells 7 days after PT (n  =  7 mice). In situ hybridization for Apoe (gray) with immunolabeling for GFP + microglia (green) in the SVZ 7 days after PT. Scale, 12 μm. Quantification of Apoe + GFP + cells 7 days after PT (n  =  6, uninjured; n = 4, PT D7). d Schematic of the NSPC-microglia Lrp8-ApoE cross-communication. e Left images: Immunolabeling for Lrp8, DCX, and RFP in the SVZ 7 days after PT. Higher magnification of dashed square showing Z-plane with (bottom) and without (top) RFP illustrating the location of Lrp8 (arrowheads) on DCX + cells in close contact with RFP + cells. IMARIS reconstruction of Lrp8, DCX, and RFP. DCX + cell surface expression of LRP8 (yellow dots) in contact with RFP + cells. Right pair of images: Immunolabeling for ApoE, RFP, and DCX 7 days after PT. IMARIS reconstruction of the ApoE + RFP + cell in the dashed rectangle in contact with a DCX + cell. The area of contact between the RFP + and DCX + cells is indicated by the yellow dashed line. Scales, 12 µm (SVZ, Lrp8); 6 μm, magnified images; 3 μm, 3-D IMARIS; 8 μm (SVZ, ApoE); 6 μm, 3-D IMARIS. f Quantification of the smallest distance between RFP + ApoE + cells and DCX + cells and between DCX + Lrp8 + cells and RFP + cells 7 days after PT (n = 3 mice; 23 pairs of cells, RFP + ApoE + cells to DCX + cells; 18 pairs of cells, DCX + Lrp8 + to RFP + cells). g Immunolabeling for ApoE and Iba1 in fibrinogen-depleted mice 6 days after PT. Dashed boxes indicate the magnification of ApoE + Iba1 + (top, control) and ApoE−Iba1 + cells (bottom, ancrod) 6 days after PT. Scales, 28 µm, left; 10 µm, magnified images. Right, quantification of the ApoE immunoreactivity (IR) in Iba1 + cells in fibrinogen-depleted mice compared with control-treated mice 6 days after PT (n = 6 mice, control group (34 cells); n = 5 mice, ancrod group (44 cells)). Plots show mean ± SEM. *P < 0.05, **P < 0.01, ****P < 0.0001, unpaired Student’s t tests. h In the healthy brain, NSPCs of the SVZ generate mobile DCX + neuroblasts that migrate through the RMS to the olfactory bulb to become newborn neurons. Cortical injury (cortical stroke, acute) results in increased permeability of the SVZ vasculature and a drastic change in the SVZ stem cell niche environment (e.g., fibrinogen deposition). This induces increased NSPC proliferation, cell-cycle arrest of type C cells, and immediate microglial activation (cortical stroke, day 1 after PT). Microglia phagocytose apoptotic newborn neuroblasts through the predicted ligand-receptor pair ApoE–Lrp8, resulting in limited neurogenic cell replacement in the cortical lesion area (cortical stroke, day 7 after PT). SVZ, subventricular zone. Source data are provided as a Source Data file.

References

    1. Alvarez-Buylla, A. & Garcia-Verdugo, J. M. Neurogenesis in adult subventricular zone. J. Neurosci.22, 629–634 (2002). - PMC - PubMed
    1. Doetsch, F. A niche for adult neural stem cells. Curr. Opin. Genet. Dev.13, 543–550 (2003). - PubMed
    1. Lois, C. & Alvarez-Buylla, A. Long-distance neuronal migration in the adult mammalian brain. Science264, 1145–1148 (1994). - PubMed
    1. Thored, P. et al. Persistent production of neurons from adult brain stem cells during recovery after stroke. Stem Cells24, 739–747 (2006). - PubMed
    1. Arvidsson, A., Collin, T., Kirik, D., Kokaia, Z. & Lindvall, O. Neuronal replacement from endogenous precursors in the adult brain after stroke. Nat. Med.8, 963–970 (2002). - PubMed

Publication types

Associated data