. 2024 Oct 24;15(1):9166.
doi: 10.1038/s41467-024-53153-0.

Precise genetic control of ATOH1 enhances maturation of regenerated hair cells in the mature mouse utricle

Affiliations

Precise genetic control of ATOH1 enhances maturation of regenerated hair cells in the mature mouse utricle

Tian Wang et al. Nat Commun. .

Abstract

Vestibular hair cells are mechanoreceptors critical for detecting head position and motion. In mammals, hair cell loss causes vestibular dysfunction as spontaneous regeneration is nearly absent. Constitutive expression of exogenous ATOH1, a hair cell transcription factor, increases hair cell regeneration, however, these cells fail to fully mature. Here, we profiled mouse utricles at 14 time points, and defined transcriptomes of developing and mature vestibular hair cells. To mimic native hair cells which downregulate endogenous ATOH1 as they mature, we engineered viral vectors carrying the supporting cell promoters GFAP and RLBP1. In utricles damaged ex vivo, both CMV-ATOH1 and GFAP-ATOH1 increased regeneration more effectively than RLBP1-ATOH1, while GFAP-ATOH1 and RLBP1-ATOH1 induced hair cells with more mature transcriptomes. In utricles damaged in vivo, GFAP-ATOH1 induced regeneration of hair cells expressing genes indicative of maturing type II hair cells, and more hair cells with bundles and synapses than untreated organs. Together our results demonstrate the efficacy of spatiotemporal control of ATOH1 overexpression in inner ear hair cell regeneration.


Conflict of interest statement

T.Y., A.K., G.P., R.M., B.H., X.W., L.B., N.P., K.S., S.N., M.K., T.G., N.D., and J.B. were employees of Decibel Therapeutics. G.P., R.M., L.B., N.P., and K.S. are current employees of Regeneron Pharmaceuticals. A.G.C. was a member of Decibel Therapeutics’ scientific advisory board. The remaining authors declare no competing interests.

Figures
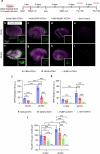
Fig. 1
Fig. 1. Characterizing different promoters to drive ATOH1 expression and hair cell regeneration in adult mouse utricle ex vivo.
a Utricles from 4-10-week-old mice were treated with gentamicin (1 mM) followed by AAV8-CMV-ATOH1-H2B-EGFP, AAV8-GFAP-ATOH1-H2B-EGFP or AAV8-RLBP1-ATOH1-H2B-EGFP (4 × 1011 vg/mL), then examined at day 12 and day 20. bi Utricles treated with CMV-ATOH1, GFAP-ATOH1, RLBP1-ATOH1 or gentamicin control for 12 and 20 days. Insets showing the GFP signals. j, k Mean GFP intensity in hair cells and supporting cells after treatment with CMV, GFAP and RLBP1 promoters. l Quantification shows Pou4f3-positive hair cell counts at day 12 and 20 after treatment with CMV-ATOH1, GFAP-ATOH1, RLBP1-ATOH1 or gentamicin control. Over the time, hair cell number significantly increased with CMV-ATOH1 and GFAP-ATOH1, but not RLBP1-ATOH1 treatment. Data shown as mean ± S.D., compared using two-way ANOVA. p = 0.0063 between CMV-ATOH1 and GFAP-ATOH1 at day 12, and p < 0.0001 for all the others in (j), p = 0.0043 between CMV-ATOH1 and RLBP1-ATOH1 at day 12, p = 0.0001 between GFAP-ATOH1 and RLBP1-ATOH1 at day 20 and p < 0.0001 for all the others in (k). p = 0.0074 between CMV-ATOH1 and RLBP1-ATOH1 at day 12, p = 0.0014 and 0.0191 between day 12 and day 20 with CMV-ATOH1 or GFAP-ATOH1 treatment, respectively. p = 0.006 between RLBP1-ATOH1 and gentamicin control at day 20 and p < 0.0001 for all the others in (l). n = 4, 4, 3 for CMV, GFAP or RLBP1-ATOH1 at 12 days and 5, 5 and 6 at 20 days in (j). n = 4, 4 and 4 for CMV, GFAP or RLBP1-ATOH1 at 12 days and 5, 5 and 6 at 20 days in (k). n = 6, 5, 5 and 5 for CMV, GFAP, RLBP1-ATOH1 or gentamicin control at 12 days and 5, 6, 6 and 4 at 20 days in (l). Scale bars = 100 μm in (bg). Source data are provided as a Source Data file.
Fig. 2
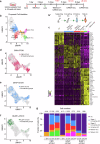
Fig. 2. Single-cell transcriptomic analyses of utricles treated with AAV8-CMV-, GFAP- or RLBP1-ATOH1-H2B-EGFP.
a Utricles from 4-10-week-old mice were treated with gentamicin (1mM) followed by CMV-ATOH1, GFAP-ATOH1 or RLBP1-ATOH1 (4 × 1011 vg/mL), and processed for single-cell RNA sequencing at day 7, 12 and 20. b UMAP plot of integrated dataset of 3 different virus treatments from all timepoints showing 6901 single cells following all quality control steps including only hair cells (HC) and supporting cells (SC). Six cell clusters including, converting SC1, converting SC2, immature HC, mature HCα and mature HCβ were identified. b’ Schematic showing supporting cell-to-hair cell conversion. c Heatmap showing differentially expressed genes among the 6 cell clusters. The top differentially expressed genes of each cluster are shown on the right. A full list of these genes is found in the source data file. The heatmap is colored by relative expression from −2 (magenta) to 2 (yellow). df UMAP plot colored by CMV-ATOH1 (ruby), GFAP-ATOH1 (blue) or RLBP1-ATOH1 (green) treatment. g The fraction of cells from different treatment groups and different timepoints that were assigned to each cell type. n = 7–8 utricles per treatment, per timepoint. Source data are provided as a Source Data file.
Fig. 3
Fig. 3. Supporting-cell-specific promoters drive regenerated hair cell maturation ex vivo.
a Violin plot depicting ATOH1-EGFP transgene expression levels in 6 cell clusters. b UMAP plot of ATOH1-EGFP transgene expression level. c, d Schematic showing persistently and transiently upregulated ATOH1-EGFP transgene in supporting cells and regenerated hair cells after CMV-ATOH1 treatment, and GFAP-ATOH1 or RLBP1-ATOH1 treatment, respectively. e Violin plot of endogenous ATOH1 expression level in 6 different cell clusters. f UMAP plot of endogenous ATOH1 expression level. gj Ridge plots of hair cell maturity, immaturity score, type II hair cell and type I hair cell scores of 6 different cell clusters. k Levels of expression of type I and type II hair cell genes for immature HC (yellow), mature HCα (magenta), mature HCβ (green), and developing and mature hair cells (gray). l Levels of expression of type I and type II hair cell genes for regenerated hair cells after CMV-ATOH1 (ruby), GFAP-ATOH1 (blue) or RLBP1-ATOH1 (green) treatment. Developing and mature hair cells depicted in gray. m Dot plots showing top 18 highly enriched mature hair cell genes from each cell cluster. n Dot plots showing top 10 highly enriched immature hair cell genes from each cell cluster.
Fig. 4
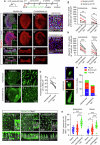
Fig. 4. AAV8-GFAP-ATOH1 induced hair cell regeneration in the adult mouse utricle in vivo.
a 4-10-week-old mice were treated with IDPN (4 or 5 mg/g) at day 1, AAV8-GFAP-ATOH1 (1.71 × 1013 vg/mL) were injected at day 2 or 15. Organs were examined at 2 weeks and 1 month after injection. b, c” Treated utricles had more Myosin7a+ (red) hair cells compared to contralateral ear. d, d’ High magnification images of injected and contralateral ears (from b and b”). GFP+ hair cells (arrowhead) were observed after GFAP-ATOH1 injection. e, f” Crista ampullaris from injected ear has more Myosin7a+ (red) hair cells compared to contralateral ear. g, h GFAP-ATOH1 significantly increased Myosin7a+ (red) hair cells compared to contralateral ear. i, j’ Utricles from injected ear had more hair bundles (phalloidin, green) than contralateral ear. i’, j’ High magnification pictures in boxes. k Phalloidin-labeled bundles increased significantly in utricles from injected ear compared to contralateral controls. ln Representative images of bundles less than 6 µm, between 6 µm and 12 µm, and more than 12 µm. o Measurements of bundle height. pr Expression of Ctbp2+ puncta (gray) on the basolateral surfaces of utricular hair cells from naive, injected ear and contralateral ear. Insets are the 3D view of hair cells at 1 month. s Quantification of Ctbp2+ puncta in Myosin7a+ (green) hair cells. Number of Ctbp2+ puncta per hair cell increased significantly in contralateral ear compared to naive and injected ear. Data shown as mean ± S.D, compared using two-tailed paired Student’s t tests and ordinary one-way ANOVA. p = 0.0033 and 0.005 in extrastriola and striola, respectively in (g), p < 0.0001 and =0.0003 in extrastriola and striola, respectively in (h), p = 0.0110 in (k), p = 0.002 between naive and injected ear in striola and p < 0.0001 for all the others in (s). n = 8 at 2 weeks and =10 at 1 month in (g) and (h). n = 4 in (k). n = 114 and 79 bundles from injected and contralateral ears in (o). n = 36 cells from 3 naive mice ear, 72 cells from 6 injected mice ear and 72 cells from 6 contralateral mice ear in (s). Scale bars = 100 μm in (bf”, i, j), 20 μm in (d, d’, pr), 10 μm in (i’, j’), 2 μm in (ln), 5 μm in (pr) inserts. Source data are provided as a Source Data file.
Fig. 5
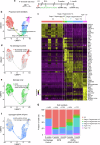
Fig. 5. Single-cell transcriptomic analyses of IDPN-damaged utricles treated with GFAP-ATOH1 in vivo.
a 4-10-week-old mice were treated with IDPN (5 mg/g) at day 1, AAV8-GFAP-ATOH1 (1.71 × 1013 vg/mL) at day 15. Single-cell RNA sequencing was performed at 2 weeks and 1 month after injection. b UMAP plot of integrated dataset of 3 different treatment groups (control, IDPN, IDPN and GFAP-ATOH1) from both time points. There were 8399 single cells following all quality control steps including only hair cells and supporting cells. Six cell clusters including supporting cells, stage 1, stage 2, stage 3 regenerated hair cells, type II and type I hair cells were identified. c Heatmap showing differentially expressed genes among the 6 cell clusters. The top differentially expressed genes of each cluster are shown on the right. A full list of these genes is found in the source data file. The heatmap is colored by relative expression from −2 (magenta) to 2 (yellow). df UMAP plot colored by control (red), IDPN (green) or IDPN or GFAP-ATOH1 (blue) treatment. g The fraction of cells from different treatment groups and different time points that were assigned to each cell type. n = 6 ears per treatment per time point. Source data are provided as a Source Data file.
Fig. 6
Fig. 6. Supporting-cell-specific promoters drives maturation of regenerated hair cells in vivo.
a Violin plot of ATOH1-EGFP transgene expression level in 6 cell clusters. b UMAP plot of ATOH1-EGFP transgene expression levels. c Violin plot of endogenous ATOH1 expression level in 6 different cell clusters. d UMAP plot of endogenous ATOH1 expression level. eh Ridge plots of hair cell maturity, immature hair cell, type II hair cell and type I hair cell scores of 6 different cell clusters. i Expression levels of type I and type II hair cell genes for stage 1 regenerated HC (yellow), stage 2 regenerated HC (green), stage 3 regenerated HC (cyan), type I HC (blue), type II HC (magenta), and developing and mature hair cells (gray). j Levels of expression of type I and type II hair cell genes for hair cells in control (red), IDPN only (green) or IDPN and GFAP-ATOH1 (blue). Developing and mature hair cells are depicted in gray. k Dot plots showing top 18 highly enriched mature hair cell genes from each cell cluster. l Dot plots showing top 10 highly enriched immature hair cell genes from each cell cluster.

References

    1. Tsuji, K. et al. Temporal bone studies of the human peripheral vestibular system. Aminoglycoside ototoxicity. Ann. Otol. Rhinol. Laryngol. Suppl.181, 20–25 (2000). - PubMed
    1. Rauch, S. D., Velazquez-Villasenor, L., Dimitri, P. S. & Merchant, S. N. Decreasing hair cell counts in aging humans. Ann. N. Y. Acad. Sci.942, 220–227 (2001). - PubMed
    1. Agrawal, Y., Carey, J. P., Della Santina, C. C., Schubert, M. C. & Minor, L. B. Disorders of balance and vestibular function in US adults: data from the National Health and Nutrition Examination Survey, 2001-2004. Arch. Intern. Med.169, 938–944 (2009). - PubMed
    1. Sayyid, Z. N., Kim, G. S. & Cheng, A. G. Molecular therapy for genetic and degenerative vestibular disorders. Curr. Opin. Otolaryngol. Head. Neck Surg.26, 307–311 (2018). - PMC - PubMed
    1. Corwin, J. T. Postembryonic production and aging in inner ear hair cells in sharks. J. Comp. Neurol.201, 541–553 (1981). - PubMed

Publication types

MeSH terms

Substances

Associated data