. 2024 Oct 24;14(1):453.
doi: 10.1038/s41398-024-03161-x.

Intravenous chaperone treatment of late-stage Alzheimer´s disease (AD) mouse model affects amyloid plaque load, reactive gliosis and AD-related genes

Affiliations

Intravenous chaperone treatment of late-stage Alzheimer´s disease (AD) mouse model affects amyloid plaque load, reactive gliosis and AD-related genes

Ruixin Zhang et al. Transl Psychiatry. .

Abstract

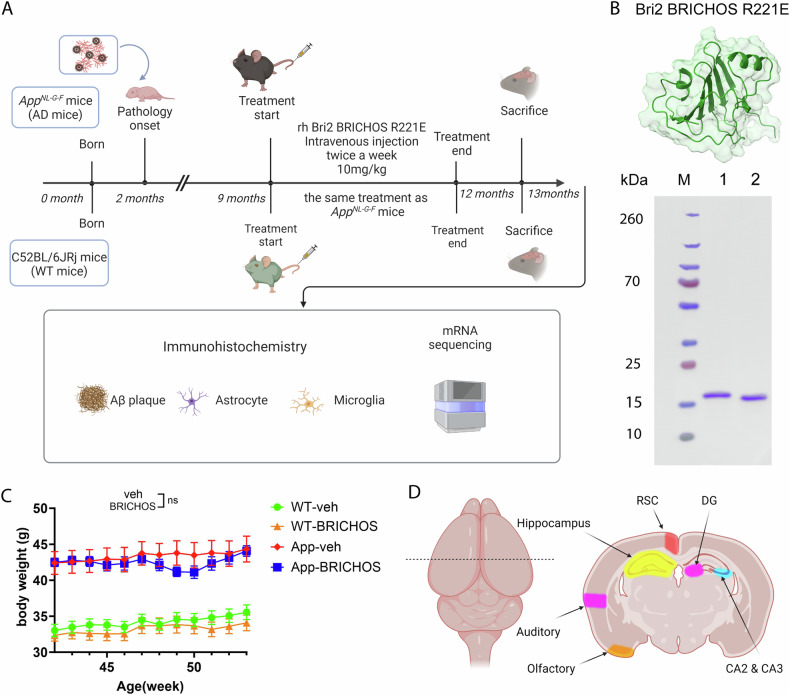
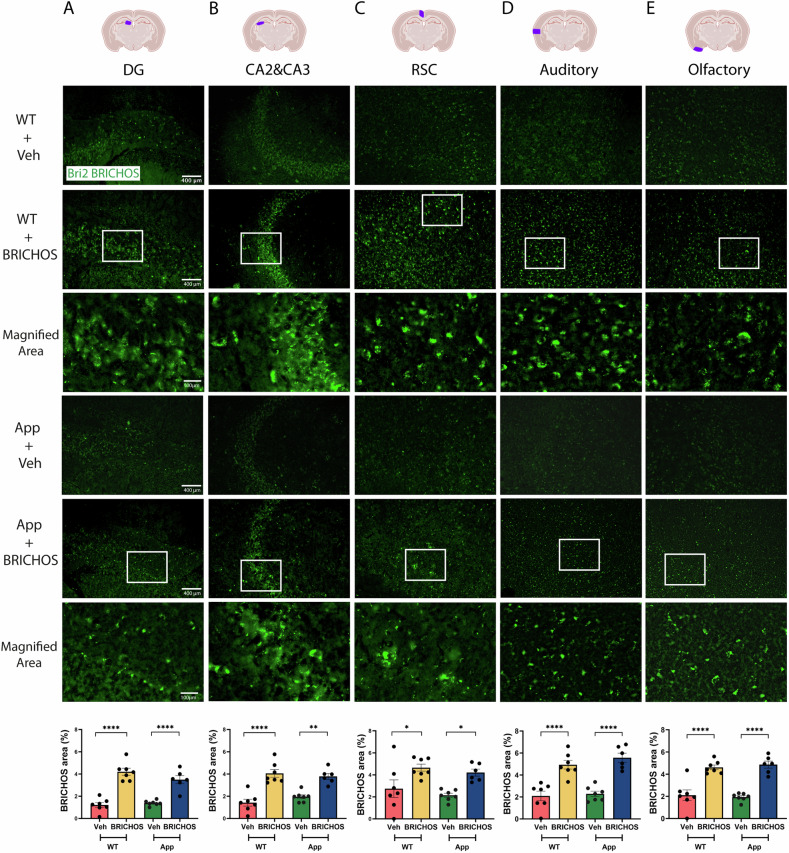
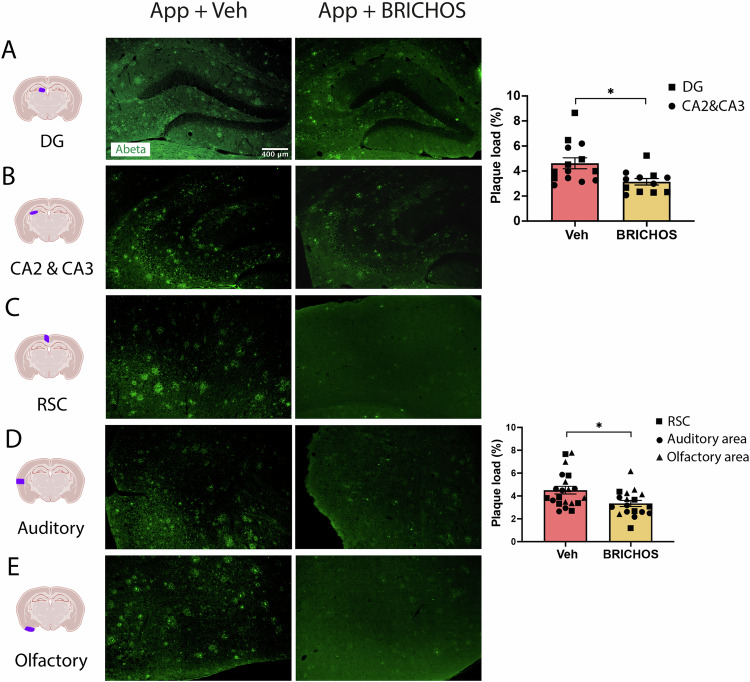
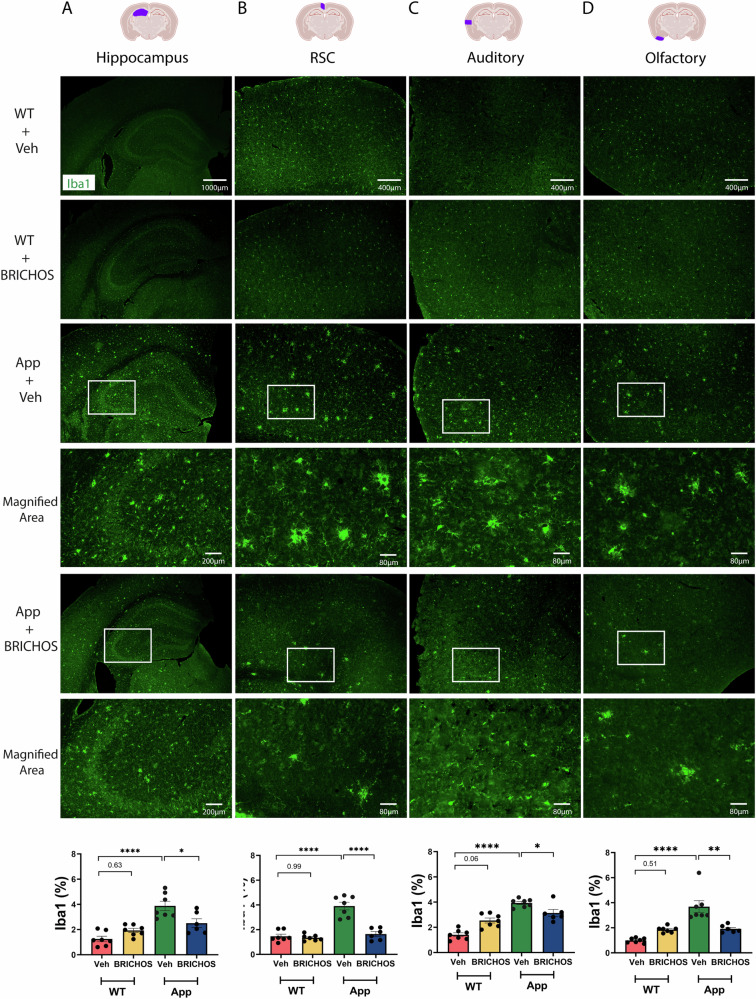
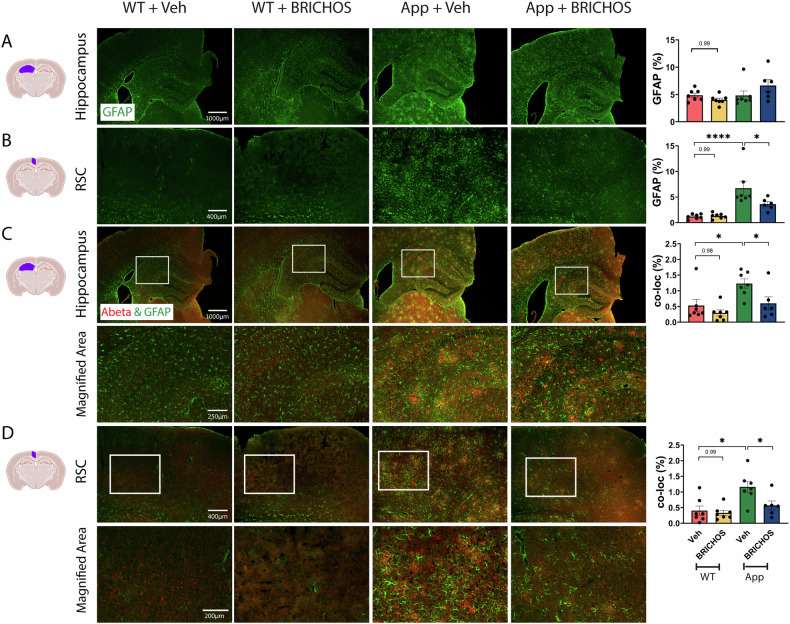
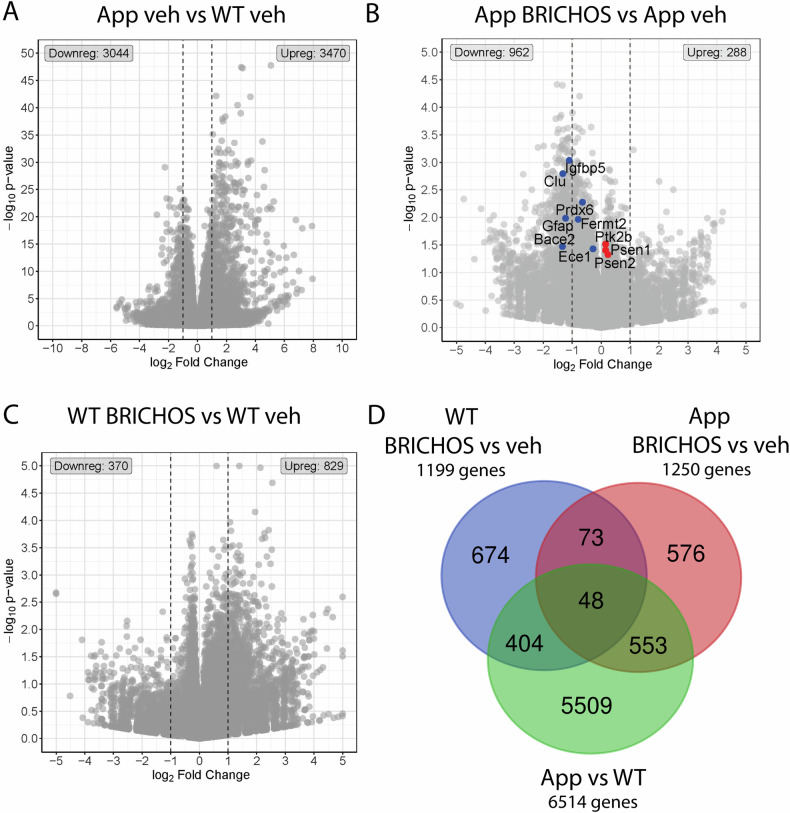
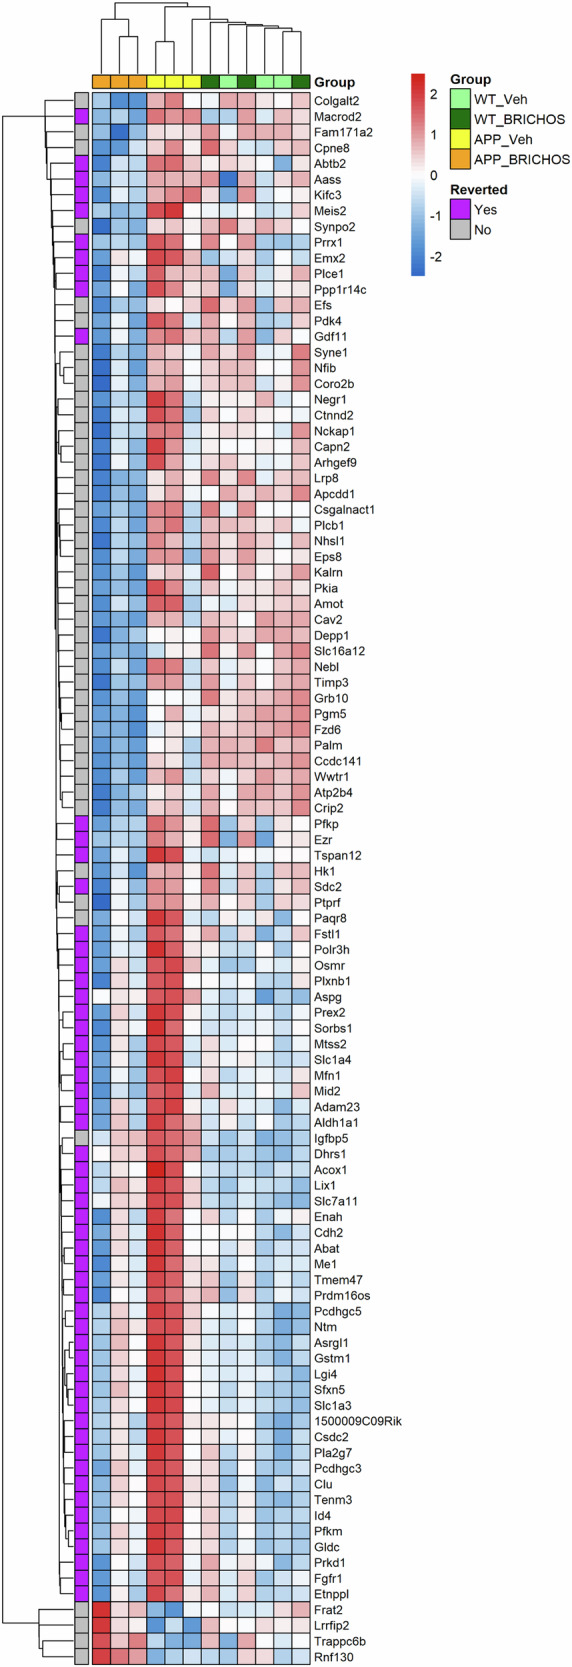
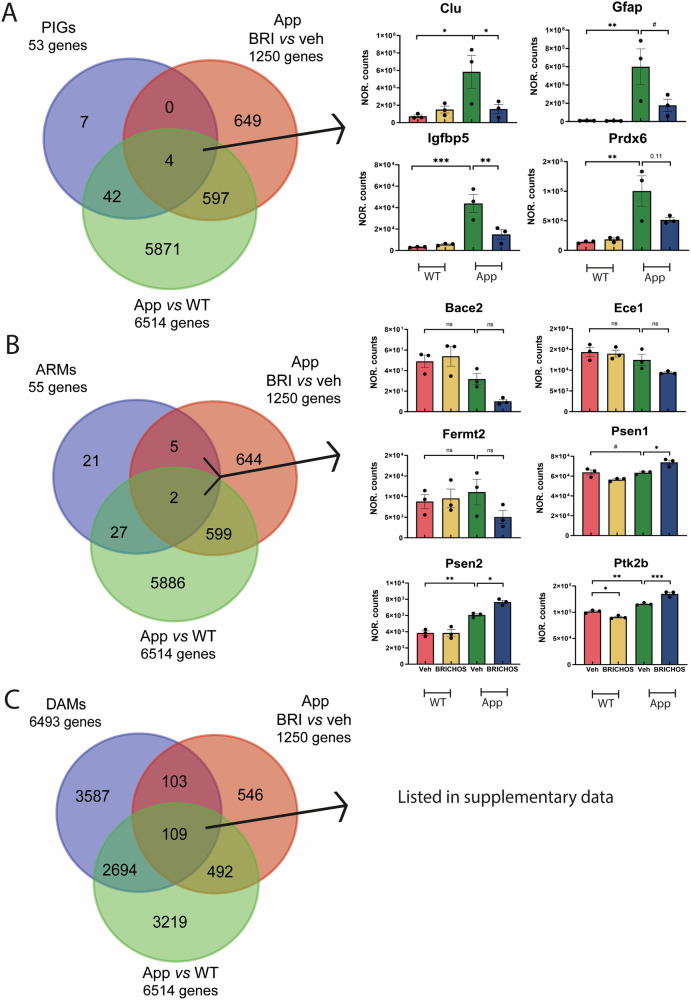
Treatment strategies that are efficient against established Alzheimer's disease (AD) are needed. BRICHOS is a molecular chaperone domain that prevents amyloid fibril formation and associated cellular toxicity. In this study, we treated an AD mouse model seven months after pathology onset, using intravenous administration of recombinant human (rh) Bri2 BRICHOS R221E. Two injections of rh Bri2 BRICHOS R221E per week for three months in AD mice reduced amyloid β (Aβ) burden, and mitigated astro- and microgliosis, as determined by glial fibrillary acidic protein (GFAP) and ionized calcium-binding adaptor molecule 1 (Iba1) immunohistochemistry. Sequencing of RNA from cortical microglia cells showed that BRICHOS treatment normalized the expression of identified plaque-induced genes in mice and humans, including clusterin and GFAP. Rh Bri2 BRICHOS R221E passed the blood-brain barrier (BBB) in age-matched wild-type mice as efficiently as in the AD mice, but then had no effect on measures of AD-like pathology, and mainly affected the expression of genes that affect cellular shape and movement. These results indicate a potential of rh Bri2 BRICHOS against advanced AD and underscore the ability of BRICHOS to target amyloid-induced pathology.


Conflict of interest statement

The authors declare no competing financial interests.

Figures

Fig. 1
Fig. 1. Overview of rh Bri2 BRICHOS R221E treatment of old AppNL-G-F and WT mice.
A Timeline of treatment with rh Bri2 BRICHOS R221E monomer or administration of vehicle (phosphate-buffered saline, PBS) in AppNL-G-F and age-matched WT mice. B Rh Bri2 BRICHOS R221E monomer analysis by reducing (lane 1) and non-reducing (lane 2) SDS-PAGE. M shows the migration of marker proteins with molecular masses in kDa given to the left. The Bri2 BRICHOS R221E structure at the top was predicted by Alphafold2 [93]. C Body weight of the vehicle (veh)- or rh Bri2 BRICHOS R221E-treated AppNL-G-F (App) and WT mice during the treatment period, presented as mean ± SEM. Two-way ANOVA with Tukey’s correction for multiple comparisons was used to calculate p-values for differences in body weight. ns no significance. D Areas of the hippocampus and cerebral cortex analysed by immunohistochemistry. Auditory auditory cortex, CA Cornu ammunis, DG dentate gyrus, Olfactory olfactory cortex, RSC retrosplenial cortex.
Fig. 2
Fig. 2. Rh Bri2 BRICHOS R221E accumulates in the brains of AppNL-G-F and WT mice after intravenous injections.
Representative images of sections from indicated brain regions (column A, DG and B, CA2 and CA3 hippocampal regions; C, RSC, D, auditory and E, olfactory cortex regions) of rh Bri2 BRICHOS R221E- or vehicle (veh)-treated AppNL-G-F (App) and WT mice stained with anti-Bri2 BRICHOS antibody. The areas marked with boxes are shown in the panels below them. The punctuate pattern of staining indicates that rh Bri2 BRICHOS R221E is present intracellularly, see text for details. The bar charts show the rh Bri2 BRICHOS-positive area (% of total area) in the different brain regions for each treatment group. Scale bars represent 400 μm and apply to all panels in the respective column, except the magnified areas for which the scale bars are 100 μm. Data are shown as mean ± SEM (n = 6–7 mice per group). One-way ANOVA test and Tukey’s test were used to calculate the p-values. p < 0.05, ∗∗p < 0.01, ∗∗∗∗p < 0.0001. Auditory auditory cortex, CA Cornu ammunis, DG dentate gyrus, Olfactory olfactory cortex, RSC retrosplenial cortex.
Fig. 3
Fig. 3. Plaque load is reduced in AppNL-G-F mice after rh Bri2 BRICHOS R221E treatment.
Representative images of the hippocampus (A, B) and cerebral cortex (CE) sections from vehicle (veh)- and rh Bri2 BRICHOS R221E-treated AppNL-G-F (App) mice stained with anti-Aβ antibody 82E1. Histograms show plaque load (%) in different hippocampal and cortical regions. The scale bar represents 400 μm and applies to all panels in (AE). Data are presented as mean ± SEM (n = 6–7 mice/group). An unpaired parametric two-tailed t-test was used for statistical analysis. p < 0.05. Auditory auditory cortex, CA Cornu ammunis, DG dentate gyrus, Olfactory olfactory cortex, RSC retrosplenial cortex.
Fig. 4
Fig. 4. Rh Bri2 BRICHOS R221E treatment mitigates microgliosis in AppNL-G-F mice.
Representative images of hippocampus (A) and cortex (BD) sections from vehicle (veh)- and rh Bri2 BRICHOS R221E-treated AppNL-G-F (App) and WT mice stained by immunohistochemistry for Iba1. Bar charts at the bottom show the Iba1-positive area (%) in each brain region for the four treatment groups. The areas marked with boxes are magnified in the panels shown below them. All micrographs from the hippocampus are at a lower magnification than the micrographs from the cortex. Scale bars represent 1000 μm (A) and 400 μm (BD) and apply to all panels in the respective column, except the magnified areas for which scale bars represent 200 μm (A) or 80 μm (BD). Data are shown as mean ± SEM (n = 6–7 mice/group). One-way ANOVA test and Tukey’s test were used for statistical analysis. p < 0.05, ∗∗p < 0.01, ∗∗∗∗p < 0.0001. The entire hippocampus was analysed. Iba1 ionized calcium-binding adaptor molecule 1, RSC retrosplenial cortex.
Fig. 5
Fig. 5. Rh Bri2 BRICHOS R221E treatment mitigates astrogliosis in AppNL-G-F mice.
Representative images of brain sections from vehicle (veh)- and rh Bri2 BRICHOS R221E-treated AppNL-G-F (App) and WT mice stained by immunohistochemistry for GFAP (green, rows A, B) and for GFAP and Aβ (green and red, rows C, D). The areas marked with boxes in (C, D) are magnified in the panels shown below them. Scale bars represent 1000 μm (A, C), 400 μm (B, D), and 200 μm (magnified areas) and apply to all panels in the respective row. Bar charts to the right show the GFAP-positive area (%) in the hippocampus (A) and retrosplenial cortex (RSC) (B), or the GFAP and Aβ colocalized (co-loc) area in the hippocampus (C) and RSC (D). Data are shown as mean ± SEM (n = 6–7 mice/group). One-way ANOVA test and Tukey’s test were used for statistical analysis. p < 0.05, ∗∗∗∗p < 0.0001. The entire hippocampus was analysed. GFAP glial fibrillary acidic protein, RSC retrosplenial cortex.
Fig. 6
Fig. 6. Differentially expressed genes (DEGs) in microglia from AppNL-G-F and WT mice.
AC Volcano plots showing DEGs between A vehicle (veh)-treated AppNL-G-F (App) and WT mice; B rh Bri2 BRICHOS R221E- and veh-treated AppNL-G-F mice, and C rh Bri2 BRICHOS R221E- and veh-treated WT mice. N = 3 mice/group. Different scales are used in panels (AC) for optimal resolution of gene symbols. Vertical dotted lines indicate | log2fold change | ≥1 border. The ten genes identified in panel (B) are further analysed in Fig. 8. The number of down- or up-regulated genes is indicated for each panel. D Venn diagrams of DEGs in veh-treated WT and AppNL-G-F mice (green circle), veh- and rh Bri2 BRICHOS R221E-treated AppNL-G-F mice (red circle), and veh- and rh Bri2 BRICHOS R221E-treated WT mice (blue circle). The identities of the genes in the different intersections between the circles are given in the Supplementary Excel file 1.
Fig. 7
Fig. 7. Effects of Rh Bri2 BRICHOS R221E treatment on gene expression.
Heatmap for all four treatment groups for the 100 top differentially expressed genes (DEGs) between rh Bri2 BRICHOS R221E- and vehicle (veh)-treated AppNL-G-F (App) and WT mice. The genes were selected based on p-values for changed gene expression between AppNL-G-F mice given veh or BRICHOS, with the gene order determined by the clustering outcome. The genes reverted by rh Bri2 BRICHOS R221E treatment are further analysed in Supplementary Fig. 3 and discussed in the text. A row-based pseudo-scale has been used for the heatmap colouring, with the highest expression in red and the lowest in blue. n = 3 mice/group. Heat colouring is shown as | log2fold change | ≥1 and p < 0.05.
Fig. 8
Fig. 8. Genes affected by rh Bri BRICHOS R221E treatment in relation to plaque-induced genes and genes in microglia subpopulations.
Venn diagrams illustrating differentially expressed genes (DEGs) in the vehicle (veh)-treated WT and AppNL-G-F (App) mice (green circle), veh- and rh Bri2 BRICHOS R221E-treated AppNL-G-F mice (red circle), and A plaque-induced genes (PIGs, blue circle); B activated response microglia genes (ARMs, blue circle); and C disease-associated microglia genes (DAMs, blue circle). Histograms of normalized (NOR) counts for the four treatment groups of genes in the indicated intersections for panels (A, B) are shown to the right. For panel C, the genes in the indicated intersection are identified in Supplementary Excel file 2, together with genes in intersections from panels (A, B). See main text for details. n = 3 mice/group, one-way ANOVA test and Tukey’s test were used for statistical analysis. p < 0.05, ∗∗p < 0.01, ∗∗∗p < 0.001, 0.05 < #p < 0.1.

References

    1. Winblad B, Amouyel P, Andrieu S, Ballard C, Brayne C, Brodaty H, et al. Defeating Alzheimer’s disease and other dementias: a priority for European science and society. Lancet Neurol. 2016;15:455–532. - PubMed
    1. Karran E, De Strooper B. The amyloid hypothesis in Alzheimer disease: new insights from new therapeutics. Nat Rev Drug Discov. 2022;21:306–18. - PubMed
    1. Sims JR, Zimmer JA, Evans CD, Lu M, Ardayfio P, Sparks J, et al. Donanemab in early symptomatic Alzheimer disease: the TRAILBLAZER-ALZ 2 randomized clinical trial. JAMA. 2023;330:512–27. - PMC - PubMed
    1. van Dyck CH, Swanson CJ, Aisen P, Bateman RJ, Chen C, Gee M, et al. Lecanemab in early Alzheimer’s disease. N Engl J Med. 2023;388:9–21. - PubMed
    1. Sevigny J, Chiao P, Bussiere T, Weinreb PH, Williams L, Maier M, et al. The antibody aducanumab reduces abeta plaques in Alzheimer’s disease. Nature. 2016;537:50–6. - PubMed

MeSH terms

Substances