. 2024 Oct 24;15(1):9174.
doi: 10.1038/s41467-024-53023-9.

Osteopontin is a therapeutic target that drives breast cancer recurrence

Affiliations

Osteopontin is a therapeutic target that drives breast cancer recurrence

Yu Gu et al. Nat Commun. .

Abstract

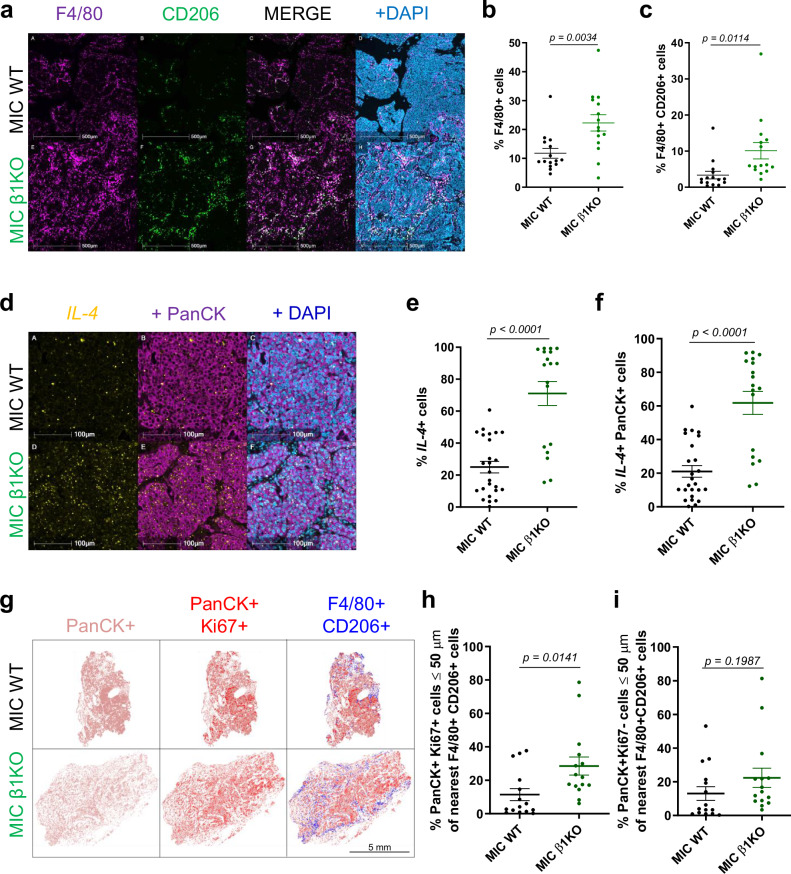
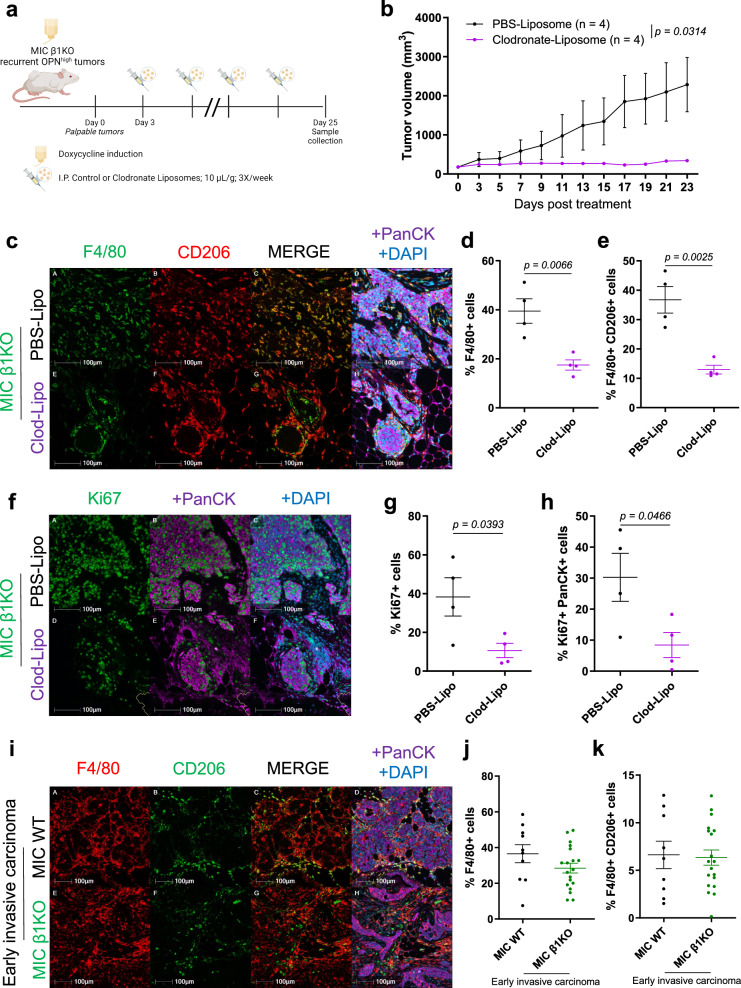
Recurrent breast cancers often develop resistance to standard-of-care therapies. Identifying targetable factors contributing to cancer recurrence remains the rate-limiting step in improving long-term outcomes. In this study, we identify tumor cell-derived osteopontin as an autocrine and paracrine driver of tumor recurrence. Osteopontin promotes tumor cell proliferation, recruits macrophages, and synergizes with IL-4 to further polarize them into a pro-tumorigenic state. Macrophage depletion and osteopontin inhibition decrease recurrent tumor growth. Furthermore, targeting osteopontin in primary tumor-bearing female mice prevents metastasis, permits T cell infiltration and activation, and improves anti-PD-1 immunotherapy response. Clinically, osteopontin expression is higher in recurrent metastatic tumors versus female patient-matched primary breast tumors. Osteopontin positively correlates with macrophage infiltration, increases with higher tumor grade, and its elevated pathway activity is associated with poor prognosis and long-term recurrence. Our findings suggest clinical implications and an alternative therapeutic strategy based on osteopontin's multiaxial role in breast cancer progression and recurrence.


Conflict of interest statement

The authors declare no competing interest.

Figures

Fig. 1
Fig. 1. β1 integrin-deficient recurrent tumors have elevated levels of osteopontin (OPN, Spp1).
a UMAP plots showing Spp1 expression from single-cell RNA sequencing of early invasive carcinoma from MIC WT lesions (fast-growing, pooled lesions from n = 3 mice) or MIC β1KO lesions (dormant, pooled lesions from n = 6 mice), specifically in the epithelial tumor cell cluster. b Normalized read counts for Spp1 from RNA-seq data from MIC WT (n = 6) or MIC β1KO (n = 9) recurrent tumors that exited dormancy from GSE186491. c RT-qPCR analysis for Spp1 transcript, normalized to Gapdh from MIC WT (n = 6) and MIC β1KO (n = 13) recurrent tumors. d RNA Scope for mouse Spp1 (mSpp1) and fluorescent immunohistochemistry (IHC) for PanCK and DAPI on MIC WT (n = 12) and MIC β1KO (n = 15) recurrent tumors. e Quantification of mSpp1+ cells in MIC WT (n = 12) and MIC β1KO (n = 15) recurrent tumors. f Fluorescent IHC for OPN, PanCK, and DAPI on MIC WT (n = 16) and MIC β1KO (n = 17) recurrent tumors. g Quantification of OPN+ cells in MIC WT (n = 16) and MIC β1KO (n = 17) recurrent tumors. Scale bars are as indicated on each image. Mean ± SEM for data calculated using two-tailed Student’s t test. Each data point is representative of one biological sample for (b), (c), (e), and (g). Source data are provided as a Source Data file.
Fig. 2
Fig. 2. Exogenous osteopontin accelerates tumor growth in vivo.
a Schematic representation of experimental design for intraperitoneal injection of recombinant mouse OPN (rmOPN) supplementation to MIC WT mice induced on doxycycline. Created in BioRender. Muller, W. (2024) BioRender.com/k70t287. b Tumor volume measured from weekly palpations of MIC WT mice treated with saline or rmOPN. c Schematic representation of experimental design for intraperitoneal injection of rmOPN supplementation to MIC β1KO mice induced on doxycycline. Created in BioRender. Muller, W. (2024) BioRender.com/t18p112. d Tumor volume measured from weekly palpations of MIC β1KO mice treated with saline or rmOPN. Two-tailed Students’ t-test was performed at endpoint and n denotes number of tumors per treatment arm for (b, d). e Fluorescent IHC for Ki67 and DAPI on tumors and mammary glands of MIC WT mice treated with saline (n = 8) or rmOPN (n = 14). f Quantification of Ki67+ cells in tumors and mammary glands of MIC WT mice treated with saline (n = 8) or rmOPN (n = 14). g Fluorescent IHC for Ki67, PanCK, and DAPI on tumors and mammary glands of MIC β1KO mice treated with saline (n = 16) or rmOPN (n = 25). h Quantification of Ki67+ cells in tumors and mammary glands of MIC β1KO mice treated with saline (n = 16) or rmOPN (n = 25). Scale bars are as indicated on each image. Mean ± SEM for data calculated using two-tailed Student’s t test unless otherwise specified. Each data point is representative of one biological sample for (f, h). Source data are provided as a Source Data file.
Fig. 3
Fig. 3. β1 integrin-deficient recurrent tumors have elevated levels of pro-tumorigenic macrophages.
a Fluorescent IHC for F4/80, CD206, and DAPI on MIC WT (n = 15) and MIC β1KO (n = 15) recurrent tumors. b, c Quantification of total F4/80+ cells (total macrophages) and F4/80+ CD206+ cells (pro-tumorigenic macrophages) in MIC WT (n = 15) and MIC β1KO (n = 15) recurrent tumors. d RNA Scope for mouse IL-4 and fluorescent IHC for PanCK and DAPI on MIC WT (n = 25) and MIC β1KO (n = 18) recurrent tumors. e, f Quantification of total IL-4+ cells and IL-4+ PanCK+ cells in MIC WT (n = 25) and MIC β1KO (n = 18) recurrent tumors. g Representative MIC WT (n = 15) and MIC β1KO (n = 15) recurrent tumors from (a) for all PanCK+ epithelial cells, PanCK+ Ki67+ proliferating epithelial cells, and F4/80+ CD206+ macrophages. h Quantification of the percentage of PanCK+ Ki67+ cells within 50 μm of the nearest F4/80+ CD206+ macrophages in MIC WT (n = 15) and MIC β1KO (n = 15) recurrent tumors. i Quantification of the percentage of PanCK+ Ki67- cells within 50 μm of the nearest F4/80+ CD206+ macrophages in MIC WT (n = 15) and MIC β1KO (n = 15) recurrent tumors. Scale bars are as indicated on each image. Mean ± SEM for data calculated using two-tailed Student’s t test. Each data point is representative of one biological sample for (b), (c), (e), (f), (h), and (i). Source data are provided as a Source Data file.
Fig. 4
Fig. 4. Osteopontin induces macrophage migration and synergistically polarizes macrophages towards a pro-tumorigenic state with IL-4.
a Schematic representation of mouse bone marrow-derived macrophages (BMDMs). Created in BioRender. Muller, W. (2024) BioRender.com/w64j858. b Schematic representation of experimental design for migration assay of BMDM in vitro with various concentrations of recombinant mouse OPN (rmOPN). Created in BioRender. Muller, W. (2024) BioRender.com/h82t760. c Cell count of BMDM cells (n = 3 cell lines) in transwell migration assay towards saline, rmOPN at 1 and 5 μg/mL for 4, 8, and 24 h. Each data point is an average of four counts of four fields of view. d FACS sorting for mouse BMDM cells (n = 3 cell lines) treated with saline, rmOPN, IL-4, and rmOPN and IL-4. Total F4/80+ macrophages from live cells sorted based on the expression of IL-4 receptor (IL-4R) and arginase 1. e Quantification of the percentage of arginase 1high cells out of total F4/80+ macrophages (n = 3 cell lines). f Quantification of the percentage of arginase 1high IL-4Rhigh cells out of total F4/80+ macrophages (n = 3 cell lines). Mean ± SEM for data calculated using Ordinary One Way ANOVA with Tukey’s post hoc test. Each data point is representative of one mouse BMDM cell line for (e, f). Source data are provided as a Source Data file.
Fig. 5
Fig. 5. Macrophage depletion reduces MIC β1KO recurrent tumor growth.
a Schematic representation of experimental design for intraperitoneal injection of PBS- or clodronate-liposomes to MIC β1KO mice. Created in BioRender. Muller, W. (2024) BioRender.com/r58v392. b Tumor volume measured from weekly palpations of MIC β1KO mice treated with PBS- or clodronate-liposomes. Two-tailed Students’ t test was performed at endpoint and n denotes number of tumors per treatment arm. c Fluorescent IHC for F4/80, CD206, PanCK, and DAPI on tumors of MIC β1KO mice treated with PBS- or clodronate-liposomes (n = 4 per group). d, e Quantification of total F4/80+ cells and F4/80+ CD206+ cells in tumors of MIC β1KO mice treated with PBS- or clodronate-liposomes (n = 4 per group). f Fluorescent IHC for Ki67, PanCK, and DAPI on tumors of MIC β1KO mice treated with PBS- or clodronate-liposomes (n = 4 per group). g, h Quantification of total Ki67+ cells and Ki67+ PanCK+ cells in tumors of MIC β1KO mice treated with PBS- or clodronate-liposomes (n = 4 per group). i Fluorescent IHC for F4/80, CD206, PanCK, and DAPI on early invasive carcinoma from MIC WT lesions (fast-growing, n = 10) or MIC β1KO lesions (dormant, n = 19). j, k Quantification of total F4/80+ cells and F4/80+ CD206+ cells in early invasive carcinoma from MIC WT lesions (fast-growing, n = 10) or MIC β1KO lesions (dormant, n = 19). Scale bars are as indicated on each image. Mean ± SEM for data calculated using two-tailed Student’s t test unless otherwise specified. Each data point is representative of one biological sample for (d), (e), (g), (h), (j), and (k). Source data are provided as a Source Data file.
Fig. 6
Fig. 6. Pharmacological inhibition of osteopontin decreases primary tumor growth and lung metastasis and improves anti-PD-1 response.
a Schematic representation of experimental design for intraperitoneal injection of control antibody IgG or mouse osteopontin neutralizing antibody (anti-mOPN) into MIC WT mice induced on doxycycline. Created in BioRender. Muller, W. (2024) BioRender.com/c88t325. b Tumor volume measured from weekly palpations of MIC WT mice treated with IgG or anti-mOPN. Two-tailed Students’ t-test was performed at endpoint and n denotes number of tumors per treatment arm. c Representative H&E images of lungs in MIC WT mice treated with IgG (n = 9) or anti-mOPN (n = 6). d Percentage of animals with lung metastasis in MIC WT mice treated with IgG or anti-mOPN. e Fluorescent IHC for CD3, CD4, PD-1, and DAPI on tumors and mammary glands of MIC WT mice treated with IgG (n = 24) or anti-mOPN (n = 19). f Quantification of PD-1+ cells in tumors and mammary glands of MIC WT mice treated with IgG (n = 24) or anti-mOPN (n = 19). g Schematic representation of experimental design for intraperitoneal injection of control antibodies IgG2a (control for anti-PD-1) and IgG Goat (control for anti-mOPN), anti-PD-1 and IgG Goat, anti-mOPN and IgG2a, or anti-PD-1 and anti-mOPN into FVB mice with mammary fat pad (MFP)-transplanted MMTV PyV mT tumors. Created in BioRender. Muller, W. (2024) BioRender.com/z45w893. h Tumor volume measured from weekly palpations of FVB mice with MFP-transplanted MMTV PyV mT tumors treated with IgG2a and IgG Goat, anti-PD-1 and IgG Goat, anti-mOPN and IgG2a, or anti-PD-1 and anti-mOPN. Two-tailed Students’ t test was performed at endpoint and n denotes number of tumors per treatment arm. Scale bars are as indicated on each image. Mean ± SEM for data calculated using two-tailed Student’s t test unless otherwise specified. Each data point is representative of one biological sample for (f). Source data are provided as a Source Data file.
Fig. 7
Fig. 7. Human invasive carcinomas have elevated levels of osteopontin versus adjacent normal mammary tissue.
a Spp1 expression in human breast tumor tissue (n = 31) and in normal human breast tissue (n = 80) from BCFGG Biobank GSE142767. b Fluorescent IHC for OPN, PanCK, and DAPI on primary human breast cancer tissue microarrays BC081120f and BR1504b (TissueArray.Com, formerly US Biomax). Representative images of samples are shown for adjacent normal cores and invasive ductal carcinoma cores. c Percentage of primary human breast cancer tissue microarray cores (BC081120f and BR1504b) with or without osteopontin expression in adjacent normal (Adj norm) and invasive ductal carcinoma (Inv carc) tissues. df Quantification of OPN H Score, total OPN+ cells, and OPN+ PanCK+ cells in adjacent normal (n = 13) and invasive ductal carcinoma (n = 200) cores in primary human breast cancer tissue samples. gi Quantification of OPN H Score, total OPN+ cells, and OPN+ PanCK+ cells per grade in primary human breast cancer tissue samples (Grade 1: n = 22; Grade 2: n = 133; Grade 3: n = 38). Scale bars are as indicated on each image. Mean ± SEM for data calculated using two-tailed Student’s t test. Each data point is representative of one biological sample for (a) and (di). Source data are provided as a Source Data file.
Fig. 8
Fig. 8. Osteopontin levels are increased in patient-matched recurrent metastatic tumors versus primary breast tumors.
a Sample manifest of patient-matched primary breast tumors and recurrent metastatic tumors. b Fluorescent IHC for OPN, PanCK, and DAPI on patient-matched primary breast tumors (n = 10) and recurrent metastatic tumors (n = 10). ce Quantification of OPN H Score, total OPN+ cells, and OPN+ PanCK+ cells in patient-matched primary breast tumors (n = 10) and recurrent metastatic tumors (n = 10). Scale bars are as indicated on each image. Mean ± SEM for data calculated using two-tailed Student’s t test. Each data point is representative of one biological sample for (ce). Source data are provided as a Source Data file.
Fig. 9
Fig. 9. Osteopontin positively correlates with macrophage infiltration and decreased relapse-free survival in human breast cancer.
a Kaplan–Meier survival curves of Spp1 low and Spp1 high-expressing ER+ /PR+ /HER2- human breast tumors from GSE58644. Statistical significance was calculated using the Log-rank (Mantel-Cox) test. b Forest plot representation of meta-analysis on hazard ratios for 5-year relapse-free survival as a function of OPN pathway activity (Spp1, Timp3, Col11a1, Mmp9, Mmp2, Fn1, Cd44, IL-4) for 115 breast cancer patients across 8 individual datasets using a tailored OPN pathway activity signature. Names and sizes of data sets, HR (center of square), and 95% CIs (horizontal line) are shown for each dataset. Sizes of squares are proportional to weights used in meta-analysis. The overall HRs (dashed vertical lines) and associated CIs (lateral tips of diamond) are shown for the random-effects model. Solid vertical line indicates no effect. The HRs represent the change in risk over half of the full range of estimated pathway activity. The overall P value was calculated using two-tailed z-test on the pooled hazard ratio estimate. c Correlation between Spp1 and CD206 in the epithelial compartment of human breast cancer from GSE9014 (n = 48). Statistical significance was calculated using two-tailed Spearman rank correlation test. d Spp1 expression levels between tumor and adjacent normal tissues across various cancers, generated using TIMER2.0. Box plot with center line = median, box = 25th–75th quartile, whiskers = maxima/minima. Statistical significance was calculated using two-tailed Wilcoxon test (*p < 0.05; **p < 0.01; ***p < 0.001). Source data are provided as a Source Data file.
Fig. 10
Fig. 10. Osteopontin is a therapeutic target that drives breast cancer recurrence.
a Schematic model of breast cancer recurrence driven by osteopontin (OPN). In the transgenic mouse model of breast cancer recurrence post-β1 integrin inhibition and in local and metastatic recurrent patient tumor samples, elevated levels of OPN serve as a central modulator that directs a pro-tumorigenic environment. OPN promotes tumor cell proliferation, recruits macrophages, synergizes with IL-4 to polarize them into the pro-tumorigenic state, and inhibits T cell activity. Tumor cell and pro-tumorigenic macrophages contribute to extracellular matrix (ECM) secretion and remodeling, including OPN. Targeting OPN reduces tumor burden, permits T cell infiltration and activation, and improves anti-PD-1 response. Black arrow indicates secretion; green arrow indicates recruitment; red arrow indicates activation; circular arrow indicates proliferation; blunt arrow indicates inhibition. Created in BioRender. Muller, W. (2024) BioRender.com/g26d472.

References

    1. Gu, Y., Bui, T. & Muller, W. J. Exploiting mouse models to recapitulate clinical tumor dormancy and recurrence in breast cancer. Endocrinology163, bqac055 (2022). - PubMed
    1. Bushnell, G. G. et al. Breast cancer dormancy: need for clinically relevant models to address current gaps in knowledge. NPJ Breast Cancer7, 66 (2021). - PMC - PubMed
    1. Bui, T., Gu, Y., Ancot, F., Sanguin-Gendreau, V., Zuo, D. & Muller, W. J. Emergence of beta1 integrin-deficient breast tumours from dormancy involves both inactivation of p53 and generation of a permissive tumour microenvironment. Oncogene41, 527–537 (2022). - PMC - PubMed
    1. Goddard, E. T., Bozic, I., Riddell, S. R. & Ghajar, C. M. Dormant tumour cells, their niches and the influence of immunity. Nat. Cell Biol.20, 1240–1249 (2018). - PubMed
    1. Attalla, S., Taifour, T., Bui, T. & Muller, W. Insights from transgenic mouse models of PyMT-induced breast cancer: recapitulating human breast cancer progression in vivo. Oncogene40, 475–491 (2021). - PMC - PubMed

Publication types

Associated data