. 2024 Oct 24;14(1):25189.
doi: 10.1038/s41598-024-73453-1.

Chronic hypoxia for the adaptation of extracellular vesicle phenotype

Affiliations

Chronic hypoxia for the adaptation of extracellular vesicle phenotype

Chris S Pridgeon et al. Sci Rep. .

Abstract

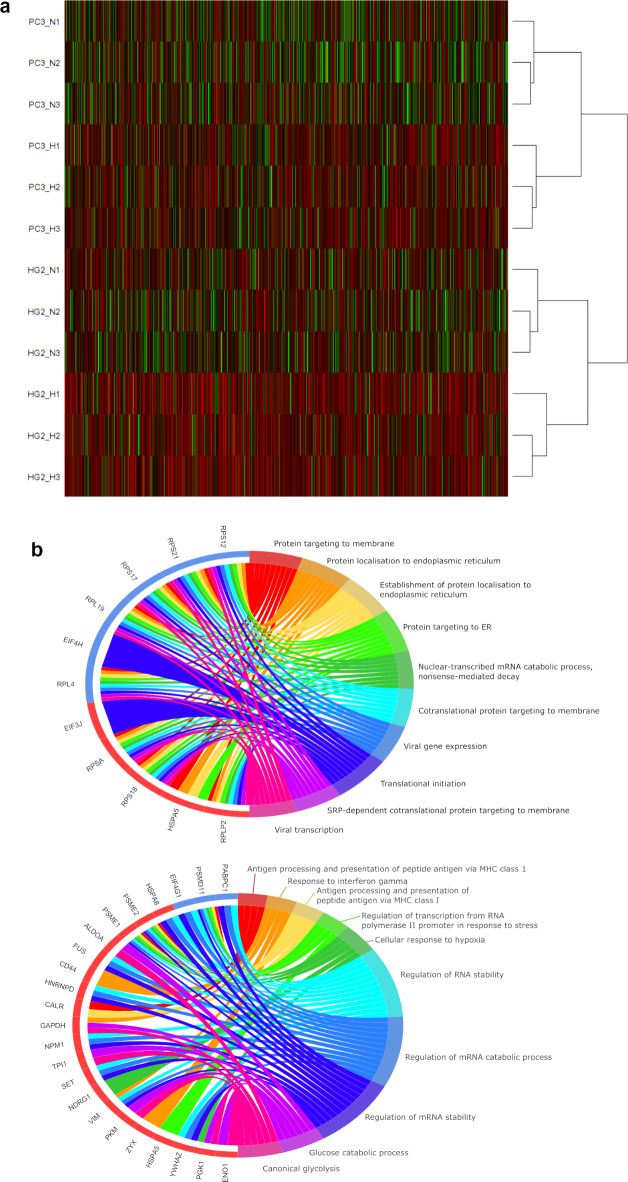
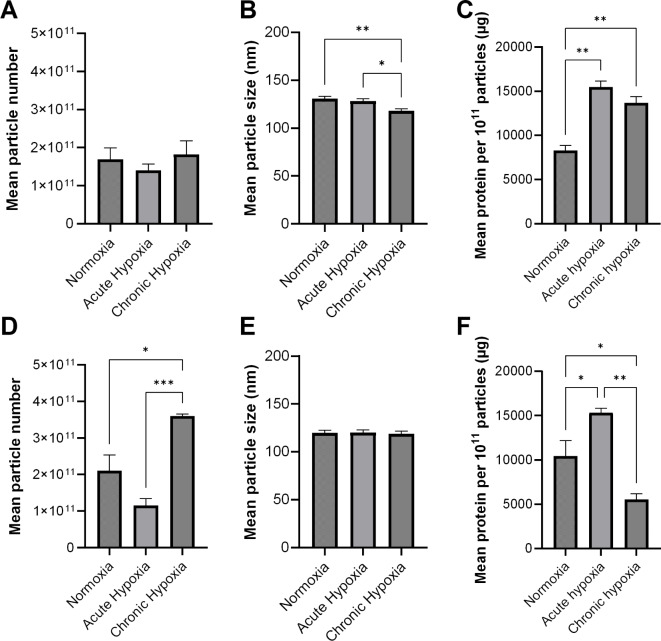
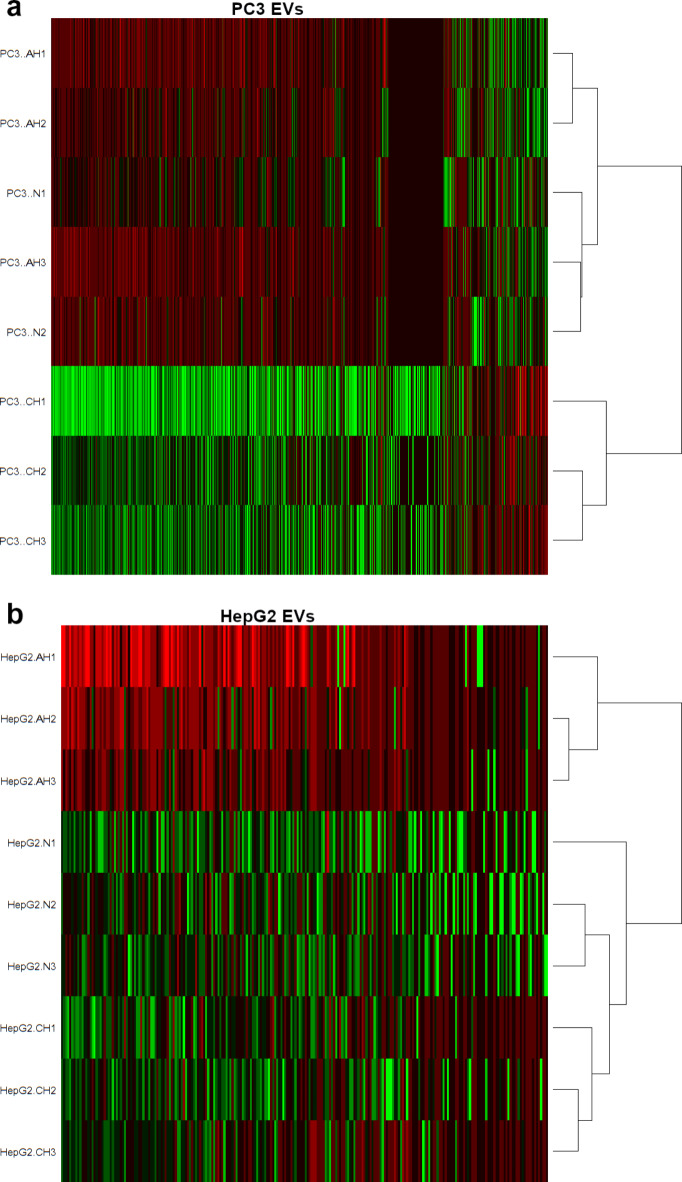
Variations in oxygen level affect the phenotype of cells and extracellular vesicles (EVs). Depending on the metabolic oxygen demand of cells, hypoxic cell culture can produce conditions more like those found in vivo, and with appropriate oxygen levels, mimic hypoxic tumours. However, most previous experiments studying both EVs and the effects of hypoxia on cells use periods of 72 h or less of hypoxia. We hypothesised that this was insufficient time for adaptation to hypoxic conditions both for EVs and cells which may skew the results of such studies. In this study, the effects of acute (72 h) and chronic hypoxia (> 2 weeks) on the phenotype of HepG2 and PC3 cells and their EVs were examined. Cells could be cultured normally under chronic hypoxic conditions and cryopreserved and recovered. The effects of hypoxia on EV phenotype are slow to establish and dependent on cell line. In PC3 cells, the greatest change in phenotype and increase in EV production occurred only with chronic hypoxic culture. In HepG2 cells, the number of EVs produced was insensitive to hypoxic culture and the greatest changes in protein expression were observed after acute hypoxic culture. Nonetheless, biphasic changes in EV phenotype were detected in both cell types in response to either acute or chronic hypoxia. These results indicate that for cells which do not induce consumptive oxygen depletion, prolonged hypoxic culture is required for complete adaptation.


Conflict of interest statement

The authors declare no conflict of interest.

Figures

Fig. 1
Fig. 1
Experimental setup of hypoxia experiments. Three oxygen conditions were compared. In normoxia, cells were cultured in normoxic (5% CO2, other gases uncontrolled) conditions whilst maintaining passage number parity with chronic hypoxic conditions. In chronic hypoxia, cells were adapted to hypoxic conditions (5% O2, 5% CO2, 90% N2) for at least 14 days before experiments began. In acute hypoxia, cells were maintained in normoxic conditions until use, at which point they were transferred to hypoxic conditions for 72 h. When cells were transferred to hypoxic conditions, the medium was exchanged for degassed medium, which was also used for subsequent medium changes in hypoxia.
Fig. 2
Fig. 2
Doubling time and morphology in hypoxic culture (A, B). Doubling time in hours, of HepG2 (A) and PC3 (B) cells when cultured in normoxia and 5% O2 hypoxia over a 15-day period after a period of adaptation for at least two weeks. Doubling time was calculated every three days in hypoxia and every six days in normoxia and was not significantly different between conditions (HepG2 p = 0.179, PC3 p = 0.080). (C) Brightfield micrographs of HepG2 (top) and PC3 (bottom) cells cultured in normoxia (left) and hypoxia (right). Scale bars are 200 μm. Hypoxia micrographs taken after culture in 5% O2 for approximately one month and after cryopreservation whilst maintaining hypoxic conditions.
Fig. 3
Fig. 3
Phenotype of HepG2 and PC3 cells when cultured in chronic 5% O2 hypoxia. (A) Heatmap of protein expression in HepG2 and PC3 cells produced using the gplots package in Rstudio. Green denotes higher expression and red denotes lower expression. The dendrogram shows hierarchical clustering of samples. (B, C) Chord plots summarising the major changes in protein expression in HepG2 (B) and PC3 (C) cells produced from a list of BP GO terms produced using StringDB and the GOplot package in R. The right side displays the 10 Biological Process Gene Ontology terms most associated with the changes in protein expression. The left side shows the proteins with the greatest change in expression. A blue or red label denotes a downregulation or upregulation in conditions of hypoxia, respectively. The coloured chords denote membership of the highly changed genes within the most significant GO terms. n = 3. Abbreviations: AH = acute hypoxia, BP GO = biological process gene ontology, CH = chronic hypoxia, HG2 = HepG2, N = normoxia.
Fig. 4
Fig. 4
Extracellular vesicle production and content in different oxygen conditions. Panels A-C show values for HepG2, panels D-F show values for PC3. (A, D) Mean number of particles produced in 72 hours in different oxygen conditions normalised to cell number. (B, E) Mean size of particles produced in 72 hours in different oxygen conditions (C, F) Mean protein content of EVs produced in 72 hours in different oxygen conditions. Normoxia refers to culture under standard tissue culture conditions with atmospheric oxygen. Acute hypoxia refers to culture of cells in 5% O2 hypoxia for 72 hours. Chronic hypoxia also refers to culture of cells in 5% O2 with at least two weeks additional culture in 5% O2 hypoxia prior to experimentation. Error bars in all panels are SEM. Asterisks (*) denote significance determined by one-way ANOVA with Tukey’s HSD test, * = p ≤ 0.05, ** = p ≤ 0.01, *** = p ≤ 0.001.
Fig. 5
Fig. 5
Protein expression in HepG2 and PC3 EVs in different oxygen conditions. Panel (A) shows data for HepG2, panel (B) shows data for PC3. The global protein expression of EVs was measured with proteomics and hierarchical clustering was performed in R using the gplots package. EVs were harvested for 72 h from cells cultured in either normoxic, AH, or CH conditions. Normoxia refers to culture under standard tissue culture conditions with atmospheric oxygen. AH refers to culture of cells in 5% O2 hypoxia for 72 h. CH refers to culture of cells in 5% O2 with at least two weeks additional culture in 5% O2 hypoxia prior to experimentation. n = 3, except in PC3 N where n = 2 Abbreviations: AH = acute hypoxia, CH = chronic hypoxia, N = normoxia.

References

    1. Bell, C. C. et al. Characterization of primary human hepatocyte spheroids as a model system for drug-induced liver injury, liver function and disease. Sci Rep [Internet]. May 4 [cited 2016 Dec 8];6(1):25187. (2016). http://www.nature.com/articles/srep25187 - PMC - PubMed
    1. Place, T. L., Domann, F. E. & Case, A. J. Limitations of oxygen delivery to cells in culture: An underappreciated problem in basic and translational research. Free Radic Biol Med [Internet]. ;113:311–22. (2017). https://linkinghub.elsevier.com/retrieve/pii/S0891584917307864 - PMC - PubMed
    1. Keeley, T. P. & Mann, G. E. Defining physiological Normoxia for Improved translation of cell physiology to animal models and humans. Physiol. Rev.99 (1), 161–234 (2019). - PubMed
    1. Semenza, G. L. HIF-1: mediator of physiological and pathophysiological responses to hypoxia. J. Appl. Physiol.88 (4), 1474–1480 (2000). - PubMed
    1. Wang, S. E. Extracellular Vesicles and Metastasis. Cold Spring Harb Perspect Med [Internet]. Jul 1 [cited 2024 Feb 23];10(7):1–18. Available from: /pmc/articles/PMC7328450/ (2020). - PMC - PubMed

LinkOut - more resources