. 2024 Oct 24;9(1):198.
doi: 10.1038/s41541-024-00986-x.

Vaccine-induced human monoclonal antibodies to PfRH5 show broadly neutralizing activity against P. falciparum clinical isolates

Affiliations

Vaccine-induced human monoclonal antibodies to PfRH5 show broadly neutralizing activity against P. falciparum clinical isolates

Laty G Thiam et al. NPJ Vaccines. .

Abstract

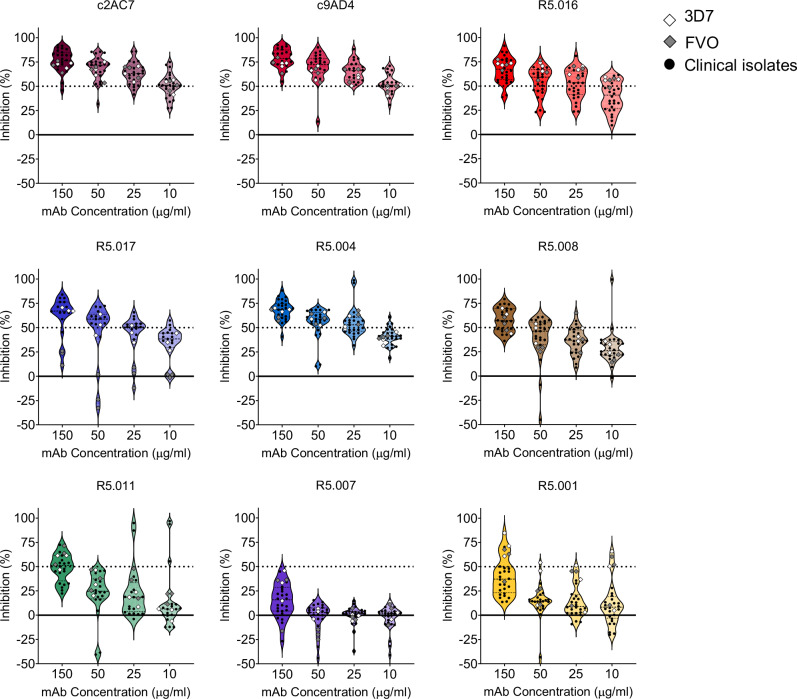
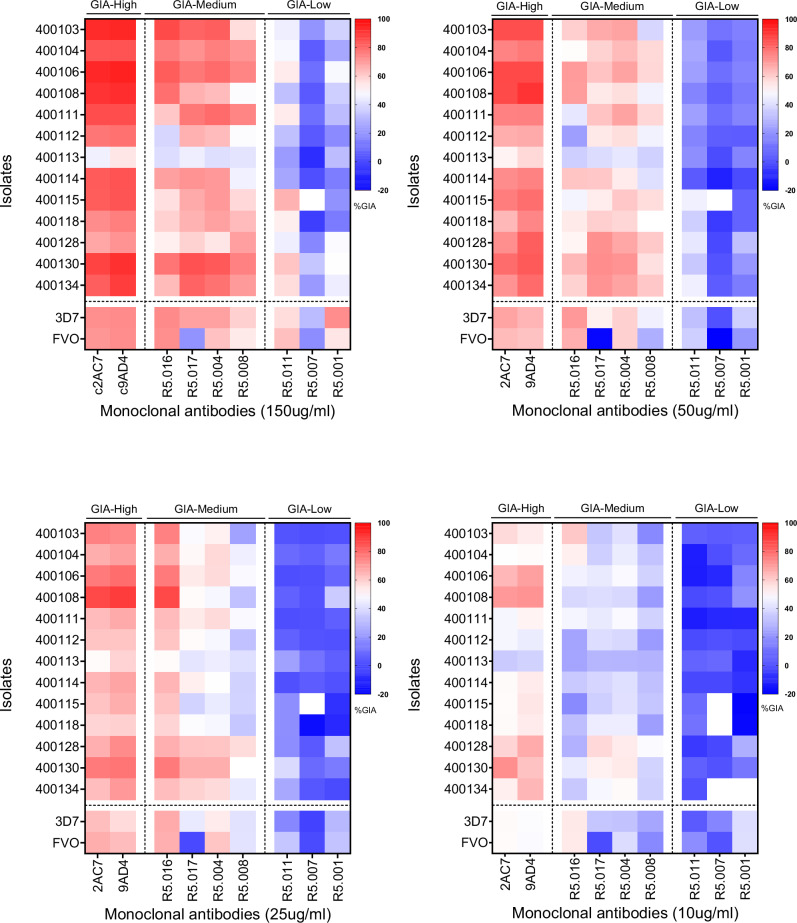
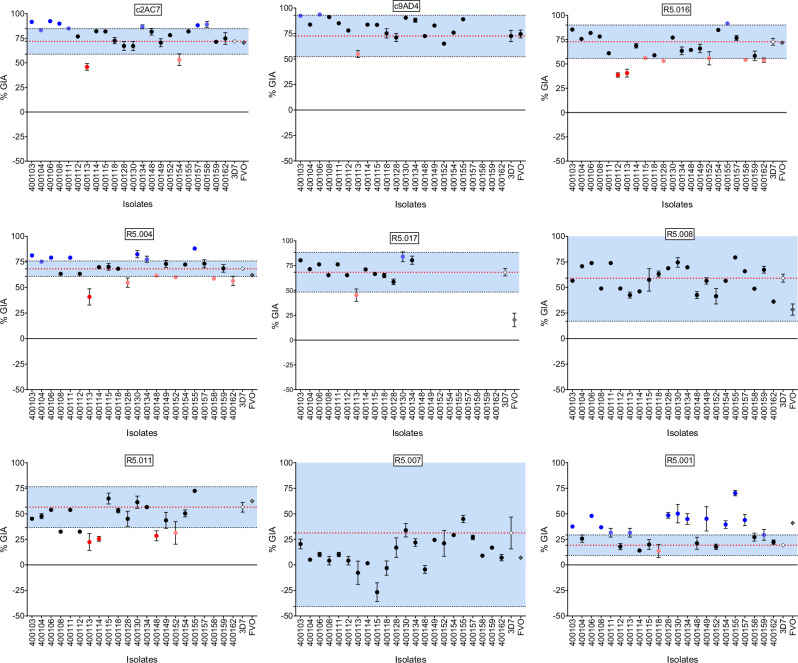
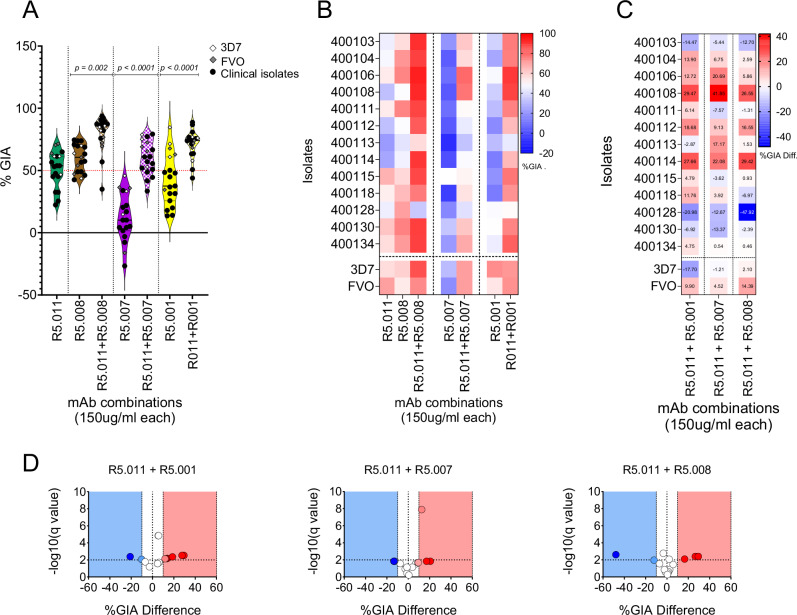
Vaccines to the Plasmodium falciparum reticulocyte binding-like protein homologue 5 (PfRH5) target the blood-stage of the parasite life cycle. PfRH5 has the potential to trigger the production of strain-transcendent antibodies and has proven its efficacy both in pre-clinical and early clinical studies. Vaccine-induced monoclonal antibodies (mAbs) to PfRH5 showed promising outcomes against cultured P. falciparum laboratory strains from distinct geographic areas. Here, we assessed the functional impact of vaccine-induced anti-PfRH5 mAbs on more genetically diverse P. falciparum clinical isolates. We used mAbs previously isolated from single B cells of UK adult PfRH5 vaccinees and used ex-vivo growth inhibition activity (GIA) assays to assess their efficacy against P. falciparum clinical isolates. Next-generation sequencing (NGS) was used to assess the breadth of genetic diversity in P. falciparum clinical isolates and to infer the genotype/phenotype relationship involved in antibody susceptibility. We showed a dose-dependent inhibition of clinical isolates with three main GIA groups: high, medium and low. Except for one isolate, our data show no significant differences in the mAb GIA profile between P. falciparum clinical isolates and the 3D7 reference strain, which harbors the vaccine allele. We also observed an additive relationship for mAb combinations, whereby the combination of GIA-low and GIA-medium antibodies resulted in increased GIA, having important implications for the contribution of specific clones within polyclonal IgG responses. While our NGS analysis showed the occurrence of novel mutations in the pfrh5 gene, these mutations were predicted to have little or no functional impact on the antigen structure or recognition by known mAbs. Our present findings complement earlier reports on the strain transcendent potential of anti-PfRH5 mAbs and constitute, to our knowledge, the first report on the susceptibility of P. falciparum clinical isolates from natural infections to vaccine-induced human mAbs to PfRH5.


Conflict of interest statement

KMc and SJD are inventors on patent applications relating to RH5 malaria vaccines and/or antibodies. All other authors have declared that no conflict of interest exists.

Figures

Fig. 1
Fig. 1. Ex-vivo assessment of P. falciparum clinical isolates’ susceptibility to anti-PfRH5 mAbs.
Growth inhibitory activities (GIA) of the panel of both vaccine-induced human and chimeric mouse mAbs were tested at different concentrations against ex-vivo cultured P. falciparum clinical isolates (black dots) or in-vitro cultured laboratory lines (diamond shapes). Shown within the violin plots are the mean percent GIA (dashed lines) and the 25th and 75th quartiles (dotted lines) of the clinical isolates. Colors were chosen to specifically match that of the previously reported epitope bins of the respective mAbs.
Fig. 2
Fig. 2. Classification of the GIA profiles of PfRH5-vaccine-induced mAbs against P. falciparum clinical isolates.
Heat maps presenting the percent GIA data of mAbs to PfRH5 tested at different concentrations (150; 50; 25 and 10 µg/ml). The GIA data from Fig. 1 were used to classify the mAbs in this panel into three main groups, GIA-high (GIA ≥ 75% at 150 µg/ml), GIA-medium (75% > GIA ≥ 50% at 150 µg/ml) or GIA-low (GIA < 50% at 150 µg/ml) separated by vertical dotted lines. Horizontal dotted lines depict the separation between P. falciparum clinical isolates and laboratory lines, presented in the y-axis of the graphs.
Fig. 3
Fig. 3. Variation of percent GIA ranges and immune susceptibility profiles of P. falciparum clinical isolates to PfRH5-vaccine-induced mAbs at 150 µg/ml.
Dot plots of %GIA to anti-PfRH5 mAbs (Y-axis) of P. falciparum clinical isolates (X-axis). The %GIA susceptibility ranges in blue are defined as the mean 3D7%GIA (red dotted line) ± 3 SD 3D7%GIA (black dotted lines). Black dots represent isolates laying within the defined susceptibility ranges. Red dots represent isolates reflecting a reduced GIA susceptibility phenotype (bright red) or laying at the borderline (dim red) of the lower limit of the defined susceptibility threshold. Blue dots represent isolates showing an increased GIA susceptibility (bright blue) or laying at the borderline (dim blue) of the upper limit of the defined susceptibility threshold.
Fig. 4
Fig. 4. Assessment of GIA in combinatorial assays of anti-PfRH5 mAbs tested against P. falciparum clinical isolates (N = 13).
A Violin plots showing percent GIA from combinations of R5.011 (green) with either R5.001 (yellow), R5.007 (purple) or R5.008 (brown). Depicted in the plots are the mean percent GIA (plain black line) and the 25th and 75th quartiles (dotted black lines). Here, mAbs were combined in equal concentrations and incubated with equal volumes of either P. falciparum clinical isolates (black dots) or laboratory lines (diamond shapes). The resulting GIA was compared to the single antibody at the same concentration. All assays were performed in duplicates and the data are presented as means from the two replicates. Statistical differences between antibody combinations and single antibody treatments were computed in GraphPad Prism using the Wilcoxon matched-pairs signed rank test. B Heat map showing the GIA profiles of antibody combinations (x-axis) against P. falciparum parasites (y-axis). The dotted vertical lines separate the different antibody combinations, while P. falciparum clinical isolates are separated from the laboratory lines by the horizontal dotted line. C heat maps and D Volcano plots depicting the difference between the Bliss additivity predicted percent GIA and the actual percent GIA from mAb combinations. Bliss analysis was calculated as previously described and the multiple unpaired t-test was used to assess the statistical difference. Volcano plots show −log10 of the q-values.
Fig. 5
Fig. 5. PfRh5-associated genetic diversity in P. falciparum clinical isolates from Kédougou (N = 22).
A Summary table showing the multiplicity of infections (MOI) per isolate determined through msp1-2 typing as well as the number of SNPs at each position (bold characters) and their respective read frequencies (shown in brackets). B The prevalence of PfRH5-associated SNPs was calculated as the percentage of SNPs detected within the total phenotyped sample population (N = 22). PfRH5 sequencing was performed from pfrh5 amplicons using the Illumina NovaSeq 6000 sequencing platform and variant analysis was performed using the Geneious Prime software version 23.1.1. SNPs displayed to the right of the dotted line represent SNPs present in a single sample. C SNP variant read frequencies in genomically complex samples were determined from the sequencing data outputs and calculated as the percentage of the variant read coverage relative to the coverage at the variant position. The red dotted line depicts the 2% threshold for variant allele frequency. The graphs were plotted using the GraphPad Prism version 1.0.2 software.
Fig. 6
Fig. 6. Structural threading of PfRH5-associated polymorphisms onto the BSG-PfRH5-PfCyRPA-mAbs complex.
A Distribution of identified SNPs, red spherical shapes, onto the PfRH5 structure. The model presented here was built by superposing the structure of PfRH5 in complex with BSG (4U0Q), PfCyRPA (6MPV), 9AD4 (4U0R), R5.004 and R5.016 (6RCU) and R5.011 and R5.016 (6RCV). BSG, PfRH5 and PfCyRPA ribbons are shown by light aqua, grey and light orange, respectively. Ribbons of the 9AD4, R5.004, R5.011 and R5.016 mAbs are depicted in dark red, blue, green and light red, respectively. B–H Sub panels highlighting the predicted effect of selected SNPs, the black dotted lines represent hydrogen bonds or salt bridges. From top-left to bottom-right: SNPs that potentially impact binding of PfRH5 and BSG (B), to enhance binding of PfRH5 to PfCyRPA (C), with no predicted function (D) or to alter the structure of PfRH5 E-G.

References

    1. Organization, W. H. World malaria report 2023. (2023).
    1. WHO, U. and. Reversing the Incidence of Malaria 2000–2015. WHO Glob. Malar. Program (2015).
    1. Cibulskis, R. E. et al. Malaria: Global progress 2000 - 2015 and future challenges. Infectious Diseases of Poverty10.1186/s40249-016-0151-8 (2016). - PMC - PubMed
    1. Balikagala, B. et al. Evidence of Artemisinin-Resistant Malaria in Africa. N. Engl. J. Med. 10.1056/nejmoa2101746 (2021). - PubMed
    1. Duffy, P. E. & Patrick Gorres, J. Malaria vaccines since 2000: progress, priorities, products. npj Vaccines5, 1–9 (2020). - PMC - PubMed

LinkOut - more resources