. 2024 Oct 24;15(1):9168.
doi: 10.1038/s41467-024-53348-5.

Structure, interaction and nervous connectivity of beta cell primary cilia

Affiliations

Structure, interaction and nervous connectivity of beta cell primary cilia

Andreas Müller et al. Nat Commun. .

Abstract

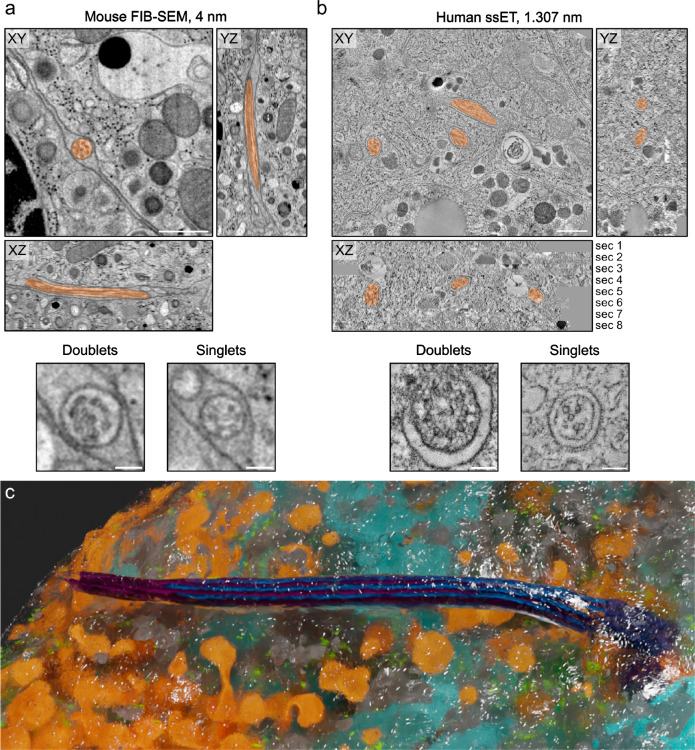
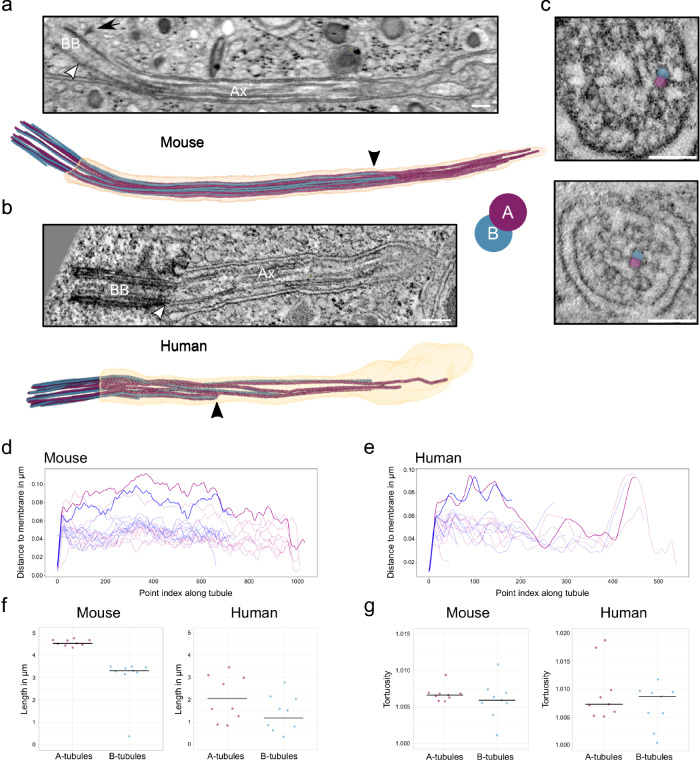
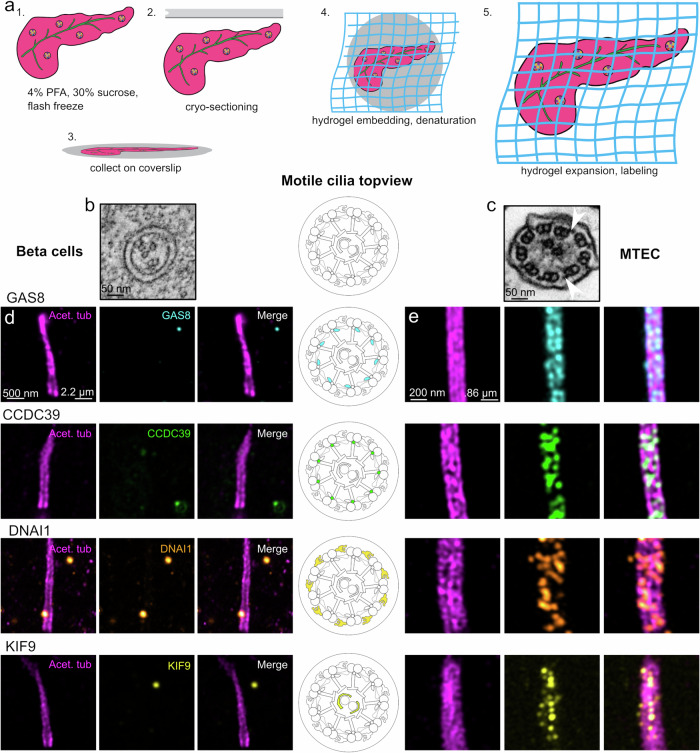
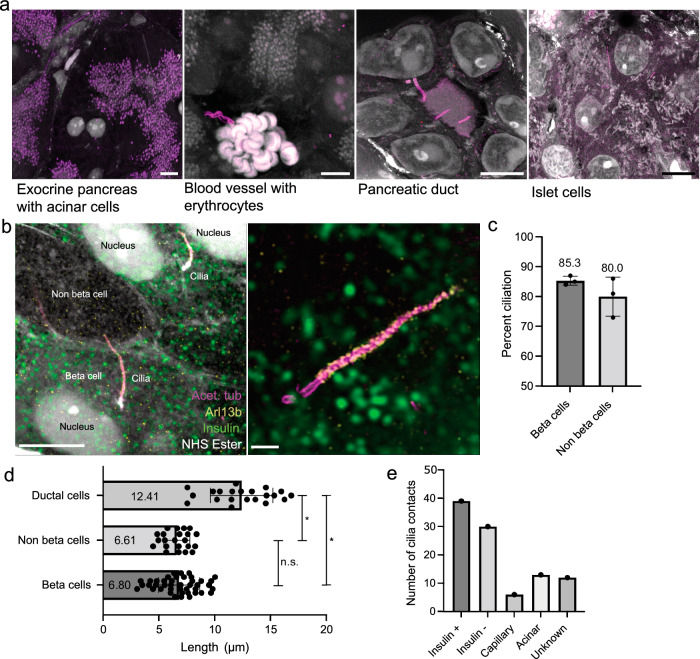
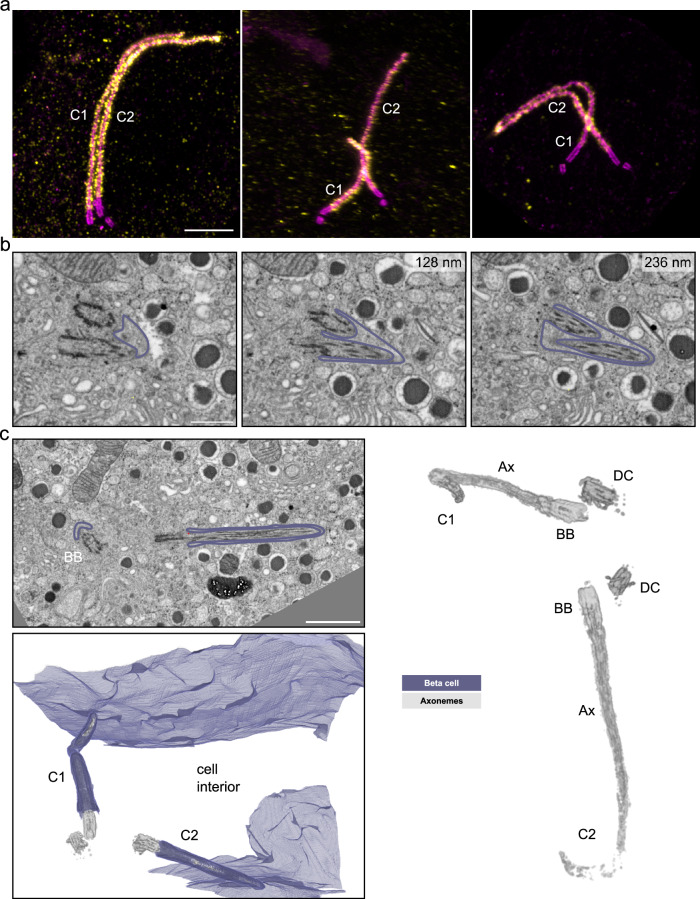
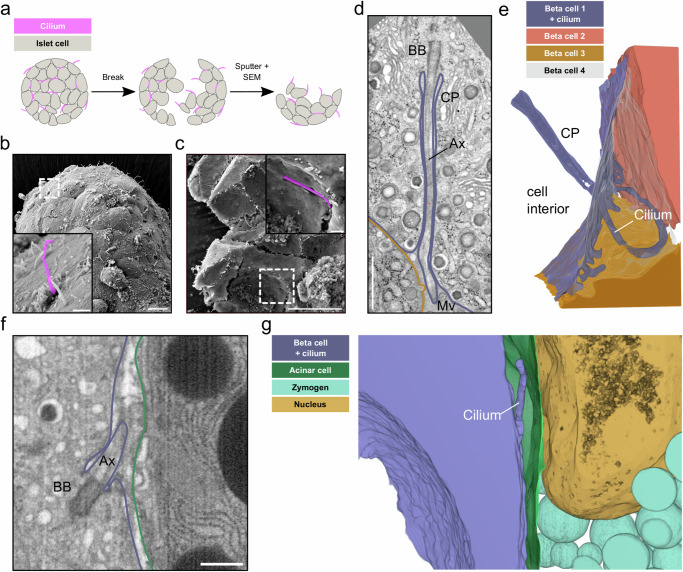
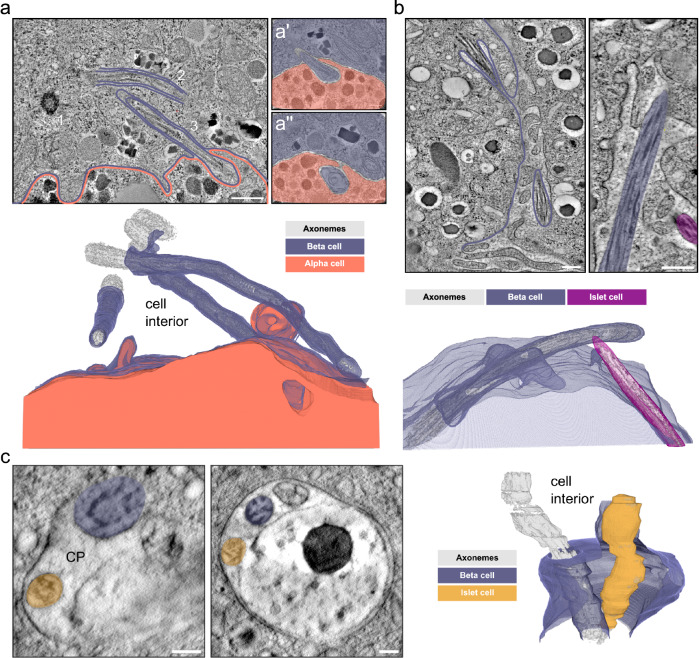
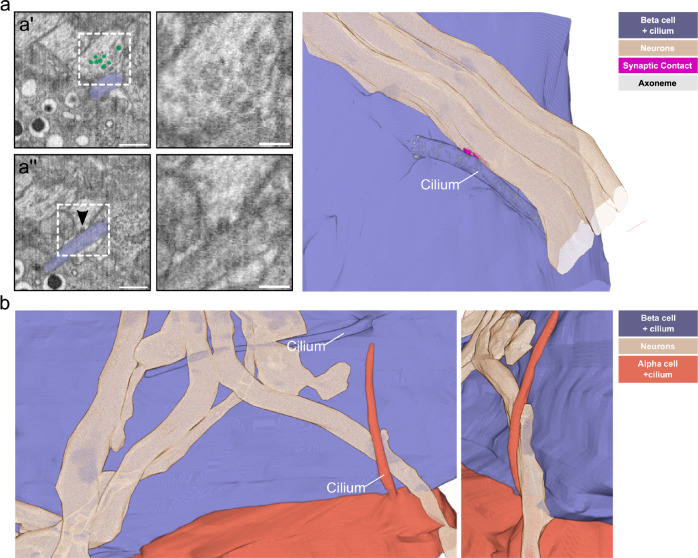
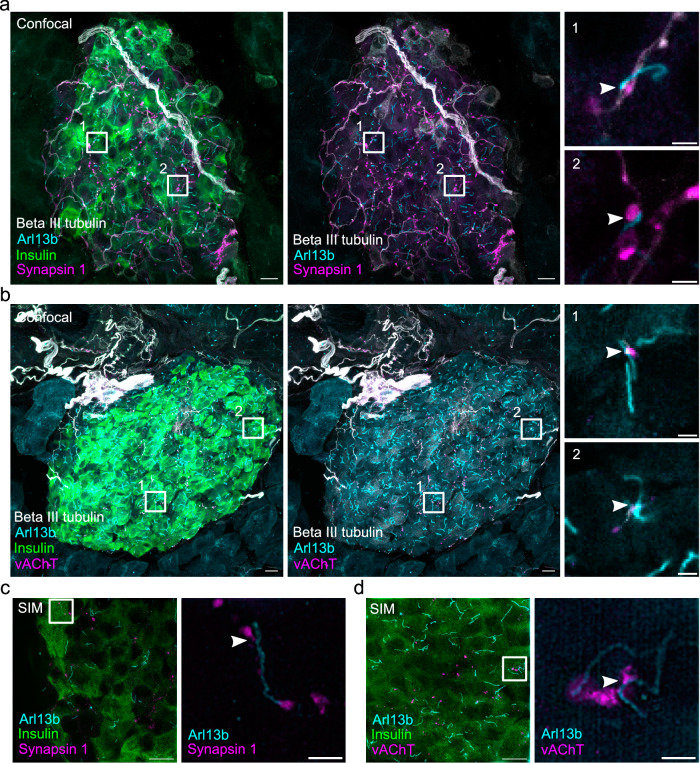
Primary cilia are sensory organelles present in many cell types, partaking in various signaling processes. Primary cilia of pancreatic beta cells play pivotal roles in paracrine signaling and their dysfunction is linked to diabetes. Yet, the structural basis for their functions is unclear. We present three-dimensional reconstructions of beta cell primary cilia by electron and expansion microscopy. These cilia are spatially confined within deep ciliary pockets or narrow spaces between cells, lack motility components and display an unstructured axoneme organization. Furthermore, we observe a plethora of beta cell cilia-cilia and cilia-cell interactions with other islet and non-islet cells. Most remarkably, we have identified and characterized axo-ciliary synapses between beta cell cilia and the cholinergic islet innervation. These findings highlight the beta cell cilia's role in islet connectivity, pointing at their function in integrating islet intrinsic and extrinsic signals and contribute to understanding their significance in health and diabetes.


Conflict of interest statement

C.S.X. and H.F.H. are the inventors of a US patent assigned to HHMI for the enhanced FIB-SEM systems used in this work: Xu, C.S., Hayworth, K.J., and Hess, H.F. (2020) Enhanced FIB-SEM systems for large-volume 3D imaging. US Patent 10,600,615, 24 Mar. 2020. The other authors declare no competing interests.

Figures

Fig. 1
Fig. 1. vEM resolves mouse and human beta cell primary cilia ultrastructure.
FIB-SEM of one isolated mouse islet (a) and ssET comprising 8 consecutive sections of pancreas tissue of one living human donor (b). Primary cilia are marked in transparent orange. Both imaging modalities resolve the organization of the axoneme with microtubule doublets and singlets. Scale bars overview: 500 nm, scale bars axonemes: 100 nm. c 3D rendering of a mouse beta cell and its primary cilium with microtubules (blue, purple), mitochondria (light blue), insulin SGs (orange), endoplasmic reticulum (gray), ribosomes (green), and plasma membrane (transparent with white edges).
Fig. 2
Fig. 2. The axoneme structure of primary cilia of mouse and human beta cells.
a FIB-SEM slice through one mouse beta cell primary cilium. White arrowhead indicates the termination of the basal body, black arrow indicates a distal appendage. BB: basal body, Ax: axoneme. Scale bar: 200 nm. Below is the corresponding 3D rendering with ciliary membrane (light orange), A-tubules (purple), and B-tubules (blue). The black arrowhead points to the termination of a B-tubule. b ssET slice through one human beta cell primary cilium. The white arrowhead indicates the termination of the basal body. BB basal body, Ax axoneme. Scale bar: 200 nm. The 3D rendering shows a human beta cell primary cilium from ssET volumes. The black arrowhead points to the termination of a B-tubule. c Displacement of microtubule doublets to the center of one human beta cell cilium. A- and B-tubules of the example doublet are highlighted in purple (A) and blue (B). Scale bar: 100 nm. d Distance of the microtubules of the mouse beta cell primary cilium to the cilium membrane. Doublets with a major transition are highlighted. e Distance of the microtubules of the human beta cell primary cilium to the cilium membrane. Doublets with a major transition are highlighted. f Length distributions of A- and B-tubules in respective segmentations of one mouse and one human beta cell primary cilium. g Tortuosity of A- and B-tubules in respective segmentations of one mouse and one human beta cell primary cilium. Source data are provided as a Source Data file.
Fig. 3
Fig. 3. Motility components do not localize to primary cilia of mouse beta cells.
a Schematic overview of pancreas U-ExM, including fixation, sectioning, collection, and expansion procedure. b Cross-sectional view of a beta cell primary cilium showing incomplete 9 + 0 organization. Scale bar: 50 nm. c Cross-sectional view of isolated mouse tracheal epithelium, displaying classic 9 + 2 organization. White arrows denote example outer dynein arms. Scale bar: 50 nm. d U-ExM images of beta cell cilia. Scale bar left, expansion factor corrected: 500 nm. Scale bar right, true scale: 2.2 µm. e U-ExM images of isolated mouse tracheal epithelium cilia (MTEC). Scale bar left, expansion factor corrected: 200 nm. Scale bar right, true scale, 0.86 µm. Cartoon indicates motility component localization in motile cilia. Component localization is determined by acetylated tubulin (magenta), GAS8 (cyan), CCDC39 (green), DNAI1 (hot orange), and KIF9 (yellow). U-ExM data were obtained from 2 individual mice.
Fig. 4
Fig. 4. U-ExM of mouse pancreas reveals cilia and cell type identity.
a Representative confocal images of expanded pancreatic tissues labeled with antibodies for acetylated tubulin (purple) and with NHS ester for total protein (white). Scale bars, 10 µm. b Higher-magnification images of ciliated islet cells, including beta cells, stained for insulin (green), acetylated tubulin (magenta), Arl13b (yellow), and NHS ester. Scale bar, left: 5 µm. Scale bar, right: 1 µm. c Quantification of percent ciliation in beta cells and non-beta cells within 3 islets from 3 different mice. 50 cells per islet were quantified. Mean ciliation percentage beta cells 85.3 % ± 1.528, non-beta cells, 80.0 % ± 6.557. Error is reported in standard deviation. d 3D length measurements of the cilium of ductal cilia, non-beta cells, and beta cells. Mean length: ductal cilia, 12.41 µm ± 2.8, non-beta cells 6.610 µm ± 1.158, beta cells 6.804 µm ± 1.841. Error is reported in standard deviation. Statistical significance is measured by unpaired, two-tailed, t-test. Ductal cells - beta cells: p = 1.11 × 10-13, ductal cells - non-beta cells: p = 3.44 × 10-11, beta cells - non-beta cells: p = 0.6546. n = 42 beta cells, 22 non-beta cells, 21 ductal cells from 2 pancreata. e Number of contacts of beta cell cilia to beta- and non-beta islet cells, as well as endothelial, acinar cells, and unknown cells. Source data are provided as a Source Data file.
Fig. 5
Fig. 5. Multiple cilia in beta cells.
a Expanded multiple islet cell cilia of one mouse pancreas stained by acetylated tubulin (magenta) and Arl13b (yellow). Scale bar: 1 µm. b Single FIB-SEM slices of one mouse pancreatic islet showing a beta cell containing two primary cilia sharing one ciliary pocket. The membrane is outlined in purple. Z-distances from the first image are indicated in the upper right of the following slices. Scale bar: 500 nm. c FIB-SEM data of one mouse pancreatic islet with a beta cell containing two primary cilia (C1 and C2) with distinct ciliary pockets. The cilia are pointing in opposite directions. The raw FIB-SEM slice shows the two cilia with basal bodies (BB) and membranes outlined in purple. Scale bar: 1 µm. The 3D rendering shows the plasma membrane in purple and the cilia microtubule structures in gray. The rendering on the right shows basal bodies (BB), daughter centrioles (DC), and axonemes (Ax) in gray.
Fig. 6
Fig. 6. Spatial restriction through ciliary pockets and neighboring cells.
a Schematic workflow of breaking dried islets for SEM. b SEM image of the surface of one isolated mouse islet with islet cell primary cilia projecting into the extracellular space. The inset shows a primary cilium highlighted in purple. Scale bar overview images: 10 µm, insets: 1 µm. c SEM image of one broken isolated islet with a primary cilium restricted by the ciliary pocket. The inset shows a magnified view with the primary cilium highlighted in purple. Scale bar overview images: 10 µm, insets: 1 µm. d A single slice of a FIB-SEM volume of one mouse pancreatic islet with a beta cell primary cilium with a long ciliary pocket (CP). The cilium extends towards the outside where it is surrounded by neighboring cells and microvilli (Mv). Ax: Axoneme, BB: Basal body. Scale bar: 1 µm. e 3D rendering of the segmentation shows the long ciliary pocket and the cilium (purple) surrounded by neighboring beta cells (orange, sand, gray). f A single slice of a FIB-SEM volume of one mouse pancreatic islet with a primary cilium of a beta cell on the edge of the islet close to the exocrine tissue. Scale bar: 500 nm. g Segmentation showing the beta cell primary cilium (purple) projecting into the extracellular space close to an acinar cell (green) with a nucleus (sand) and zymogen granules (light blue).
Fig. 7
Fig. 7. Cilia-cell and cilia-cilia interaction.
a Single tomographic slices of primary cilia in human islets from one donor. There are 3 cilia originating in a beta cell with the basal body of one cilium (1) and the axonemes of 2 other cilia visible in the slice (2 and 3, purple). The neighboring alpha cell is outlined in orange. In magnified views of distant slices through the tomogram (a’ and a”) the end of cilium 2 is visible protruding and extending into a neighboring alpha cell (orange). Axonemes, basal bodies, and centrioles are rendered in gray. Scale bars: 500 nm and 100 nm. b Single tomographic slices of mouse beta cells of one isolated mouse pancreatic islet with 2 primary cilia (purple and magenta) originating from a beta cell (purple) and another islet cell (magenta) meeting in the space between cells. The side view shows the axonemes of the cilia in close proximity. The 3D view shows the segmentation of ciliary and plasma membranes together with the axonemes. Scale bars: 200 nm. c Tomographic slices of a ssET volume of one mouse pancreatic islet showing a large ciliary pocket shared by a primary cilium originating from a beta cell (purple) and a primary cilium of unknown origin (yellow). The 3D rendering shows the interaction of the two cilia. Axonemes are in gray. Scale bars: 100 nm.
Fig. 8
Fig. 8. Islet cell primary cilia-neuron connections.
a A single slice of a FIB-SEM volume of one P7 mouse pancreas sample with an axon and a beta cell with a primary cilium (purple) in contact with each other. Scale bar: 1 µm. In a’, synaptic vesicles close to the cilium-neuron contact are highlighted in green. Scale bar: 500 nm. The boxed area is shown magnified in the right panel without highlighting the vesicles. Scale bar: 100 nm. The arrowhead in a” points to a synaptic vesicle likely undergoing exocytosis towards the cilium. Scale bar: 500 nm. The magnified image in the right panel shows the area of the fusion event. Scale bar: 100 nm. The 3D rendering shows the contact of a primary cilium (purple) with one of the axons (beige), including a segmentation of the synaptic density (magenta). b 3D rendering of primary cilia from a beta (purple) and an alpha cell (orange) in contact with the same axon (beige). The smaller image shows a tilted magnified view of the alpha cell cilium-axon interaction.
Fig. 9
Fig. 9. Presence of synapsin 1 and vAChT at neuron-cilia contact sites.
a Maximum intensity confocal images of a cryo section of mouse pancreas after immunofluorescence labeling for insulin (green), beta III tubulin (white), Arl13b (cyan), and synapsin 1 (magenta). The center image shows the same region without the insulin. Scale bars: 10 µm. Regions 1 and 2 show Arl13b in close proximity to beta III tubulin and synapsin 1 and single confocal slices of these regions are magnified on the right. Scale bars: 2 µm. b Maximum intensity confocal images of a cryo section of mouse pancreas after immunofluorescence for insulin (green), beta III tubulin (white), Arl13b (cyan), and vAChT (magenta). The center image shows the same region without the insulin. Scale bars: 10 µm. Regions 1 and 2 show Arl13b in close proximity to beta III tubulin and vAChT and single confocal slices of these regions are magnified on the right. Scale bars: 2 µm. c Maximum intensity SIM images of a cryo section of mouse pancreas after immunofluorescence labeling for insulin (green), Arl13b (cyan), and synapsin 1 (magenta). Scale bar: 10 µm. The magnified box shows a single SIM slice with Synapsin 1 signal in close proximity to Arl13b. Scale bar: 2 µm. d SIM image of a cryo section of mouse pancreas after immunofluorescence labeling for insulin (green), Arl13b (cyan), vAChT (magenta). Scale bar: 10 µm. The magnified box shows a single SIM slice with vAChT signal in close proximity to Arl13b. Scale bar: 2 µm. Data were obtained from 2 mouse pancreata. Source data are provided as a Source Data file.

References

    1. Caicedo, A. Paracrine and autocrine interactions in the human islet: more than meets the eye. Semin. Cell Dev. Biol.24, 11–21 (2013). - PMC - PubMed
    1. Evans, R. M. & Wei, Z. Interorgan crosstalk in pancreatic islet function and pathology. FEBS Lett.596, 607–619 (2022). - PMC - PubMed
    1. Hampton, R. F., Jimenez-Gonzalez, M. & Stanley, S. A. Unravelling innervation of pancreatic islets. Diabetologia65, 1069–1084 (2022). - PMC - PubMed
    1. Bonner-Weir, S. & Orci, L. New perspectives on the microvasculature of the islets of Langerhans in the rat. Diabetes31, 883–889 (1982). - PubMed
    1. Bonner-Weir, S. Morphological evidence for pancreatic polarity of beta-cell within islets of Langerhans. Diabetes37, 616–621 (1988). - PubMed

Publication types

LinkOut - more resources