. 2024 Oct 24;15(1):9171.
doi: 10.1038/s41467-024-53514-9.

Epigenetic modulation via the C-terminal tail of H2A.Z

Affiliations

Epigenetic modulation via the C-terminal tail of H2A.Z

László Imre et al. Nat Commun. .

Abstract

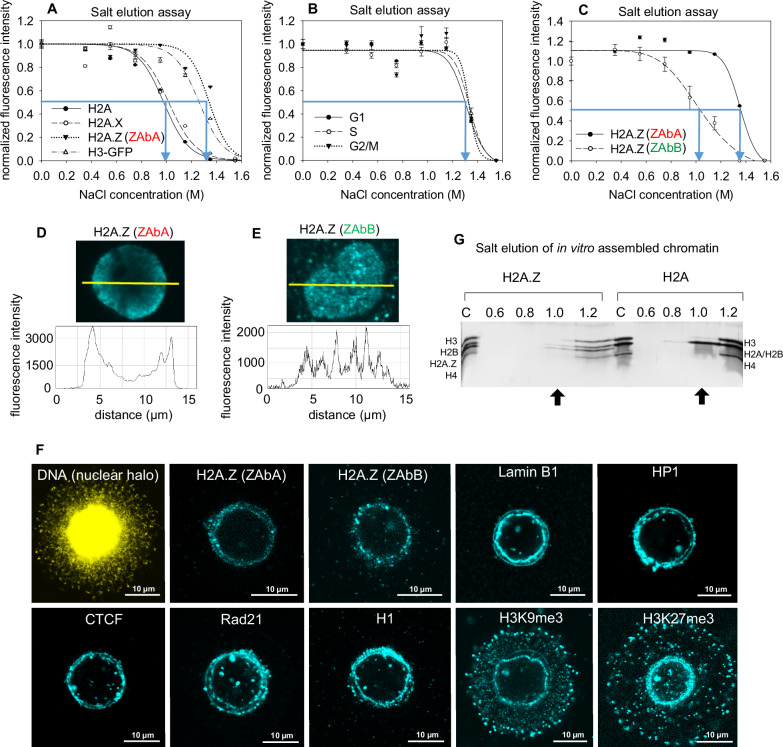
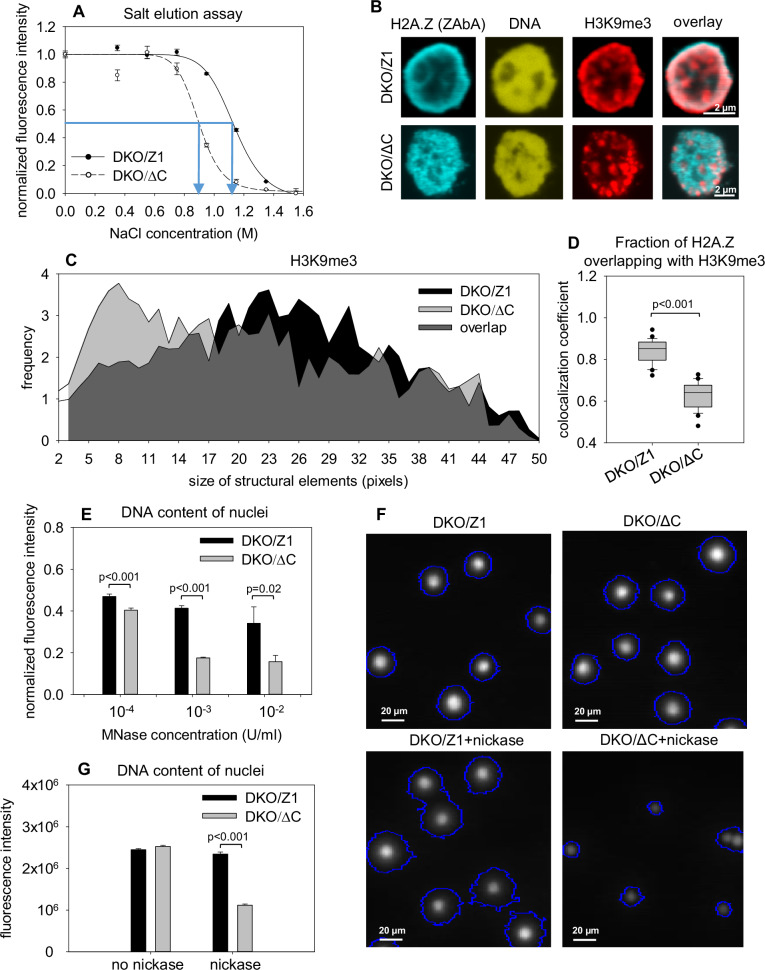
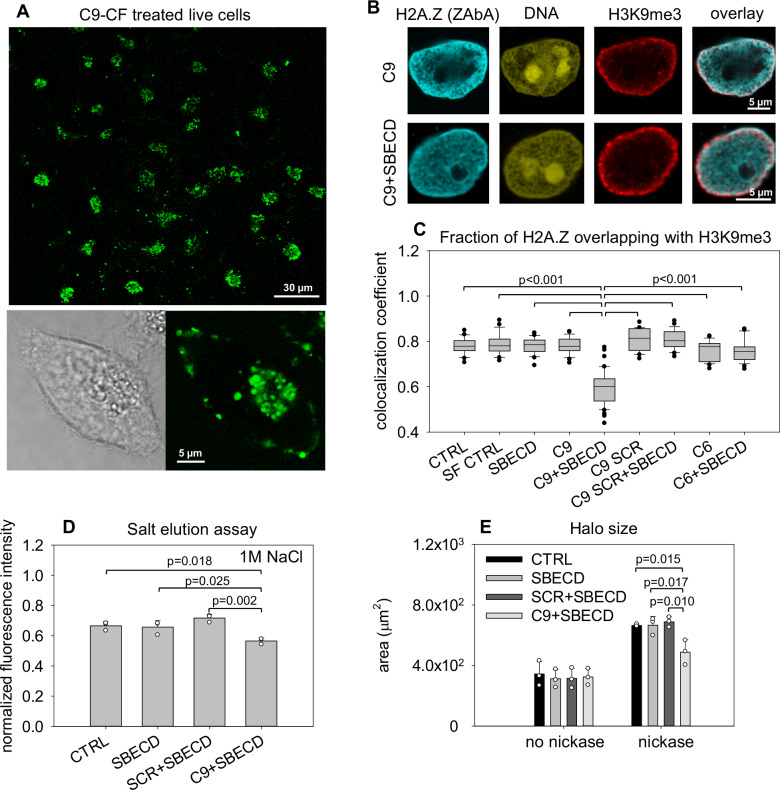
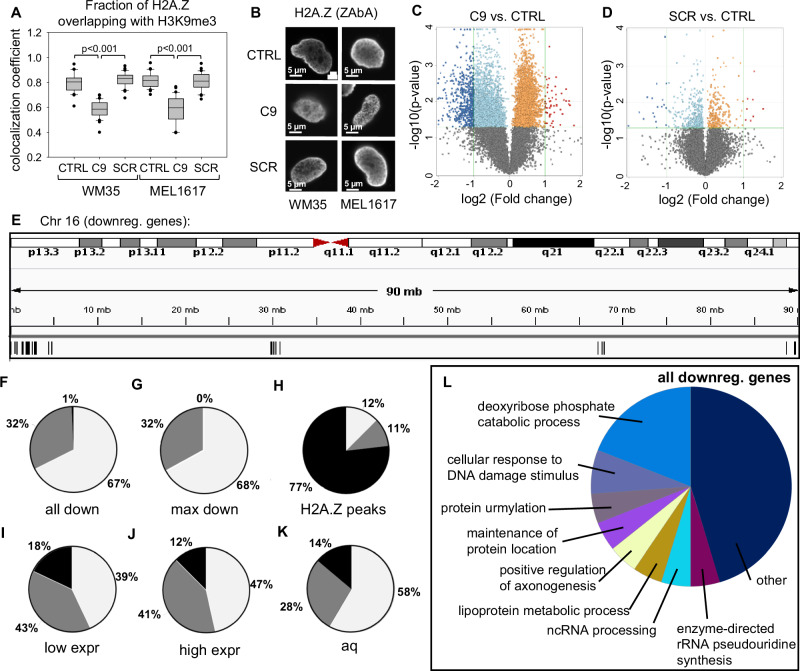
H2A.Z-nucleosomes are present in both euchromatin and heterochromatin and it has proven difficult to interpret their disparate roles in the context of their stability features. Using an in situ assay of nucleosome stability and DT40 cells expressing engineered forms of the histone variant we show that native H2A.Z, but not C-terminally truncated H2A.Z (H2A.Z∆C), is released from nucleosomes of peripheral heterochromatin at unusually high salt concentrations. H2A.Z and H3K9me3 landscapes are reorganized in H2A.Z∆C-nuclei and overall sensitivity of chromatin to nucleases is increased. These tail-dependent differences are recapitulated upon treatment of HeLa nuclei with the H2A.Z-tail-peptide (C9), with MNase sensitivity being increased genome-wide. Fluorescence correlation spectroscopy revealed C9 binding to reconstituted nucleosomes. When introduced into live cells, C9 elicited chromatin reorganization, overall nucleosome destabilization and changes in gene expression. Thus, H2A.Z-nucleosomes influence global chromatin architecture in a tail-dependent manner, what can be modulated by introducing the tail-peptide into live cells.


Conflict of interest statement

The authors declare no competing interests.

Figures

Fig. 1
Fig. 1. Intranuclear heterogeneity of H2A.Z.
A Comparison of the salt elution profiles, measured by QINESIn (as in Suppl. Fig. 1A), of H2A, H2A.X, H2A.Z (detected by the antibody ZAbA; Abcam, ab 97966) and of H3-GFP (used as an internal control) in HeLa nuclei. B Salt elution profile of H2A.Z detected by ZAbA in HeLa nuclei of different cell cycle phases. C Salt elution curves of H2A.Z detected by ZAbB (Thermo Fisher Sci.) and ZAbA, measured separately in HeLa nuclei. In (AC), the elution curves refer to G1 phase nuclei gated according to their DNA fluorescence intensity distribution and the error bars represent SEM of ~600 nuclei measured by LSC. Blue arrows on the elution curves indicate EC50 values (also in the other figures). D, E CLSM images and line-scans showing nuclear localization of H2A.Z as recognized by ZAbA (D), or by ZAbB (E). F IF staining of H2A.Z (using ZAbA or ZAbB), Lamin B1, HP1, CTCF, Rad21, H1, H3K9me3, and H3K27me3 in halo samples of HeLa nuclei. Representative images are shown. G Hydroxyapatite dissociation chromatography analyses of chromatin assembled in vitro using Xenopus laevis N1/N2- (H3, H4) and recombinant H2A/H2B or H2A.Z.1/H2B (see “Methods”). The H2A/H2B dimers run on the gel as a single band. See full gel image in Suppl. Fig. 3D. Arrows point at the histones eluted at 1 M salt.
Fig. 2
Fig. 2. Effect of C-terminal truncation on the salt sensitivity, nuclear localization and chromatin accessibility features.
A Salt elution profiles of nucleosomes in H2A.Z.1ΔC (DKO/ΔC) and H2A.Z.1 expressor DKO DT40 cells (DKO/Z1), detected by ZAbA. The elution curves refer to G1 phase nuclei gated according to their DNA fluorescence intensity distribution and the error bars represent SEM of ~600 nuclei measured by LSC. B Representative CLSM images showing the nuclear localization of H2A.Z recognized by ZAbA, and H3K9me3 co-labeled with H2A.Z in DKO H2A.Z.1ΔC (DKO/ΔC) and H2A.Z.1 (DKO/Z1) nuclei. C Texture analysis (see “Methods”) of ΔC (DKO/ΔC) and CTRL (DKO/Z1) nuclei showing the size distribution of structural elements containing H3K9me3 (see also Suppl. Fig. 11A–D). D Colocalization analysis of H2A.Z and H3K9me3 in ΔC (DKO/ΔC) and CTRL (DKO/Z1) nuclei. The Manders colocalization coefficient (MCC) values reflecting the fraction of H2A.Z overlapping with H3K9me3 are shown. Box-and-whisker plot was created from the data of 25 nuclei. For the expression levels of the proteins in the two cell lines, see Suppl. Fig. 11E. E MNase sensitivity of ΔC (DKO/ΔC) and CTRL (DKO/Z1) nuclei. Total DNA content per nuclei was measured by LSC before and after endonuclease treatment, as indicated on the figure. (F, G) Comparison of chromatin sensitivities to a frequent cutter nickase (Nt.CviPII). DNA content (G) and halo size (Suppl. Fig. 13B) of ΔC and CTRL nuclear halos were measured by LSC before and after nickase treatment of the nuclei (see “Methods”), as indicated on the figure. Error bars represent SEM of ~600 nuclei. Box-and-whisker plot shows the median, 25th and 75th percentiles as vertical boxes with error bars, 5th, 95th percentiles and outliers as dots (also in the other figures).
Fig. 3
Fig. 3. The effect of peptides representing the C-terminus of H2A.Z.1 on the stability, nuclear localization, and nuclease digestability of different nucleosomes.
A Stability of H2A.Z nucleosomes, measured as the residual ZAbA IF in permeabilized HeLa nuclei exposed to 1 M NaCl in the presence of different length peptides (C6-C9) compared to the control (no peptide). ~600 G1 nuclei were measured in each sample by LSC. Means +/− SD of 3 biological replicates are shown. B Representative CLSM images showing the localization of H2A.Z recognized by ZAbA and of H3K9me3 co-labeled with H2A.Z, in HeLa nuclei treated with C9 or the scrambled control peptide (SCR). C Colocalization analysis of H2A.Z and H3K9me3 on CLSM images from the experiment of (B). The MCC values representing the fraction of H2A.Z overlapping H3K9me3 are shown. Box-and-whisker plot was created from data of ~30 nuclei. D, E Global nickase sensitivity of HeLa nuclei after treatment with C9 or SCR, measuring DNA content based on SYBR Gold staining (D) or halo size (E), by LSC. Means +/− SD of 4 biological replicates are shown; events were collected from the whole cell population. FH Global MNase sensitivity of HeLa nuclei after treatment with SCR or C9, measuring DNA content (F; SYBR Gold-staining), H3K9me3 (G) and H3K4me3 IF (H) by LSC. Means +/− SD of 4 biological replicates are shown; events were collected from the whole cell population. I Contouring and calculation of mean pixel intensities at the nuclear periphery or in the center of HeLa nuclei used in the experiments of (JL). J Mean pixel intensities of PI-stained DNA measured at the periphery (PE) or in the center (CE) of HeLa nuclei after SCR or C9 treatment and without peptide addition (CTRL). Box-and-whisker plot was created from the data of 20 nuclei. K, L CLSM measurement of MNase sensitivity of SCR-, C9-pretreated and control HeLa nuclei, measuring PI-stained DNA in the center or at the periphery. The mean pixel intensities normalized to 0 U/ml MNase are shown; error bars represent the SEM of 20 nuclei.
Fig. 4
Fig. 4. Effect of C9 on euchromatic or heterochromatic regions in permeabilized nuclei analyzed by CUT&RUN combined with mass spectrometry.
A, B Venn-diagrams showing the number of H3K4me3 (A) and H3K9me3 (B) peaks detected in CUT&RUN experiments of C9-, SCR-treated and untreated (CTRL) samples of HeLa nuclei (see text as well as “Methods” for details). The pie charts show the distribution of the annotated C9-only peaks among major sequence categories, or the distribution of all the peaks in the untreated (CTRL) samples. Dark (C9) and light (CTRL) green areas: peaks localized at TSS+/− 1 kb. Brown and purple colors: peaks at distal intergenic regions and introns (For replica of Fig. 4B, see Suppl. Fig. 19B). C Volcano plot illustrating protein fold changes in the C9-treated sample compared to the untreated control identified by mass spectrometry in a ZAbA- pAG-MNase -CUT&RUN experiment using HeLa nuclei (see “Methods”). Proteins listed in Suppl. Table 4 are indicated.
Fig. 5
Fig. 5. FCS analysis of C9-CF binding to reconstituted mononucleosomes.
A Representative normalized autocorrelation functions (ACF-s) of C9-CF are shown; the correlation curves were acquired in the absence (red) or presence (green) of nucleosomes, at 700 mM NaCl concentration. Fits assuming triplet transition and a single diffusing species for a sample without nucleosomes and two diffusing populations with nucleosomes were used (black solid lines). The gray line indicates the fit excluding triplet state transition. τD1 and τD2 are the diffusion times of the fast and slow components, characterizing the diffusion of freely diffusing and nucleosome-bound C9-CF peptides, respectively. The ACF-s shifted toward slower diffusion times indicating the presence of a nucleosome-bound fraction. B Fit residuals. C Slow fraction of C9-CF. The peptide was incubated with nucleosomes at 5 mM or 700 mM NaCl concentration, with Cy5-labeled Widom-sequence at 5 mM or 700 mM NaCl, or with genomic DNA at 5 mM NaCl. The slow fraction ρ2 was calculated in ACF fits as described in the “Methods” and presented as a box-and-whisker plot.
Fig. 6
Fig. 6. Localization and effects of C9 peptide introduced into live HeLa cells by the cyclodextrin derivative SBECD.
A Localization of C9-CF (carboxyfluorescein conjugated C9) in live HeLa cells after 2 h treatment with C9-CF/SBECD followed by overnight culturing, as visualized by CLSM. Zoom-in image of a cell from the C9-CF/SBECD treated sample is shown at the bottom. B Representative confocal images of H2A.Z-H3K9me3 co-labeled nuclei following introduction of C9 into live HeLa cells. Cells were treated with the C9, C9 SCR or the C6 peptide using SBECD (C9 + SBECD, C9 SCR + SBECD or C6 + SBECD), or with serum-free medium in the absence of peptides and cyclodextrins (SF CTRL). C MCC values representing the fraction of H2A.Z overlapping with H3K9me3 calculated for the nuclei shown in (B). Box-and-whisker plots were created from the data of ~30 nuclei. D Resistance of H2A.Z nucleosomes to 1 M NaCl in permeabilized HeLa nuclei prepared from untreated, cyclodextrin-treated, SCR + SBECD- or C9 + SBECD-treated HeLa cells. Bar charts show the mean fluorescence intensity, error bars represent the SD of 3 biological replicates. E Measurement of chromatin sensitivity to nickase. Halo size of untreated (CTRL), SBECD-, SCR + SBECD- and C9 + SBECD-treated nuclei were measured by LSC before and after nickase treatment. Bar charts show the mean fluorescence intensities, error bars represent the SD of 3 biological replicates.
Fig. 7
Fig. 7. Effect of C9 treatment of live melanoma cell lines.
A Colocalization of H2A.Z and H3K9me3 in WM35 and MEL1617 cells treated with C9, SCR or left untreated (CTRL). MCC values representing the fraction of H2A.Z overlapping with H3K9me3 are shown. Box-and-whisker plots were created from the data of 30 nuclei. B CLSM images from the samples of (A) showing H2A.Z rearrangement. C, D Volcano plots showing differentially expressed genes defined as log2 (Fold change) < −1 or >+1.0 and p < 0.05 (dark blue and red dots). C9 vs. CTRL (C) and SCR vs. CTRL (D) data of MEL1617 cells are shown (See the volcano plot of the differentially expressed genes in SCR vs. C9 in Supplementary Fig. 26.). E IGV screenshot of the chromosome 16 ideogram. The genes down-regulated by C9 treatment are shown below. F Pie chart showing the distribution of all down-regulated genes among different Giemsa bands. G Pie chart showing the distribution of highly down-regulated genes (fold change <–2.35; ~1/3 of all down-regulated genes) among different Giemsa bands. H Pie chart showing the distribution of HeLa H2A.Z ChIP-seq peaks (downloaded from ENCODE database, accession ENCFF094MFL) among different Giemsa bands. I, J Pie charts showing the distribution of all expressed genes grouped by the expression level of the corresponding gene. Distribution of genes with low (<–0.2) and high (>0.5) expression in control MEL1617 cells are shown in (I) and (J), respectively. The distributions represented by the pie charts are normalized to the fraction of the corresponding areas in the genome. K Band localization of the genes significantly down- or upregulated spontaneously upon culturing of control MEL1617 cells. RNA-seq data from different thawed up aliquots (aq): see SRA BioProject PRJNA853352. L Functional characterization of the genes down-regulated by C9 (C9 vs SCR).

References

    1. Kreienbaum, C., Paasche, L. W. & Hake, S. B. H2A.Z’s ‘social’ network: functional partners of an enigmatic histone variant. Trends Biochem. Sci.47, 909–920 (2022). - PubMed
    1. Colino-Sanguino, Y., Clark, S. J. & Valdes-Mora, F. The H2A.Z-nuclesome code in mammals: emerging functions. Trends Genet.: TIG38, 273–289 (2022). - PubMed
    1. West, M. H. & Bonner, W. M. Histone 2A, a heteromorphous family of eight protein species. Biochemistry19, 3238–3245 (1980). - PubMed
    1. Bonisch, C. & Hake, S. B. Histone H2A variants in nucleosomes and chromatin: more or less stable? Nucleic Acids Res.40, 10719–10741 (2012). - PMC - PubMed
    1. Park, Y. J., Dyer, P. N., Tremethick, D. J. & Luger, K. A new fluorescence resonance energy transfer approach demonstrates that the histone variant H2AZ stabilizes the histone octamer within the nucleosome. J. Biol. Chem.279, 24274–24282 (2004). - PubMed

Publication types