. 2024 Oct 24;15(1):9175.
doi: 10.1038/s41467-024-53439-3.

Constitutive activation of two-component systems reveals regulatory network interactions in Streptococcus agalactiae

Affiliations

Constitutive activation of two-component systems reveals regulatory network interactions in Streptococcus agalactiae

Cosme Claverie et al. Nat Commun. .

Abstract

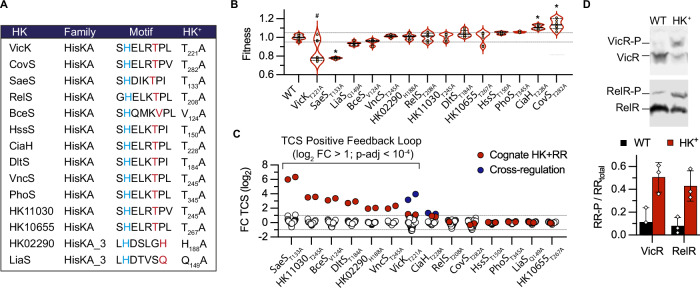
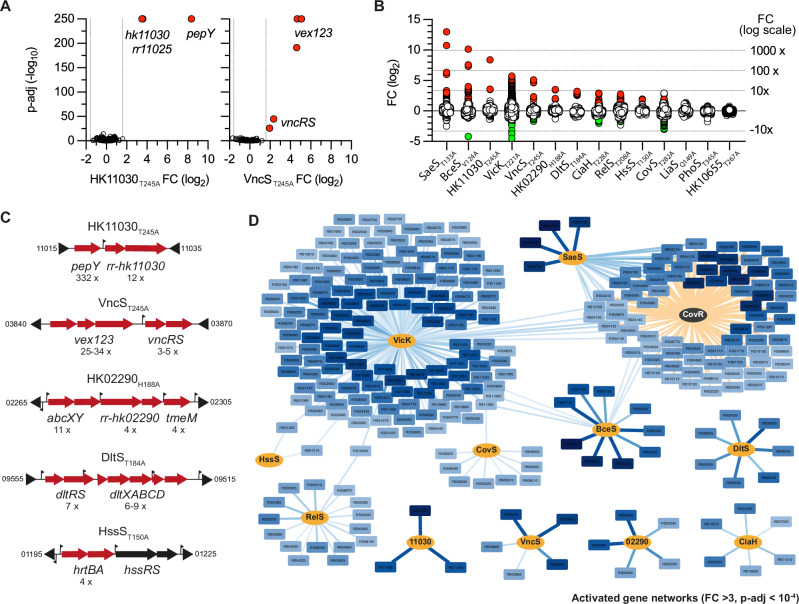
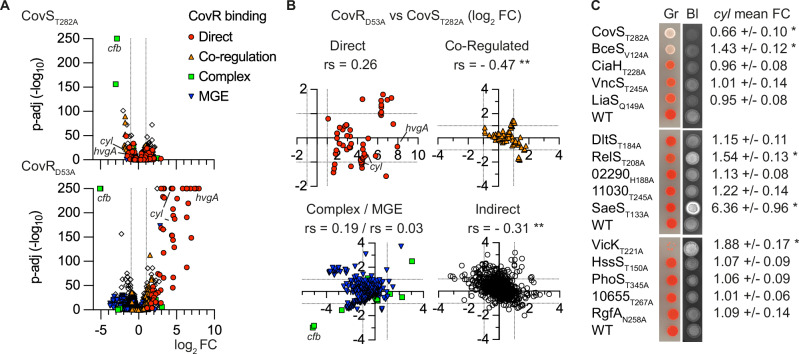
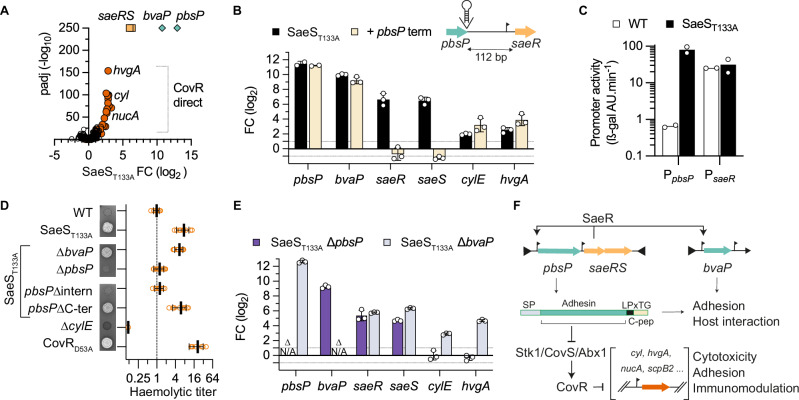
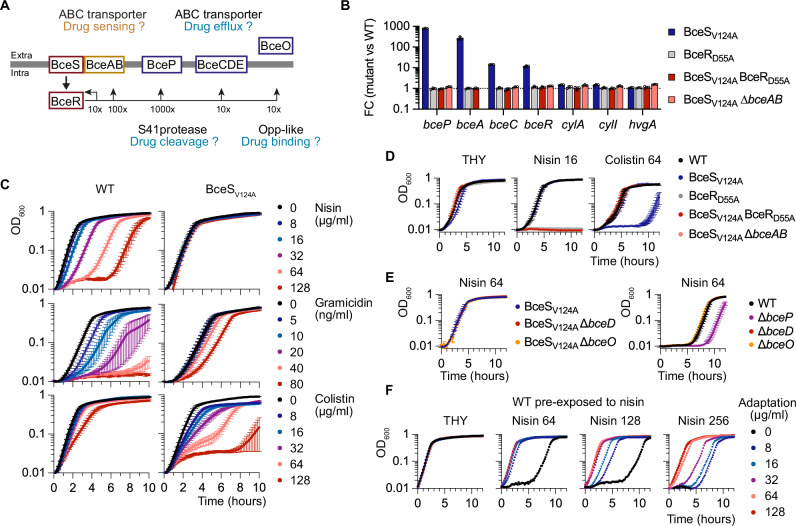
Bacterial two-component systems (TCSs) are signaling modules that control physiology, adaptation, and host interactions. A typical TCS consists of a histidine kinase (HK) that activates a response regulator via phosphorylation in response to environmental signals. Here, we systematically test the effect of inactivating the conserved phosphatase activity of HKs to activate TCS signaling pathways. Transcriptome analyses of 14 HK mutants in Streptococcus agalactiae, the leading cause of neonatal meningitis, validate the conserved HK phosphatase mechanism and its role in the inhibition of TCS activity in vivo. Constitutive TCS activation, independent of environmental signals, enables high-resolution mapping of the regulons for several TCSs (e.g., SaeRS, BceRS, VncRS, DltRS, HK11030, HK02290) and reveals the functional diversity of TCS signaling pathways, ranging from highly specialized to interconnected global regulatory networks. Targeted analysis shows that the SaeRS-regulated PbsP adhesin acts as a signaling molecule to activate CovRS signaling, thereby linking the major regulators of host-pathogen interactions. Furthermore, constitutive BceRS activation reveals drug-independent activity, suggesting a role in cell envelope homeostasis beyond antimicrobial resistance. This study highlights the versatility of constitutive TCS activation, via phosphatase-deficient HKs, to uncover regulatory networks and biological processes.


Conflict of interest statement

GT is an employee and CB is the founder and owner of Scylla Biotech Srl. The company did not provide funding and had no role in the design, conduct, or publication of the study. All other authors declare no competing interests.

Figures

Fig. 1
Fig. 1. Mutation of HK phosphatase catalytic residue activates TCS signalling.
A Conserved motif of the HisKA and HisKA_3 histidine kinases with the phospho-acceptor histidine (blue) and the predicted residue specifically involved in the phosphatase activity (red). The phosphatase residue is substituted by an alanine in the HK+ mutants. Genes ID, proteins ID, and alternative names of TCSs are provided in Supplementary Data 1. B Fitness of HK+ mutants. The violin plots represent the distribution of the relative doubling time (Fitness (F) = doubling time WT mean / doubling time mutant) in an exponential growth phase in THY with the median (bar) and the interquartile range (dashed lines). Individual dots are shown for biological replicate (n = 16 for the WT, n = 8 for mutants), and significant differences are highlighted (*, | F | > 0.1, two-tailed Mann Whitney test p < 10−4). The bimodal distribution due to the occurrence of faster-growing VicKT221A suppressors is highlighted (#). Corresponding growth curves and doubling times are shown in Supplementary Fig. 1. C Activation of transcriptional feedback loops in HK+ mutants. Fold changes (FC) for all genes encoding TCS (n = 41) in each HK+ mutant after RNA-seq analysis are shown as dots. The HK-RR gene pair in the corresponding HK+ mutant is highlighted in red (e.g., saeRS in SaeST133A). Cross-regulations, defined as significant differential expression of a TCS gene pair not corresponding to the HK+ mutation, are highlighted in blue (hk11050-rr11055 in VicKT221A and relRS in CiaHT228A). D Activation of the VicR and the RelR response regulators by phosphorylation in the corresponding HK+ mutants. Upper: representative Phos-Tag western-blots with anti-FLAG antibodies allowing to separate phosphorylated and non-phosphorylated forms of the ectopically expressed epitope-tagged RR. Bottom: quantification of the proportion of phosphorylated regulators in the WT (black) and the cognate HK+ mutant (red). Bars represent the mean with SD of biological replicate (n = 3). Source data are provided in Supplementary Data 4E for panel (C) and as a Source Data file for panels (B) and (D).
Fig. 2
Fig. 2. The activated gene regulatory networks.
A Volcano plot of significant differential gene expression in the HK11030T245A (left panel) and VncST245A (right panel) mutants. Transcriptomes by RNA-seq against the WT strain were done in the exponential growth phase in rich media (THY) with biological triplicates (n = 3). Statistical analysis with DeSeq2 included Benjamini and Hochberg multiple comparisons to adjust P-values. Red dots highlight significantly differentially regulated genes above the thresholds FC > 3, p-adj < 10−4. Volcano plots for all mutants are provided in Supplementary Fig. 2. B Violin distribution of transcriptional fold change in the 14 HK+ mutants. Coloured dots represent significantly activated (red) and repressed (green) genes ( | FC | > 3, p-adj <10−4), respectively. C Activated chromosomal loci in selected HK+ mutants. Fold changes are indicated below the activated genes (red arrows). Transcriptional start sites identified by genome-wide TSS mapping are represented by vertical flags. NCBI gene ID bordering the loci are shown in a shortened form (e.g., 11015 = BQ8897_RS11015). Activated loci for each HK+ mutant are provided in Supplementary Fig. 3. D Network of activated genes. Histidine kinases (orange nodes) are connected to their activated genes (light to dark blue nodes). Edge thickness and gene node colour are proportional to statistical significance and fold change, respectively. Activated genes in the CovRD53A mutant are included to account for the specificity of CovR as a global repressor (i.e., pale edges = CovR repression). Source Data for panels (A, B, C, and D) are provided in Supplementary Data 4.
Fig. 3
Fig. 3. Activation of the global repressor of virulence CovR.
A Volcano plot of significant fold changes in the CovR-active (CovST282A) and CovR-inactive (CovRD53A) mutants. RNA-seq analyses with biological triplicate (n = 3) were analysed with Benjamini and Hochberg multiple comparisons to adjust P-values. Coloured dots highlight genes according to CovR-regulatory mechanisms as previously defined by genome-wide binding: direct repression (red circles), CovR-binding requiring additional regulators for activation (orange triangle), atypical CovR-binding inside ORFs or positive regulation (green square), silencing or anti-silencing of genes in mobile genetic elements (inverted blue triangle). B Comparison of fold changes between CovR inactivation and activation according to regulatory mechanisms. Significant correlations are highlighted (**: rs non-parametric Spearman correlation, p (one-tailed) < 10−4). C Pigmentation and haemolytic phenotypes of the HK+ mutants on selective media. Spots of diluted cultures are incubated on Granada (Gr) and Columbia horse blood (Bl) plates in anaerobiosis and aerobiosis, respectively. Haemolytic activity is visualised by the dark halo on the inverted black-and-white photographs. The BM110 parental strain (WT) was added to each plate as a control. Note that the VicKT221A mutant does not grow on Granada media, the basis of this phenotype requiring further investigation. The mean RNA-seq fold change with SD of the 12 genes cyl operon encoding the pigmented haemolysin ß-h/c directly repressed by CovR is indicated, and statistical significance after Benjamini and Hochberg multiple comparison is highlighted (* p-adj < 0.005). Source data for all panels are provided as a Source Data file.
Fig. 4
Fig. 4. Adhesin-dependent wiring of the SaeR and CovR regulatory networks.
A Volcano plot of significant fold change in the SaeST133A mutant. RNA-seq analyses with biological triplicate (n = 3) were analysed with Benjamini and Hochberg multiple comparisons to adjust P-values. Dot colours highlight the stratification of activated genes between pbsP and bvaP (green), the saeRS operon (orange) and the CovR-regulated (red) genes. B Indirect positive feedback loop of the saeRS operon. The pbsP and saeRS genes are separated by a 112 bp intergenic region containing a saeR transcriptional start site located 31 bp from the SaeR start codon. Transcriptional activation of pbsP and saeRS is uncoupled by the integration of a canonical terminator at the 3’ end of pbsP. Fold changes of selected genes are quantified by RT-qPCR in the SaeST133A (black bars) and in the SaeST133A + pbsP terminator (light bars) mutants. Bars represent the mean with SD of biological replicate (n = 3). C Activities of the PpbsP and PsaeR promoters in the WT and SaeST133A mutant. Bars represent the activity of the ectopic ß-galactosidase reporter system under the control of the tested promoters in the WT (white bars) and the SaeST133A (black bars) mutant. Bars represent the mean of two biological duplicates (n = 2). D Hyper-haemolytic activity of the SaeST133A mutant is dependent on the PbsP adhesin. Qualitative and semi-quantitative haemolytic activity is tested on Columbia blood agar media and with defibrinated horse blood, respectively. The ∆cylE and CovRD53A mutants are included as negative and positive controls, respectively. Haemolytic titres are normalised against the WT strain. Individual data points from biological replicates (n = 10, except for WT n = 9, CovRD53A n = 8, and ∆cylE n = 4) are represented with their mean +/– SD. E Upregulation of the PbsP adhesin activates CovR-regulated genes. Transcriptional fold change of selected genes by RT-qPCR in the SaeST133ApbsP (light blue) and SaeST133AbvaP (dark blue) double mutants. Bars represent the mean with SD of biological replicate (n = 3). F Wiring diagram of the SaeRS signalling pathway. The saeRS operon is transcribed at a basal level by a constitutive promoter. Upon TCS activation, the SaeR regulator activates the transcription of genes encoding the PbsP and BvaP virulence factors and indirectly its own operon through a pbsP terminator readthrough. The over-expression of the PbsP adhesin domain, but not the carboxy-terminal part containing the LPxTG anchoring motif and the hydrophobic C-peptide, is necessary to trigger CovR-regulated virulence factor expression via the Stk1/CovS/Abx1 regulatory proteins. Source data for panel (A) are provided in Supplementary Data 4 and as a Source Data file for panels (B, C, D, and E).
Fig. 5
Fig. 5. The BceRS three-component system controls an adaptive response.
A Schematic of the BceRS signalling pathway. The RNA-seq fold change scale in the BceSV124A mutant is shown below the horizontal line. The BceAB transporter is the third component of the regulatory system, predicted to sense and transduce the signal to BceS. Functions currently assigned to each component are indicated by question marks with coloured frames indicating functional category (red: signalling; yellow: sensing and transmission; blue: drug resistance). B BceAB is necessary to activate BceRS signalling in the absence of drugs. Fold changes during exponential growth in rich media were quantified by RT-qPCR in the activated HK+ mutant (BceSV124A: blue), in mutants with a non-phosphorylable variant of the cognate regulator in the WT (BceRD55A: grey) or activated (BceSV124A BceRD55A: red) backgrounds, and in a BceAB transporter mutant in the activated background (BceSV124AbceAB: pink). Bars represent the mean and SD of biological replicates (n = 3). C Growth curves of the WT and activated BceSV124A mutant in the presence of an increasing concentration of drugs. The curves represent the mean and SEM of biological replicates (n = 4). D Drug susceptibilities of double mutants abolishing BceRS activation in the BceSV124A mutant. The curves represent the mean and SEM of biological replicates (n = 3). E Drug susceptibilities of ∆bceP, ∆bceD, and ∆bceO mutants in the activated mutants (left panel) and/or the WT strain (right panel). The curves represent the mean and SEM of biological replicates (n = 3). F Growth curves of the WT strain pre-exposed to nisin. Early exponential growing WT strains were exposed for 4 h to nisin (Adapt 0 to 128 µg/ml) in THY at 37 °C. After washing and OD600 normalisation, each culture is inoculated in fresh, rich media (THY) and with increasing concentrations of nisin (Nisin 64, 128, and 256 µg/ml). The curves represent the mean of two biological replicates (n = 2). Source data for all panels are provided as a Source Data file.

References

    1. Stock, A. M., Robinson, V. L. & Goudreau, P. N. Two-component signal transduction. Annu. Rev. Biochem.69, 183–215 (2000). - PubMed
    1. Groisman, E. A. Feedback control of two-component regulatory systems. Annu. Rev. Microbiol.70, 103–124 (2016). - PMC - PubMed
    1. Groisman, E. A., Duprey, A. & Choi, J. How the PhoP/PhoQ system controls virulence and Mg(2+) homeostasis: Lessons in signal transduction, pathogenesis, physiology, and evolution. Microbiol. Mol. Biol. Rev.85, e0017620 (2021). - PMC - PubMed
    1. Francis, V. I. & Porter, S. L. Multikinase networks: Two-component signaling networks integrating multiple stimuli. Annu. Rev. Microbiol.73, 199–223 (2019). - PubMed
    1. Sastry, A. V. et al. The Escherichia coli transcriptome mostly consists of independently regulated modules. Nat. Commun.10, 5536 (2019). - PMC - PubMed

Publication types

MeSH terms

Associated data

LinkOut - more resources