. 2024 Oct 24;8(1):242.
doi: 10.1038/s41698-024-00730-7.

Development and validation of a gene expression-based Breast Cancer Purity Score

Collaborators, Affiliations

Development and validation of a gene expression-based Breast Cancer Purity Score

Marco Barreca et al. NPJ Precis Oncol. .

Abstract

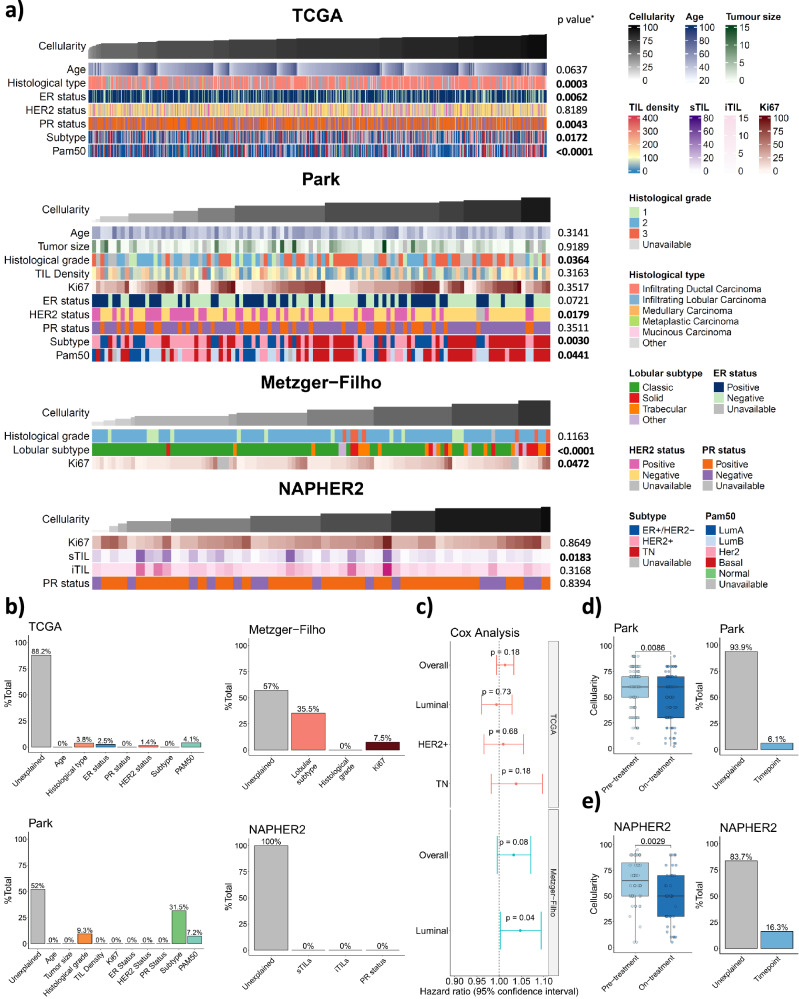
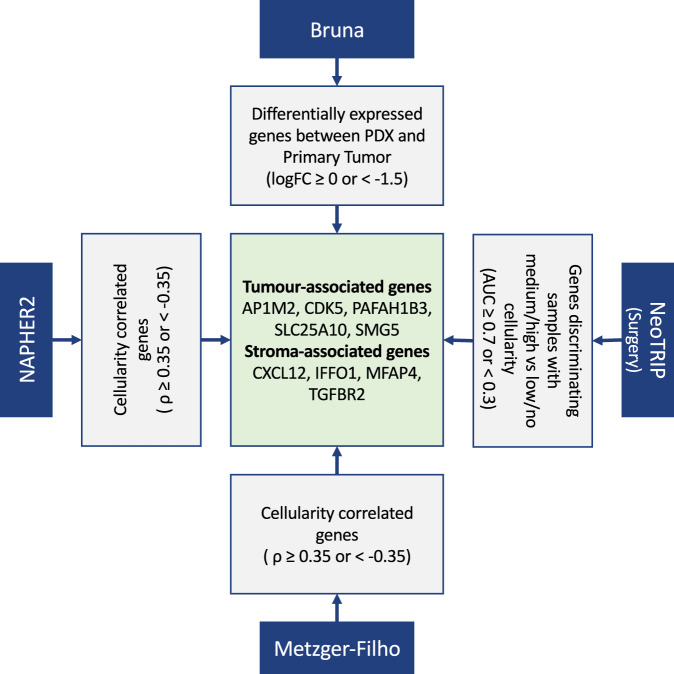
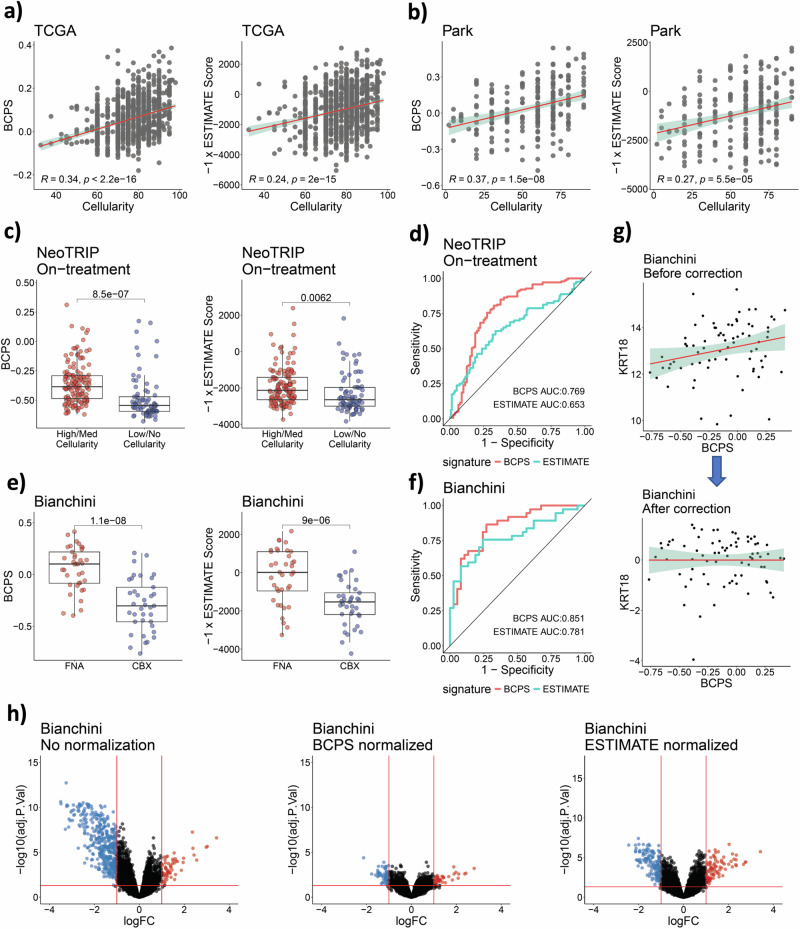
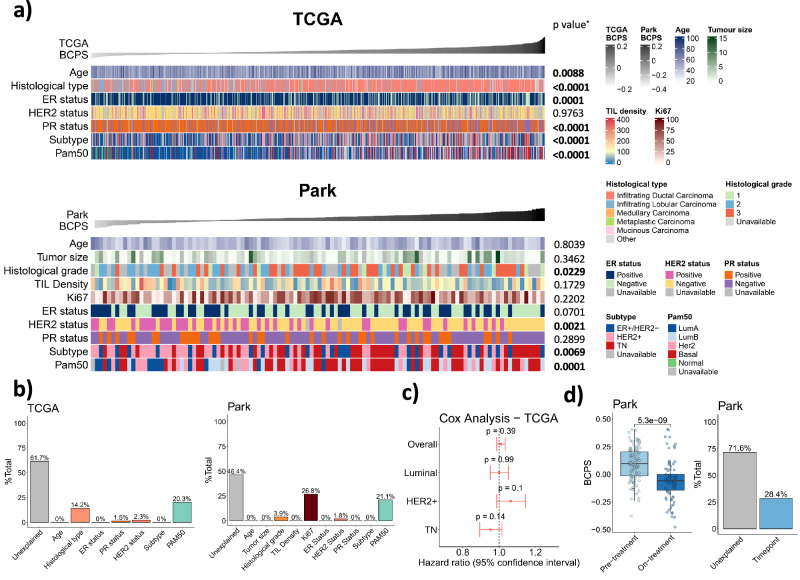
The prevalence of malignant cells in clinical specimens, or tumour purity, is affected by both intrinsic biological factors and extrinsic sampling bias. Molecular characterization of large clinical cohorts is typically performed on bulk samples; data analysis and interpretation can be biased by tumour purity variability. Transcription-based strategies to estimate tumour purity have been proposed, but no breast cancer specific method is available yet. We interrogated over 6000 expression profiles from 10 breast cancer datasets to develop and validate a 9-gene Breast Cancer Purity Score (BCPS). BCPS outperformed existing methods for estimating tumour content. Adjusting transcriptomic profiles using the BCPS reduces sampling bias and aids data interpretation. BCPS-estimated tumour purity improved prognostication in luminal breast cancer, correlated with pathologic complete response in on-treatment biopsies from triple-negative breast cancer patients undergoing neoadjuvant treatment and effectively stratified the risk of relapse in HER2+ residual disease post-neoadjuvant treatment.


Conflict of interest statement

The authors declare no competing interests.

Figures

Fig. 1
Fig. 1. Association of pathologist’s estimated tumour purity with molecular and clinico-pathological variables in breast cancer.
a Landscape of association of available molecular and clinico-pathological variables with cellularity in four breast cancer datasets: TCGA (n = 1073), Metzger-Filho (n = 117), Park (n = 112) and NA-PHER2 (n = 52) pre-treatment samples. (* association between purity and continuous variables was assessed by Spearman’s correlation, association with two categorical groups was assessed by Student’s t test, and association with multiple categorical groups was evaluated by one-way ANOVA). b Variance component analysis (VCA) for each dataset computed for samples with no missing information (TCGA, n = 690; Park, n = 72; Metzger-Filho, n = 111; NA-PHER2, n = 52). The analysis estimated the proportion of total variance explained by the provided variables. c Forest plot of Cox regression univariate analysis evaluating association of cellularity with overall survival in TCGA (n = 1073) and Metzger-Filho (n = 117) datasets. Samples were evaluated overall and stratified by subtype (TCGA: 426 Luminal, 162 HER2+, 113 TN; Metzger-Filho: 100 Luminal). d Cellularity changes in on-treatment biopsy (n = 86) compared to pre-treatment (n = 112) in the Park dataset. The impact of the timepoint on tumour purity was evaluated by Student’s t test and VCA. e Same analysis as in d for the NA-PHER2 dataset (n = 52, pre-treatment biopsy; n = 40, on-treatment biopsy).
Fig. 2
Fig. 2. BCPS generation.
Workflow involving four distinct datasets leading to the definition of the BCPS. In the NA-PHER2 and Metzger-Filho datasets, the correlation between tumour purity and the expression values of each gene was computed. In the Bruna dataset, primary tumours were compared to matched patient-derived xenografts to identify candidate tumour-specific and stroma-specific genes, exploiting the loss of human stroma during engraftment. In the NeoTRIP dataset, the ROC curve AUC was estimated for each gene considering surgical samples with medium/high or low/no cellularity, as annotated by expert pathologists. By applying for each analysis the indicated thresholds, 5 tumour-associated genes and 4 TME-associated genes were selected to generate the BCPS.
Fig. 3
Fig. 3. BCPS validation and comparison with ESTIMATE score.
Evaluation of the BCPS and comparison with ESTIMATE score in the TCGA, Park, NeoTRIP and Bianchini datasets. a Spearman’s correlation between the pathologist-estimated cellularity and either ESTIMATE or BCPS in TCGA (n = 1073). b Same analysis as in a for the Park dataset (n = 225). c ESTIMATE score and BCPS values measured in samples with high/medium tumour content or low/no tumour content in the NeoTRIP dataset (n = 219, on-treatment biopsy); two-sided Student’s t test. d ESTIMATE score and BCPS ability to discriminate between the two classes in c quantified by AUC. e ESTIMATE score and BCPS values measured in core biopsies (CBX) and matched fine-needle aspirations (FNA, n = 37 pairs) from the Bianchini dataset; two-sided Student’s t test. f ESTIMATE Score and BCPS ability to discriminate between the two classes in e quantified by AUC. g Example of KRT18 gene expression correction using the BCPS and linear regression to remove the impact of tumour purity. The Bianchini dataset was used. h Volcano plots of differential gene expression analysis between FNA and CBX samples of the Bianchini dataset. The analysis was performed without any correction and after normalising gene expression using the BCPS or ESTIMATE scores.
Fig. 4
Fig. 4. Association of the BCPS with clinico-pathological factors in the TCGA and Park datasets.
a Landscape of association of available molecular and clinico-pathological variables with cellularity in the TCGA (n = 1073) and Park (n = 112) datasets. (* association between purity and continuous variables was assessed by Spearman’s correlation, association with two categorical groups was assessed by Student’s t test, and association with multiple categorical groups was evaluated by one-way ANOVA). b Variance component analysis (VCA) for each dataset computed for samples with no missing information (TCGA, n = 690; Park, n = 72). The analysis estimated the proportion of total variance explained by the provided variables. c Forest plot of Cox regression univariate analysis evaluating cellularity association with overall survival in the TCGA (n = 1082) dataset. Samples were evaluated overall and stratified by subtype (426 Luminal, 162 HER2+, 113 TN). d Cellularity changes in on-treatment biopsy compared to pre-treatment in the Park dataset (T1 = 112, T2 = 86). The impact of the timepoint on tumour purity was evaluated by Student’s t test and VCA.
Fig. 5
Fig. 5. Use of the BCPS in breast cancer prognostication.
a, b In ER+/HER2− samples from the Brueffer dataset (n = 2277) 7-years overall survival was predicted using a multivariate Cox model with interactions including an ER and a Proliferation metagene with or without the BCPS. C-index (a) and 7-years AUC (b) were computed for the two models highlighting a performance improvement when the BCPS was included. c Association of the BCPS with pCR in on-treatment biopsies from the NeoTRIP dataset (n = 219). d BCPS quantified in the surgical samples of the NeoSPHERE trial was associated with DEFS. Two groups based on the BCPS median were identified and represented by Kaplan–Meier curves; differences were evaluated by log-rank test.

References

    1. Hanahan, D. & Weinberg, R. A. Hallmarks of cancer: The next generation. Cell144, 646–674 (2011). - PubMed
    1. Junttila, M. R. & de Sauvage, F. J. Influence of tumour micro-environment heterogeneity on therapeutic response. Nature501, 346–354 (2013). - PubMed
    1. Lou, S. et al. Comprehensive Characterization of Tumor Purity and Its Clinical Implications in Gastric Cancer. Front Cell Dev. Biol.9, 3843 (2022). - PMC - PubMed
    1. Zhang, C. et al. Tumor purity as an underlying key factor in glioma. Clin. Cancer Res.23, 6279–6291 (2017). - PubMed
    1. Aran, D., Sirota, M. & Butte, A. J. Systematic pan-cancer analysis of tumour purity. Nat. Commun.6, 8971 (2015). - PMC - PubMed

LinkOut - more resources