. 2025 Feb;31(2):534-543.
doi: 10.1038/s41591-024-03299-7. Epub 2024 Oct 24.

Subclassification of obesity for precision prediction of cardiometabolic diseases

Affiliations

Subclassification of obesity for precision prediction of cardiometabolic diseases

Daniel E Coral et al. Nat Med. 2025 Feb.

Erratum in

  • Author Correction: Subclassification of obesity for precision prediction of cardiometabolic diseases.
    Coral DE, Smit F, Farzaneh A, Gieswinkel A, Tajes JF, Sparsø T, Delfin C, Bauvin P, Wang K, Temprosa M, De Cock D, Blanch J, Fernández-Real JM, Ramos R, Ikram MK, Gomez MF, Kavousi M, Panova-Noeva M, Wild PS, van der Kallen C, Adriaens M, van Greevenbroek M, Arts I, Le Roux C, Ahmadizar F, Frayling TM, Giordano GN, Pearson ER, Franks PW. Coral DE, et al. Nat Med. 2025 Feb;31(2):695. doi: 10.1038/s41591-024-03403-x. Nat Med. 2025. PMID: 39572748 Free PMC article. No abstract available.

Abstract

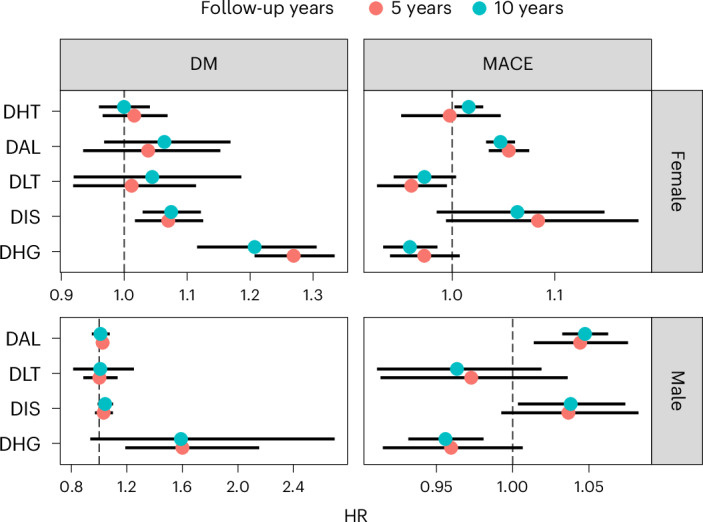
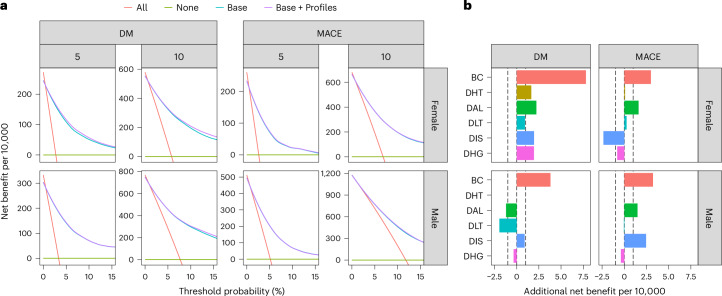
Obesity and cardiometabolic disease often, but not always, coincide. Distinguishing subpopulations within which cardiometabolic risk diverges from the risk expected for a given body mass index (BMI) may facilitate precision prevention of cardiometabolic diseases. Accordingly, we performed unsupervised clustering in four European population-based cohorts (N ≈ 173,000). We detected five discordant profiles consisting of individuals with cardiometabolic biomarkers higher or lower than expected given their BMI, which generally increases disease risk, in total representing ~20% of the total population. Persons with discordant profiles differed from concordant individuals in prevalence and future risk of major adverse cardiovascular events (MACE) and type 2 diabetes. Subtle BMI-discordances in biomarkers affected disease risk. For instance, a 10% higher probability of having a discordant lipid profile was associated with a 5% higher risk of MACE (hazard ratio in women 1.05, 95% confidence interval 1.03, 1.06, P = 4.19 × 10⁻¹⁰; hazard ratio in men 1.05, 95% confidence interval 1.04, 1.06, P = 9.33 × 10⁻¹⁴). Multivariate prediction models for MACE and type 2 diabetes performed better when incorporating discordant profile information (likelihood ratio test P < 0.001). This enhancement represents an additional net benefit of 4-15 additional correct interventions and 37-135 additional unnecessary interventions correctly avoided for every 10,000 individuals tested.


Conflict of interest statement

Competing interests: T.S. and C.D. are employees and shareholders of Novo Nordisk. M.F.G. has received financial and nonfinancial (in kind) support from Boehringer Ingelheim Pharma GmbH, JDRF International, Eli Lilly, AbbVie, Sanofi-Aventis, Astellas, Novo Nordisk A/S and Bayer AG, within European Union grant H2020-JTI-lMl2-2015-05 (grant agreement no. 115974 - BEAt-DKD). She has also received financial and in kind support from Novo Nordisk, Pfizer, Follicum, Coegin Pharma, Abcentra, Probi and Johnson & Johnson, within a project funded by the Swedish Foundation for Strategic Research on precision medicine in diabetes (LUDC-IRC, grant no. 15-0067). M.F.G. has received personal consultancy fees from Lilly and Tribune Therapeutics AB. M.P.-N. is an employee of Boehringer Ingelheim. Outside the submitted work, P.S.W. has received consulting fees from Astra Zeneca, research funding from Bayer AG, research funding, consulting and lecturing fees from Bayer Health Care, lecturing fees from Bristol Myers Squibb, research funding and consulting fees from Boehringer Ingelheim, research funding and consulting fees from Daiichi Sankyo Europe, consulting fees and nonfinancial support from Diasorin, nonfinancial research support from I.E.M., research funding and consulting fees from Novartis Pharma, lecturing fees from Pfizer Pharma, nonfinancial grants from Philips Medical Systems, and research funding and consulting fees from Sanofi-Aventis. C.L.R. reports grants from the Irish Research Council, Science Foundation Ireland, Anabio and the Health Research Board. He serves on advisory boards and speakers panels of Novo Nordisk, Roche, Herbalife, GI Dynamics, Eli Lilly, Johnson & Johnson, Glia, Irish Life Health, Boehringer Ingelheim, Currax, Zealand Pharma, Keyron, Astra Zeneca and Rhythm Pharma. C.L.R. is a member of the Irish Society for Nutrition and Metabolism outside the area of work commented on here. C.L.R. provides obesity clinical care in the My Best Weight clinic and Beyond BMI clinic and is a shareholder in these clinics. He was the chief medical officer and director of the Medical Device Division of Keyron in 2021. Both of these are unremunerated positions. C.L.R. was a previous investor in Keyron, which develops endoscopically implantable medical devices intended to mimic the surgical procedures of sleeve gastrectomy and gastric bypass. No patients have been included in any of Keyron’s studies and they are not listed on the stock market. C.L.R. was gifted stock holdings in September 2021 and divested all stock holdings in Keyron in September 2021. He continues to provide scientific advice to Keyron for no remuneration. Outside the submitted work, E.R.P. has received honoraria from Novo Nordisk, Lilly and Illumina. Within the past five years, P.W.F. has received consulting honoraria from Eli Lilly Inc., Novo Nordisk Foundation, Novo Nordisk A/S, UBS and Zoe Ltd, has been an employee of the Novo Nordisk Foundation, and has been on advisory boards for the Danish Diabetes and Endocrine Academy, Novo Nordisk A/S, Hamad Medical Corporation and Zoe Ltd. P.W.F. has also received investigator-initiated grants (paid to institution) from numerous pharmaceutical companies as part of the Innovative Medicines Initiative of the European Union. The other authors declare no competing interests.

Figures

Fig. 1
Fig. 1. Study workflow.
Flowchart depicting the overall steps in our analysis of BMI–biomarker discordance, with details about the ensemble of algorithms used to partition BMI–biomarker discordance into probabilistic profiles. PCA, principal components analysis.
Fig. 2
Fig. 2. Characteristics of concordant and discordant profiles.
Discordant profiles discovered in the UKB and robustly replicated across three independent cohorts. a, UMAP 2D projection. Colors denote profile allocations. b, Cluster weights. c, Forest plot of average biomarker residuals characterizing each profile. Points and error bars represent estimates and 95% confidence intervals of average residual values of each biomarker. The dashed line represents a residual of 0. Female sample sizes: UKB = 77,207; TMS = 1,542; RS = 5,704; GHS = 7,301. Male sample sizes: UKB = 67,904; TMS = 1,633; RS = 4,289; GHS = 7,353. DBP, diastolic blood pressure; SBP, systolic blood pressure; SCR, serum creatinine; WHR, waist-to-hip ratio.
Fig. 3
Fig. 3. Estimated biomarker change per BMI unit increase within each profile.
Pooled estimates and 95% CI of the change in each biomarker corresponding to a BMI unit increase within each profile. Estimates were derived using random effects meta-analysis across studies. Areas shaded in pink correspond to the CI around the estimate of the BC profile. The dashed line represents the null association. Female sample size = 91,754; male sample size = 81,178.
Fig. 4
Fig. 4. Association of discordant profiles with prevalent comorbidities and medication.
a, OR and 95% CI of selected conditions in discordant profiles relative to the concordant profile, unadjusted and adjusted for medication (lipid-lowering, antidiabetic and antihypertensive). The dashed line represents the null association. b, OR and 95% CI of selected medications in discordant profiles relative to the concordant profile. c, Comparison of the proportions of concordant and discordant profiles in individuals without the selected conditions against all individuals in UKB. The dashed line represents the null association. Female sample size = 91,754; male sample size = 81,178. AntiHT, antihypertensives; HT, hypertension; LipidLower, lipid-lowering medication; RA, rheumatoid arthritis.
Fig. 5
Fig. 5. Hazard ratios of discordant profiles.
HR estimates and 95% CI associated with shifting 10% probability from the concordant to each of the discordant clusters, derived from a random effects meta-analysis across cohorts. Pooled female sample sizes: MACE = 85,392; DM = 46,076. Pooled male sample sizes: MACE = 70,328; DM = 38,815.
Fig. 6
Fig. 6. Decision curve analysis of discordant profiles.
a, Decision curves comparing the net benefit of using various strategies at different thresholds of disease probability up to 15%. b, Distribution of gains in net benefit at threshold for intervention of 10% risk of disease at 10 years. Dashed vertical lines are unit gain and unit loss in net benefit per 10,000 individuals assessed. Base, initial prediction model incorporating baseline clinical data; Base + Profiles, second prediction model incorporating baseline clinical data and profile information.
Extended Data Fig. 1
Extended Data Fig. 1. Distribution of BMI and biomarkers per cohort.
a. Boxplots showing the distribution of continuous variables across cohorts. In each boxplot, the centre represents the median, the bounds of the box represent the interquartile range, and the whiskers represent the 2.5 and 97.5 percentiles. b. Proportion of current smokers in each cohort. Female sample sizes: UKB = 77,207; TMS = 1,542; RS = 5,704; GHS = 7,301. Male sample sizes: UKB = 67,904; TMS = 1,633; RS = 4,289; GHS = 7,353. WHR: waist-to-hip ratio. SBP: systolic blood pressure. DBP: diastolic blood pressure. ALT: alanine transaminase. SCR: serum creatinine. CRP: C-reactive protein. HDL: high-density lipoprotein. TG: triglycerides. LDL: low-density lipoprotein. FG: fasting glucose.
Extended Data Fig. 2
Extended Data Fig. 2. UMAP projections of BMI-biomarker discordance across cohorts.
Two-dimension projections derived from the UMAP algorithm. GHS: Gutenberg Health Study, TMS: Maastricht Study, RS: Rotterdam Study, UKB: UK Biobank.
Extended Data Fig. 3
Extended Data Fig. 3. Discordant profile centres across cohorts.
These centres were obtained by running the clustering approach on the 4 cohorts separately. Points represent average residual values within each profile, and the lines depict the distance from the null residual value. WHR: waist-to-hip ratio. TG: triglycerides. SCR: serum creatinine. SBP: systolic blood pressure. LDL: low-density lipoprotein. HDL: high-density lipoprotein. FG: fasting glucose. DBP: diastolic blood pressure. CRP: C-reactive protein. ALT: alanine transaminase.
Extended Data Fig. 4
Extended Data Fig. 4. Validation of discordant profiles identified in UK Biobank.
Nodes are clusters found by running our clustering algorithm in each cohort separately. The numbering is the same as in Extended Data Figure 3. Edges are drawn between a cluster from the UKB model and a cluster from another cohort if the subset of individuals with high probability to be allocated to the UKB cluster (>80%) have also a high median probability (>80%) to be allocated to the cluster from the other cohort. Only UKB clusters with edges to 3 clusters from each of the other cohort were considered replicated. GHS: Gutenberg Health Study, TMS: Maastricht Study, RS: Rotterdam Study, UKB: UK Biobank.

References

    1. World Obesity Atlas 2023. World Obesitydata.worldobesity.org/publications/?cat=19 (2023).
    1. Pantalone, K. M. et al. Prevalence and recognition of obesity and its associated comorbidities: cross-sectional analysis of electronic health record data from a large US integrated health system. BMJ Open7, e017583 (2017). - PMC - PubMed
    1. Gradmark, A. M. I. et al. Computed tomography-based validation of abdominal adiposity measurements from ultrasonography, dual-energy X-ray absorptiometry and anthropometry. Br. J. Nutr.104, 582–588 (2010). - PubMed
    1. Prillaman, M. Why BMI is flawed — and how to redefine obesity. Nature622, 232–233 (2023). - PubMed
    1. Rothman, K. J. BMI-related errors in the measurement of obesity. Int. J. Obes.32, S56–S59 (2008). - PubMed

LinkOut - more resources