. 2025 Feb;32(2):353-368.
doi: 10.1038/s41418-024-01390-7.

RIP1 inhibition protects retinal ganglion cells in glaucoma models of ocular injury

Affiliations

RIP1 inhibition protects retinal ganglion cells in glaucoma models of ocular injury

Bo Kyoung Kim et al. Cell Death Differ. 2025 Feb.

Abstract

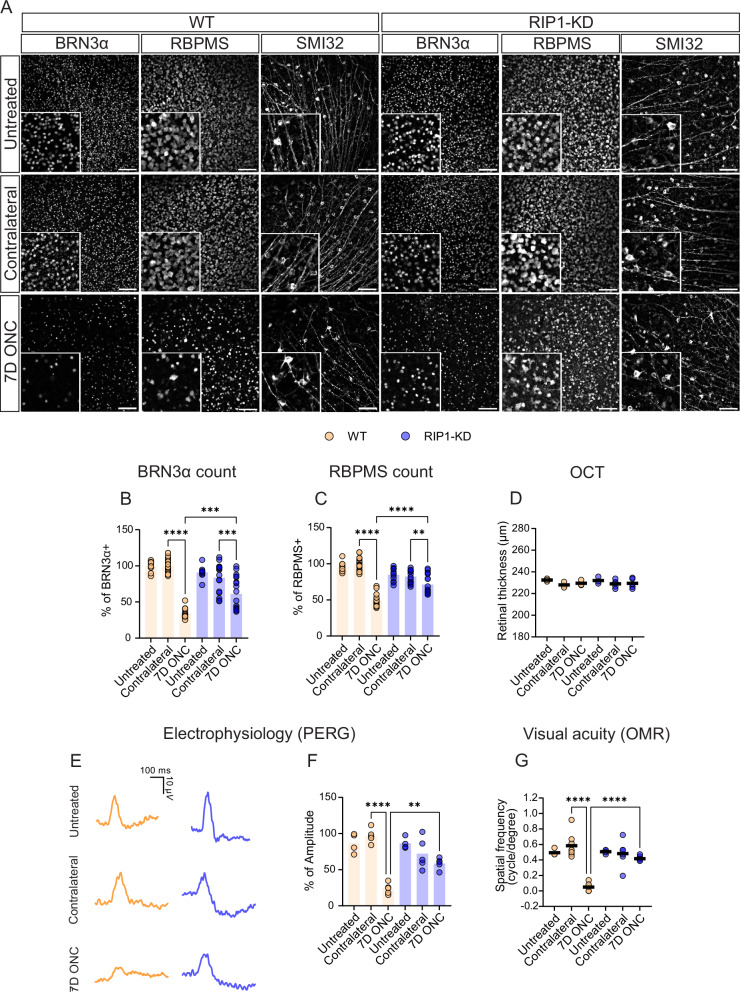
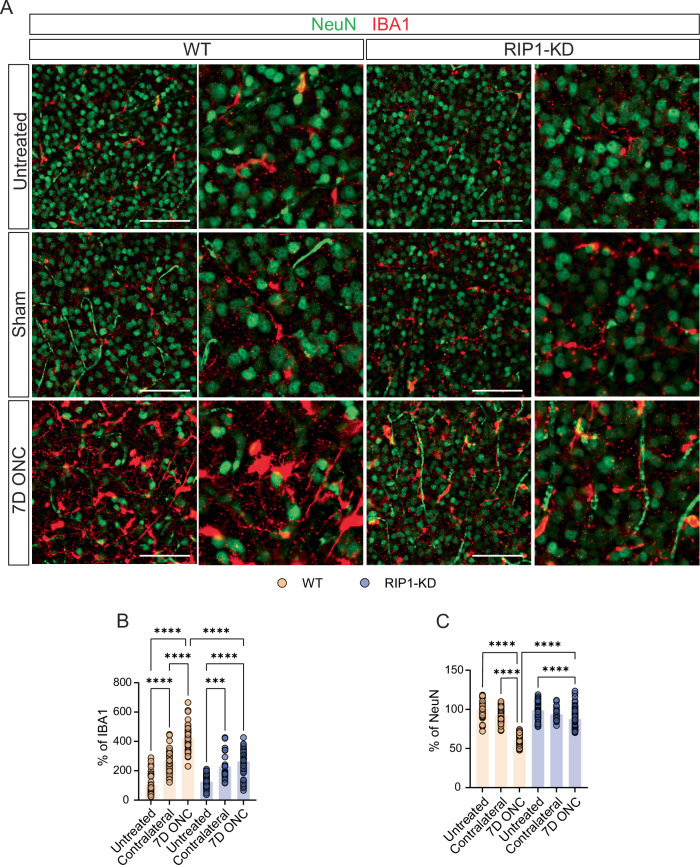
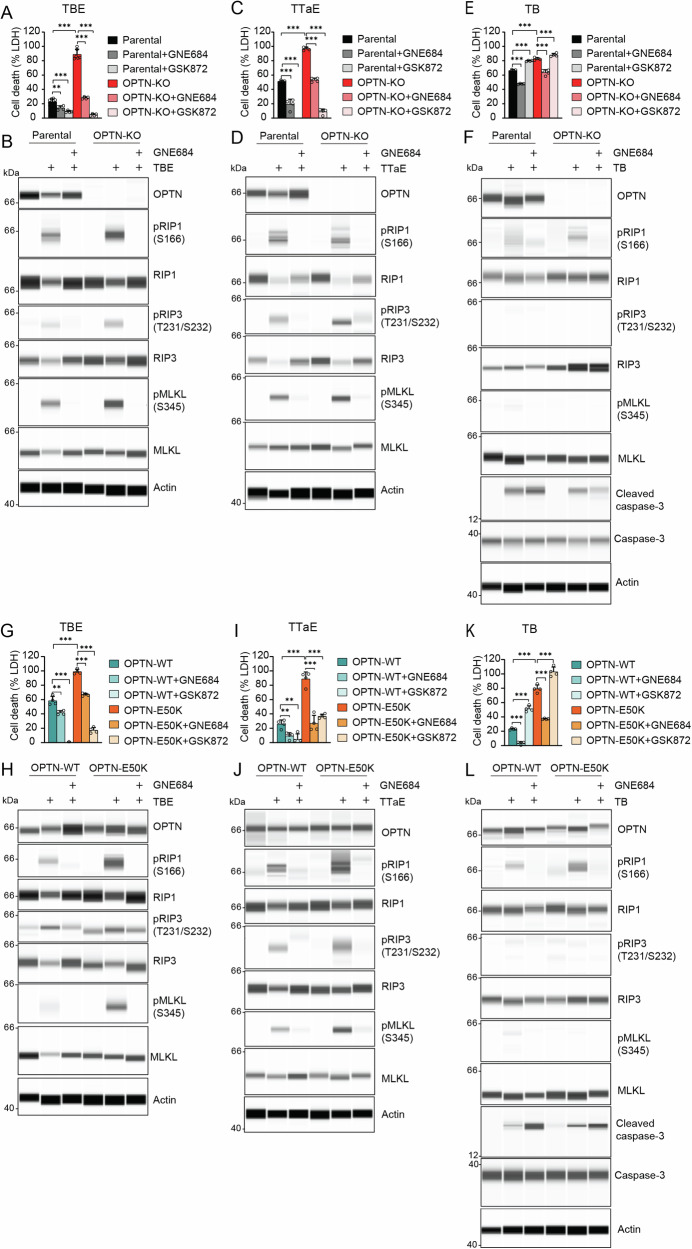
Receptor-interacting protein 1 (RIP1, RIPK1) is a critical mediator of multiple signaling pathways that promote inflammatory responses and cell death. The kinase activity of RIP1 contributes to the pathogenesis of a number of inflammatory and neurodegenerative diseases. However, the role of RIP1 in retinopathies remains unclear. This study demonstrates that RIP1 inhibition protects retinal ganglion cells (RGCs) in preclinical glaucoma models. Genetic inactivation of RIP1 improves RGC survival and preserves retinal function in the preclinical glaucoma models of optic nerve crush (ONC) and ischemia-reperfusion injury (IRI). In addition, the involvement of necroptosis in ONC and IRI glaucoma models was examined by utilizing RIP1 kinase-dead (RIP1-KD), RIP3 knockout (RIP3-KO), and MLKL knockout (MLKL-KO) mice. The number of RGCs, retinal thickness, and visual acuity were rescued in RIP1-kinase-dead (RIP1-KD) mice in both models, while wild-type (WT) mice experienced significant retinal thinning, RGC loss, and vision impairment. RIP3-KO and MLKL-KO mice showed moderate protective effects in the IRI model and limited in the ONC model. Furthermore, we confirmed that a glaucoma causative mutation in optineurin, OPTN-E50K, sensitizes cells to RIP1-mediated inflammatory cell death. RIP1 inhibition reduces RGC death and axonal degeneration following IRI in mice expressing OPTN-WT and OPTN-E50K variant mice. We demonstrate that RIP1 inactivation suppressed microglial infiltration in the RGC layer following glaucomatous damage. Finally, this study highlights that human glaucomatous retinas exhibit elevated levels of TNF and RIP3 mRNA and microglia infiltration, thus demonstrating the role of neuroinflammation in glaucoma pathogenesis. Altogether, these data indicate that RIP1 plays an important role in modulating neuroinflammation and that inhibiting RIP1 activity may provide a neuroprotective therapy for glaucoma.


Conflict of interest statement

Competing interests: This study is supported by F. Hoffmann-La Roche Ltd. BKK, SA, FR, and PDW are employees of F. Hoffmann-La Roche. DV, JDW, and TG are employees of Genentech Inc. The authors declare no competing interests. Ethics approval and consent to participate: All methods were performed in accordance with the relevant guidelines and regulations. All experimental animal studies with mice were conducted under the approval of the Institutional Animal Care and Use Committees of Genentech Lab Animal Research. For human samples, informed consent was obtained from all participants.

Figures

Fig. 1
Fig. 1. Genetic inactivation of RIP1 protects the RGC in an ONC glaucoma preclinical model.
ONC was induced in WT and RIP1-KD mice and RGC survival was evaluated post-ONC. A Representative images from the retinal flat mount of each condition, including untreated (intact retina), contralateral (internal control), and at 7 days post-ONC. Scale bar = 100 μm. B, C Quantification of the number of RGCs. B BRN3α and C RBPMS-positive cells were counted as RGC. n = 8–10 mice per group. D Quantification of the thickness of the retina measured by optical coherent tomography (OCT) at 7 days post-ONC. n = 3–5 mice per group. E Representative graph of pattern electroretinogram (PERG) recording from each condition including untreated, contralateral, and 7 days post-ONC. F Quantification of PERG recording following ONC. n = 4–5 mice per group. G Visual acuity test with optomotor response (OMR) evaluation at 6 days post-ONC. n = 5–8 mice per group. Two-way ANOVA. **P < 0.01, ***P < 0.001, ****P < 0.0001.
Fig. 2
Fig. 2. Genetic inactivation of RIP1 suppresses infiltrating microglia in the RGC layer following ONC damage.
A Representative images of RGC layer (GCL) from an ONC glaucoma model at 7 days post-ONC. Quantification of B IBA1 and C NeuN-positive cells in WT and RIP1-KD mice after ONC. n = 5–8 mice per group. Scale bar = 100 μm. Two-way ANOVA. ***P <  0.001, ****P < 0.0001.
Fig. 3
Fig. 3. Genetic inactivation of RIP1 protects the RGC in an IRI glaucoma preclinical model.
IRI was induced in WT and RIP1-KD mice and RGC survival was evaluated post-IRI. A Representative images from the retinal flat mount of each condition, including untreated (intact retina), sham, and at 7 days post-IRI. Scale bar  = 100 µm. B, C Quantification of the number of RGCs. B BRN3α and C RBPMS-positive cells were counted as RGCs. n = 6–8 mice per group. D Quantification of the thickness of the retina measured by optical coherence tomography (OCT) at 7 days post-IRI. n = 4–8 mice per group. E Representative graph of pattern electroretinogram (PERG) recording from each condition, including untreated (intact retina), sham, 2, and 7 days post-IRI. F Quantification of PERG recording following IRI. n = 5–8 mice per group. G Visual acuity test with optomotor response (OMR) evaluation at 6 days post-IRI. n = 5–8 mice per group. Two-way ANOVA. *P < 0.05, **P < 0.01, ****P < 0.0001.
Fig. 4
Fig. 4. Genetic inactivation of RIP1 suppresses infiltrating microglia in the RGC layer following IRI damage.
A Representative images of the RGC layer (GCL) from IRI-induced glaucoma model at 7 days post-IRI and B quantification of IBA1 and C NeuN-positive cells in both WT and RIP1-KD mice. n = 4–8 mice per group. Scale bar = 100 µm. D Representative images of cleaved caspase-3 immunolabeling. The retinas from WT and RIP1-KD mice underwent IRI. E Quantification of cleaved caspase-3 positive cells. F The level of TNF and IL-1α transcripts in WT and RIP1-KD mice eyes with IRI were examined using qPCR. GCL ganglion cell layer, INL inner nuclear layer, ONL outer nuclear layer. Scale bar = 50 µm. Two-way ANOVA. *P < 0.05, ***P < 0.001, ****P < 0.0001.
Fig. 5
Fig. 5. OPTN deletion and OPTN-E50K mutation sensitize cells to RIP1-mediated inflammatory cell death.
RIP1-dependent cell death was induced in 661w parental OPTN-KO, OPTN-WT, and OPTN-E50K cells. Cell death was induced by TNF, BV6, and Emricasan (TBE; A, B, G, H), TNF, TAK1 inhibitor, and Emricasan (TTaE; C, D, I, J), or TNF and BV6 (TB; E, F, K, L). A 661w parental and OPTN-KO cells were treated with TBE (100 ng mL−1 TNF, 2.5 μM BV6, and 10 μM Emricasan) and 20 μM GNE684 or 10 μM GSK872. LDH assay. B Immunoblot assay for indicated proteins in 661w parental and OPTN-KO cells after 4 h treatment with TBE and GNE684. C 661w parental and OPTN-KO cells were treated with TTaE (100 ng mL−1 TNF, 0.6 μM Takinib, and 10 μM Emricasan) and 20 μM GNE684 or 10 μM GSK872. LDH assay. D Immunoblot assay for indicated protein in 661w and OPTN-KO cells after 4 h treatment with TTaE and GNE684. E 661w parental and OPTN-KO cells were treated with TB (100 ng mL−1 TNF and 2.5 μM BV6) and 20 μM GNE684 or 10 μM GSK872. LDH assay. F Immunoblot assay for indicated protein in 661w and OPTN cells after 4 h treatment with TB and GNE684. G OPTN-WT and OPTN-E50K cells were treated with TBE and GNE684 or GSK872. LDH assay. H Immunoblot assay for indicated protein in OPTN-WT and OPTN-E50K cells after 4 h treatment with TTaE and GNE684. I OPTN-WT and OPTN-E50K cells were treated with TTaE and GNE684 or GSK872. LDH assay. J Immunoblot assay for indicated protein in OPTN-WT and OPTN-E50K cells after 4 h treatment with TTaE and GNE684. K OPTN-WT and OPTN-E50K cells were treated with TB and GNE684 or GSK872. LDH assay. L Immunoblot assay for indicated protein in OPTN-WT and OPTN-E50K cells after 4 h treatment with TB and GNE684. Two-tailed Student t test. Data in columns represent mean ± SD. *P < 0.05, **P < 0.01, ***P < 0.001.
Fig. 6
Fig. 6. Pharmacological RIP1 inhibition attenuates IRI damage in RGC axons.
A AAV2s carrying stuffer, OPTN-WT, and OPTN-E50K sequences were injected into the retinas. AAV2 transduced retinas were co-labeled with IBA1 immunolabeling and in situ hybridization of TNF. Scale bar = 50 μm. B Representative images from retinal whole-mount immunohistochemistry of SMI32. Retinas were transduced with stuffer, OPTN-WT, or OPTN-E50K and underwent IRI. AAV2 transduced mice were administrated with GNE684 100 mg kg−1 by oral gavage, twice per day throughout IRI. C Quantification of SMI32-positive shrunken cells. n = 3–4 mice per group. Scale bar = 100 µm. Data represented in a bar graph. Two-way ANOVA. **P < 0.01, ***P < 0.001, ****P < 0.0001.
Fig. 7
Fig. 7. Human glaucomatous retinas exhibit proinflammatory cell death phenotypes.
Representative images of human non-glaucomatous (n = 3 eyes) and glaucomatous (n = 6 eyes) retinas were included in the study (Supplementary Table 1 and Supplementary Fig. 7). Glaucomatous retinas were collected from patients who were clinically diagnosed with glaucoma before death. A Representative images of postmortem glaucomatous (ID: 140099 and 150001) and non-glaucomatous human retinas (ID: 140001 and 140016) were co-labeled with IBA1 immunolabeling and in situ hybridization (ISH) of TNF and B TNF ISH quantification. Scale bar = 50 μm. C Dual ISH representative images for TNF (pink) and RIP3 (green) from postmortem human glaucomatous (ID: 140149) and non-glaucomatous retinas (ID: 140001) and D its quantification. 20x Olympus scanner microscope. Scale bar = 20 μm and 50 μm. The arrows indicate the TNF (pink) and RIP3 (green) signals from the retina tissue. E Representative images from postmortem glaucomatous human retina. Immunolabeling of cleaved caspase-3 and F cleaved caspase-3 quantification. The arrows indicate the cleaved caspase-3 (pink) signals from the retina tissue. Scale bar = 50 μm. G Representative immunohistochemistry images for Neutrophil elastase (green) staining from postmortem human glaucomatous (ID: 150001) and non-glaucomatous (ID: AE02120) retina and H quantification. 20x Leica Thunder microscope. Scale bar = 100 μm. I Representative immunohistochemistry images for CD45 (red) staining from postmortem human glaucomatous (ID: 150001) and non-glaucomatous (ID: 140015) retina and J quantification. ×20 Leica Thunder microscope Scale bar = 100 μm. GCL ganglion cell layer, INL inner nuclear layer, ONL outer nuclear layer. Two-tailed Student’s t test. *P < 0.05, **P < 0.01, ***P < 0.001.

References

    1. Tham Y-C, Li X, Wong TY, Quigley HA, Aung T, Cheng C-Y. Global prevalence of glaucoma and projections of glaucoma burden through 2040: a systematic review and meta-analysis. Ophthalmology. 2014;121:2081–90. - PubMed
    1. Jonas JB, Aung T, Bourne RR, Bron AM, Ritch R, Panda-Jonas S. Glaucoma. Lancet. 2017;390:2183–93. - PubMed
    1. Lundberg L, Wettrell K, Linnér E. Ocular hypertension. A prospective twenty-year follow-up study. Acta Ophthalmol. 1987;65:705–8. - PubMed
    1. Kitazawa Y, Horie T, Aoki S, Suzuki M, Nishioka K. Untreated ocular hypertension. A long-term prospective study. Arch Ophthalmol. 1977;95:1180–4. - PubMed
    1. Gupta N, Weinreb RN. New definitions of glaucoma. Curr Opin Ophthalmol. 1997;8:38–41. - PubMed

MeSH terms