. 2024 Oct 24;24(1):223.
doi: 10.1186/s12902-024-01752-9.

Developing a risk model for early diagnosis of metabolic syndrome in Chinese adults aged 40 years and above based on BMI/HDL-C: a cross-sectional study

Affiliations

Developing a risk model for early diagnosis of metabolic syndrome in Chinese adults aged 40 years and above based on BMI/HDL-C: a cross-sectional study

Yu Liu et al. BMC Endocr Disord. .

Abstract

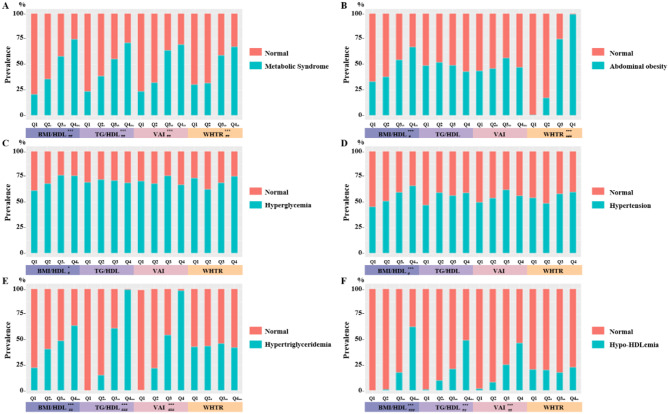
Background: This study aimed to compare the diagnostic accuracy of four indicators, including waist-to-height ratio (WHTR), vascular adiposity index (VAI), TG/HDL-C, and BMI/HDL-C for metabolic syndrome (MS) in Chinese adults aged 40 years and above. Additionally, the study aimed to develop an efficient diagnostic model displayed by a nomogram based on individual's BMI and circulating HDL-C level.

Methods: A cross-sectional study was conducted on 699 participants aged 40 years and above. Quartiles of BMI/HDL-C, TG/HDL-C, VAI, and WHTR were used as independent variables, and metabolic syndrome was used as the dependent variable. Logistic regression was conducted to explore the impact of each parameter on the risk of MS. The areas under the receiver operating characteristics were compared to determine the accuracy of the indicators in diagnosing MS in the participants. Logistic regression was run to construct the nomograms, and the performance of the nomogram was assessed by a calibration curve.

Results: MS subjects had higher levels of BMI, BFM, PBF, VFA, AMC, WC, SCR, TG, and insulin, but lower LDH and HDL-C levels than the subjects without MS. The BMI/HDL-C ratio was positively correlated with the prevalence of MS and its components. The final diagnostic model included five variables: gender, BFM, WC, TG, and BMI/HDL-C. The model showed good calibration and discrimination power with an AUC of 0.780. The cut-off value for the nomogram was 0.623 for diagnosing MS.

Conclusions: BMI/HDL-C ratio was an independent risk factor for MS in Chinese adults. BMI/HDL-C was significantly correlated with MS and its components. BMI/HDL-C was the most powerful diagnostic indicator compared to other indicators, including TG/HDL-C, VAI and WHTR for diagnosing MS. The nomogram drawn based on the diagnostic model provided a practical tool for diagnosing MS in Chinese adults.

Keywords: BMI/HDL-C ratio; Diagnostic model; Metabolic syndrome; Nomogram.


Conflict of interest statement

The authors have no relevant financial or non-financial interests to disclose.

Figures

Fig. 1
Fig. 1
Prevalence of MS and its components according to the quartiles of BMI/HDL-C, TG/HDL-C, WHTR, and VAI. (A) Comparison of the prevalence of MS in the quartile of four key diagnostic indicators. (B) Comparison of the prevalence of abdominal obesity in the quartile of four key diagnostic indicators. (C) Comparison of the prevalence of hyperglycemia in the quartile of four key diagnostic indicators. (D) Comparison of the prevalence of hypertension in the quartile of four key diagnostic indicators. (E) Comparison of the prevalence of hypertriglyceridemia in the quartile of four key diagnostic indicators. (F) Comparison of the prevalence of HHDL in the quartile of four key diagnostic indicators. BMI, Body Mass Index; HDL-C, high-density lipoprotein cholesterol; TG, triglyceride; WHTR: waist-to-height ratio. VAI: visceral adiposity index. (*P < 0.05, **P < 0.01, ***P < 0.001. a: P < 0.05 vs. Q1 of the same indicator, b: P < 0.05 vs. Q2 of the same indicator, c: P < 0.05 vs. Q3 of the same indicator. #: 0.1 < Cramer’s V < 0.3, indicates a weak intensity correlation; ##: 0.3 ≤ Cramer’s V < 0.5, indicates a moderate intensity correlation; ###: Cramer’s V ≥ 0.5, indicates a high intensity correlation)
Fig. 2
Fig. 2
Forest plot and ROC curves of the models constructed based on BMI/HDL-C, TG/HDL-C, VAI, and WHTR. Correlation between quartile of BMI/HDL-C (A), TG/HDL-C (B), VAI (C), and WHTR (D) and MS with adjustment of different confounding factors. Different background of forest plot represents different confounding factor correction: Blue - without adjustment of confounding factors; red - adjustment of confounding factors including gender, education level, and smoking; yellow - adjustment of confounding factors including BMI, BFM, PBF, VFA, AMC, WC, SCR, LDH, TG, HDL-C, and insulin. Comparison of ROC curves (E) without adjustment of confounding factors; (F) with adjustment of confounding factors including gender, education level, and smoking; (G) with adjustment of confounding factors including BMI, BFM, PBF, VFA, AMC, WC, SCR, LDH, TG, HDL-C, and insulin. BMI, Body Mass Index; HDL-C, high-density lipoprotein cholesterol; TG, triglyceride; WHTR: waist-to-height ratio. VAI: visceral adiposity index
Fig. 3
Fig. 3
Nomogram and calibration curve of the optimal model. (A) Nomogram of the optimal prediction model of metabolic syndrome. (B) Calibration curve of the optimal prediction model of metabolic syndrome. BFM, Body Fat Mass; WC, Waist Circumference; TG, triglyceride; Q1, Q3, Q4, quartile of BMI/HDL-C

Similar articles

Cited by

References

    1. Lemieux I, Despres JP. Metabolic syndrome: past, Present and Future. Nutrients. 2020;12(11). - PMC - PubMed
    1. Saklayen MG. The global epidemic of the metabolic syndrome. Curr Hypertens Rep. 2018;20(2):12. - PMC - PubMed
    1. Pan WH, Yeh WT, Weng LC. Epidemiology of metabolic syndrome in Asia. Asia Pac J Clin Nutr. 2008;17(Suppl 1):37–42. - PubMed
    1. Bener A, Zirie M, Musallam M, et al. Prevalence of metabolic syndrome according to adult treatment panel III and international diabetes federation criteria: a population-based study. Metab Syndr Relat Disord. 2009;7(3):221–9. - PubMed
    1. Yao F, Bo Y, Zhao L et al. Prevalence and influencing factors of metabolic syndrome among adults in China from 2015 to 2017. Nutrients. 2021;13(12). - PMC - PubMed

LinkOut - more resources