. 2024 Oct 24;22(1):518.
doi: 10.1186/s12964-024-01893-3.

Immunomodulatory effects of trastuzumab deruxtecan through the cGAS-STING pathway in gastric cancer cells

Affiliations

Immunomodulatory effects of trastuzumab deruxtecan through the cGAS-STING pathway in gastric cancer cells

Kyoung-Seok Oh et al. Cell Commun Signal. .

Abstract

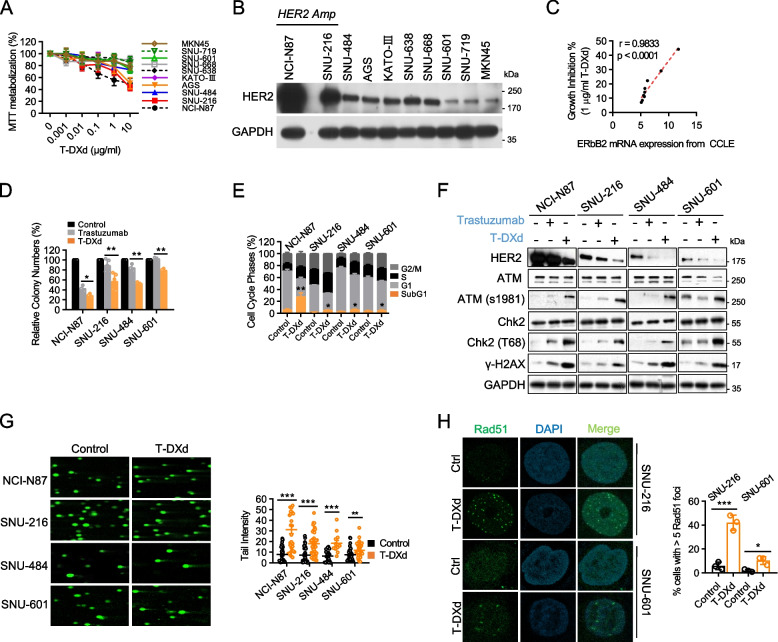
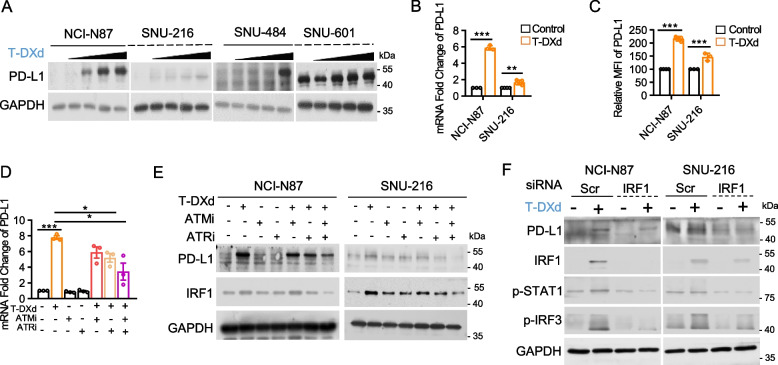
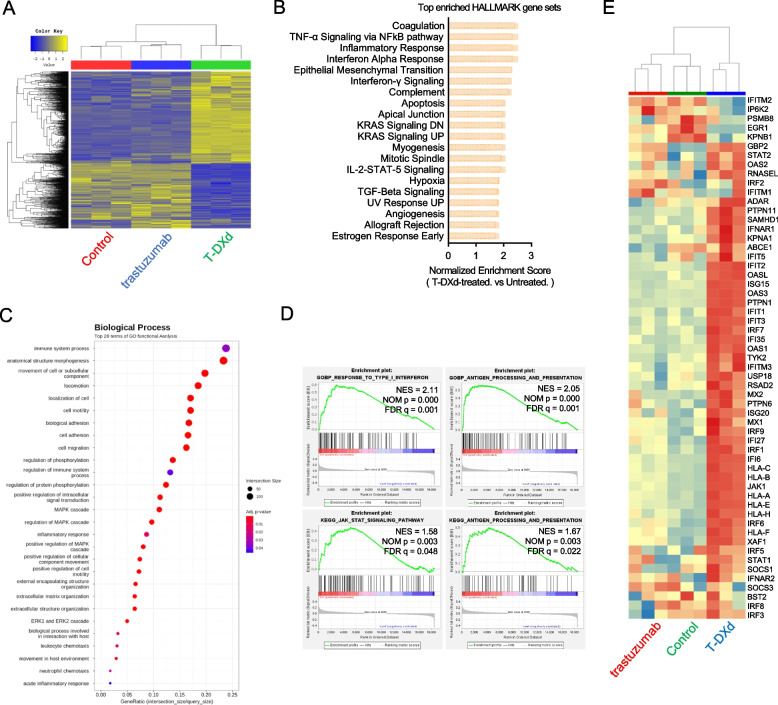
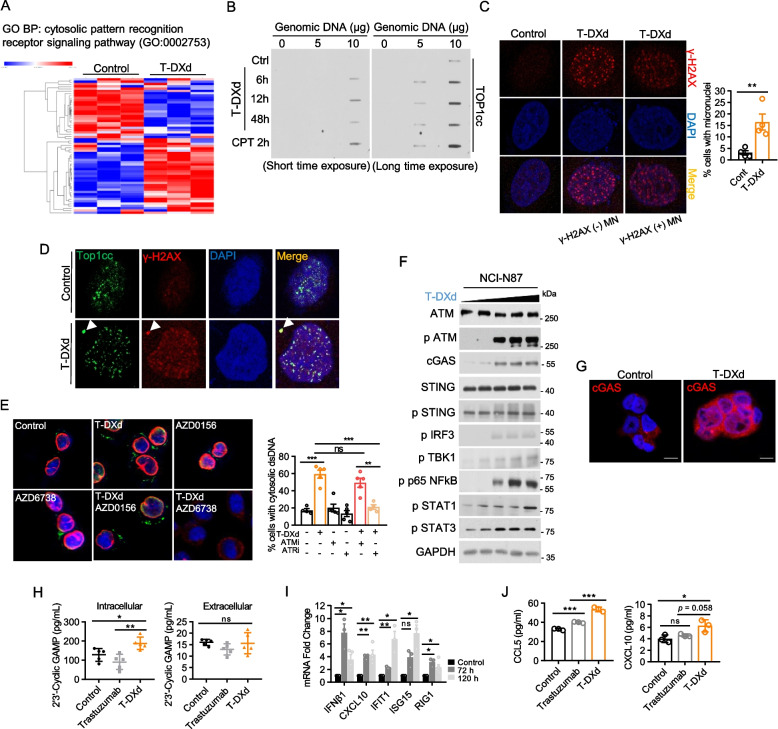
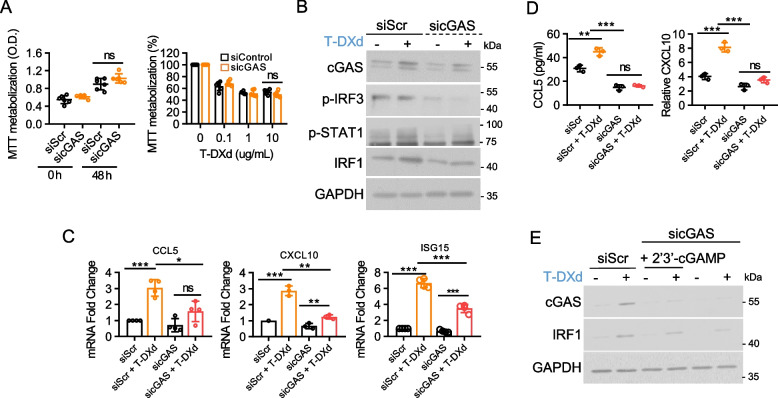
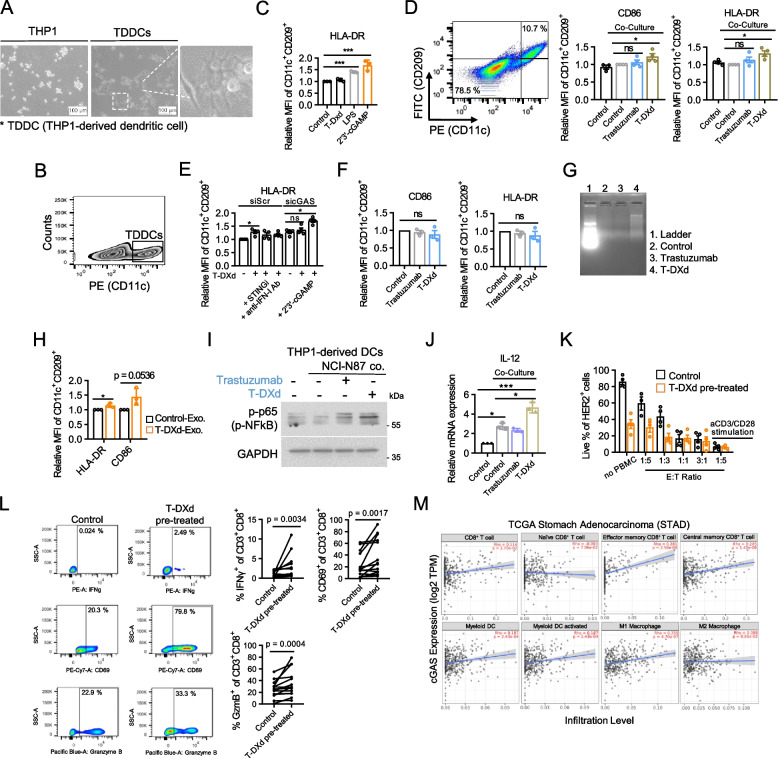
Although the efficacy of trastuzumab deruxtecan (T-DXd) against HER2-positive gastric cancers (GCs) has driven its clinical application, the precise mechanisms governing its immunomodulatory role remain unclear. In this study, we examined the immune-related mechanisms of action of T-DXd in GC cells. T-DXd exhibited potent antitumor effects in GC cells across diverse HER2 expression levels by inducing DNA damage and apoptosis. Activation of the DNA damage response by T-DXd led to increased PD-L1 expression. RNA-Seq analysis revealed that T-DXd modulated immune-related pathways, resulting in the upregulation of genes associated with inflammation and IFN signaling. Importantly, T-DXd activated the cGAS-STING pathway, inducing an IFN-I response in HER2-positive GC cells. Furthermore, T-DXd activated dendritic cells via the cancer cell-intrinsic cGAS-STING-IFN axis and enhanced PBMC-mediated tumor cell killing by activating CD8+ T cells. These findings provide valuable insights into the role of the cytosolic DNA sensing pathway in the action of T-DXd and offer a compelling rationale for combining T-DXd with immune checkpoint blockade therapies in GC treatment.

Keywords: DNA damage; ErbB-2; Trastuzumab deruxtecan; Type-1 IFN; cGAS-STING signaling.


Conflict of interest statement

Oh DY Consultant or advisory board member of AstraZeneca, Novartis, Genentech/Roche, Merck Serono, Bayer, Taiho, ASLAN, Halozyme, Zymeworks, BMS/Celgene, BeiGene, Basilea, Turning Point, and Yuhan. Research grant from AstraZeneca, Novartis, Array, Eli Lilly, Servier, BeiGene, MSD, and Handok. The other authors have no relevant financial or non-financial interests to disclose.

Figures

Fig. 1
Fig. 1
T-DXd induces DNA damage response and potent cytotoxic effects against GC cell lines with various HER2 expression levels. A GC cells were treated with varying concentrations of T-DXd for six days, and cell viability was measured using MTT assays. The results of four independent experiments are presented as the mean ± SEM of the percentage of viable cells. B Whole lysates were prepared from GC cells and subjected to immunoblotting to determine the basal expression level of HER2. C The nonparametric Spearman’s correlation between the growth inhibition rate of GC cells in response to T-DXd (Fig. 1A) and the mRNA expression level of HER2, obtained from the RNA-Seq-based CCLE expression dataset (DepMap Public 22Q2). D GC cells were treated with 1 µg/ml of trastuzumab or T-DXd for 10 days and subjected to clonogenic assays. Relative colony numbers are presented as mean ± SEM *, p < 0.05; **, p < 0.005 of three biological replicates. E The cell cycle distribution was evaluated by flow cytometry after five days of treatment with 1 µg/ml T-DXd in indicated GC cells, and data from at least three independent experiments are shown as mean ± SEM *, p < 0.05, **, p < 0.005. F GC cells treated with 1 µg/ml of trastuzumab or T-DXd for five days were prepared into whole lysates for immunoblotting. G Comet analysis was conducted in GC cells treated with 1 µg/ml of T-DXd for 72 h. Left panel: representative images of the three independent experiments are shown. Right panel: each scattered dot represents the tail intensity of single cells and the sum of three biological replicates. Data are shown as mean ± SEM **, p < 0.005, ***, p < 0.001. H Immunofluorescence analysis was performed to detect Rad51 foci. Left panel: GC cells treated with 1 µg/ml of T-DXd for 72 h were permeabilized with 0.5% Triton X-100 and stained for Rad51 (green), and counterstained with DAPI (blue). Representative images from three independent experiments are shown. Right panel: the relative number of cells positive for Rad51 foci was determined by counting over 100 cells in each dataset and shown as mean ± SD *, p < 0.05; ***, p < 0.001
Fig. 2
Fig. 2
T-DXd-induced DDR activation regulates PD-L1 transcription through IRF1 in GC cells. A PD-L1 expression in GC cells treated with different concentrations of T-DXd (0, 0.04, 0.2, 1, and 5 µg/ml) for 120 h was assessed by immunoblotting. B Quantitative PCR analysis of PD-L1 expression in GC cells treated with 1 µg/ml of T-DXd for 72 h. β-Actin was used as a normalization control. Data are presented as mean ± SD ***, p < 0.001. C Flow cytometric analysis of surface PD-L1 expression in GC cells treated with 1 µg/ml of T-DXd for 72 h. Data from at least three independent biological replicates are shown as mean ± SD. ***, p < 0.001. D PD-L1 mRNA levels in NCI-N87 cells treated with T-DXd (1 µg/ml) and/or AZD0156 (ATMi, 0.1 µM), and/or AZD6738 (ATRi, 0.1 µM) for 72 h, were determined by RT-qPCR. Data from three independent experiments are represented as mean ± SEM *, p < 0.05; ***, p < 0.001. E Immunoblot analysis of PD-L1 and IRF1 expression levels in cell lysates from NCI-N87 cells treated with T-DXd (1 µg/ml) and/or inhibitors of ATM and ATR. F Immunoblot analysis of PD-L1 and IRF1-related gene expression levels in GC cells transfected with siRNAs targeting IRF1, with or without T-DXd treatment (1 µg/ml)
Fig. 3
Fig. 3
T-DXd provokes a gene expression signature related to enhanced tumor immunogenicity in GC cell lines with high and low HER2 expression. RNA-Seq was performed using NCI-N87 cells after treatment with the vehicle, trastuzumab (1 µg/ml), and T-DXd (1 µg/ml) for 72 h. A Hierarchically clustered heatmap of 1,310 DEGs (| fold change |≥ 2 and raw p < 0.05, n = 3). B The top 20 enriched Hallmark gene sets in response to T-DXd ranked by normalized enrichment score from GSEA. C The result of the GO enrichment analysis showing the top 28 enriched gene sets following T-DXd treatment. D Representative images of GSEA showing the enrichment of gene signatures associated with antitumor immune response by T-DXd treatment. E Heatmap illustrating Reactome Interferon alpha/beta signaling geneset from RNA-Seq data
Fig. 4
Fig. 4
T-DXd activates the cytosolic DNA recognition pathway in GC cells. A Heatmap of cytosolic pattern recognition receptor pathway genes showing differential expression after T-DXd treatment. B NCI-N87 cells treated with 1 µg/ml of T-DXd or 10 µM of camptothecin for indicated times were subjected to slot blot assays to measure TOP1cc levels. Representative images from biological duplicates are shown. C Immunofluorescence analysis was conducted in SNU-216 cells treated with 1 µg/ml of T-DXd for 72 h to detect the formation of DNA damage foci and MN. Permeabilized cells were stained for γ-H2AX (red) and DNA compartment (blue). Left panel: representative images from four independent experiments are shown, indicating the γ-H2AX-positive MN and γ-H2AX-negative MN. Right panel: the percentage of cells with MN was measured by counting more than 100 cells of each experiment and shown as mean ± SEM **, p < 0.005. D Immunofluoresence analysis using SNU-216 cells treated with 1 µg/ml of T-DXd for identifying the TOP1cc (green) formation and its colocalization with MN. E Immunofluorescence analysis of cytoplasmic dsDNA (green) in SNU-216 cells treated with 1 µg/ml of T-DXd, 0.1 µM AZD0156 (ATR inhibitor), 0.1 µM AZD6738 (ATM inhibitor), or their combination with T-DXd for 48 h. Nuclei were counterstained with DAPI (blue), and Lamin B1 (red) was used as a nuclear envelope marker. Left panel: representative images from four biological replicates are shown. Right panel: the percentage of cells positive for cytoplasmic dsDNA is shown as mean ± SEM. ns: not significant; **, p < 0.005; ***, p < 0.001. F Immunoblotting of genes associated with the canonical cGAS-STING pathway in NCI-N87 cells treated with varying concentrations of T-DXd (0, 0.04, 0.2, 1, and 5 µg/ml). G Immunofluorescence analysis of SNU-216 cells treated with 1 µg/ml of T-DXd showing the upregulation of cGAS (Red) expression. The nuclei were counterstained by DAPI (blue) and representative images from three biological replicates are shown. H The synthesis (left panel) and secretion (right panel) levels of cGAMP were determined by ELISA in NCI-N87 cells treated with 1 µg/ml of trastuzumab or T-DXd for 72 h. Every symbol represents one biological replicate from five experiments. Statistical significance is shown as *, p < 0.05; **, p < 0.005. I Quantitative PCR analysis determined the gene expression level of ISGs in NCI-N87 cells in response to 1 µg/ml of T-DXd treatment. Each dot represents one biological replicate and data are shown as mean ± SEM, ns: not significant, *, p < 0.05; **, p < 0.005. J Secretion levels of CCL5 (left panel) and CXCL10 (right panel) in NCI-N87 cells treated with 1 µg/ml trastuzumab or T-DXd, measured by ELISA
Fig. 5
Fig. 5
cGAS is essential for the T-DXd-mediated promotion of IFN-I response in GC cells. A The impact of cGAS knockdown on cell proliferation (left panel) and sensitivity to T-DXd (right panel) was assessed by MTT assays using NCI-N87 cells transfected with the indicated siRNAs. Data represent the mean ± SD from three independent experiments, ns: not significant. B The immunoblot assay determined the effect of cGAS deficiency on T-DXd-induced STAT1 pathway activation in NCI-N87 cells. C Quantitative PCR analysis evaluated the mRNA expression levels of ISGs in NCI-N87 cells transfected with specific siRNAs. Data represent the mean ± SD from three independent experiments, ns: not significant, *, p < 0.05; **, p < 0.005; ***, p < 0.001. D ELISA measured the cytokine release from cancer cells transfected with specific siRNAs in response to T-DXd treatment. The relative secretion levels of CCL5 and CXCL10 are depicted as mean ± SD, ns: not significant, **, p < 0.005; ***, p < 0.001. E Immunoblotting was employed to evaluate the restoration of T-DXd-induced IRF1 induction, which was attenuated by cGAS depletion upon cGAMP transfection in NCI-N87 cells
Fig. 6
Fig. 6
T-DXd induces DC activation and enhances PBMC-mediated tumor cell killing. A THP-1 cells were differentiated into TDDCs by adding a cocktail of 20 ng/ml of PMA and recombinant human IL-4. The morphologies of THP-1 cells and TDDCs were observed under a light microscope. B Flow cytometry analysis was performed to determine the relative proportion of CD11c+ cells in TDDCs at day 6 post-differentiation. C Flow cytometry analysis was performed to assess the expression level of HLA-DR in CD11c+/CD209+ TDDCs treated with the vehicle, T-DXd, LPS, or transfected with 2 µg/ml of cGAMP. D NCI-N87 cells and TDDCs were cocultured at a ratio of 3:1 for 72 h with 1 µg/ml of trastuzumab or T-DXd. Flow cytometry analysis was performed to determine the expression level of HLA-DR in CD11c+/CD209+ TDDCs. E NCI-N87 cells transfected with specific siRNAs were pretreated with T-DXd in the presence of STINGi (H-151, 1 µg/ml), human type I IFN neutralizing antibody mixture, or cGAMP transfection for 6 h. Subsequently, cells were harvested and cocultured with TDDCs for an additional 72 h. Flow cytometry analysis was performed to determine the expression level of HLA-DR in CD11c+/CD209+ TDDCs. F TDDCs were generated from THP-1 cells in the lower chambers of Transwell plates. NCI-N87 cells were seeded in the upper chambers of Transwell plates and treated with trastuzumab or T-DXd (1 µg/ml) for 72 h. Flow cytometry analysis determined the expression level of CD86 (left panel) and HLA-DR (right panel) in CD11c+/CD209+ TDDCs. Data from three independent experiments are presented as mean ± SEM, ns: not significant. G Agarose gel electrophoresis of exosomal dsDNA isolated from the culture medium of NCI-N87 cells treated with 1 µg/ml of T-DXd. Exosomes were isolated from the conditioned medium, followed by dsDNA enrichment. Representative images from two independent experiments are shown. H Bar graph showing the expression levels of CD86 and HLA-DR in CD11c+/CD209+ TDDCs after 48 h incubation with exosomes isolated from the culture medium of NCI-N87 cells treated with T-DXd. Flow cytometry was performed to assess the activation markers. Data represent the mean ± SEM from three independent experiments. *, p < 0.05. I An immunoblot assay was performed on lysates from TDDCs after 48 h of indirect coculture with NCI-N87 cells in the presence of 1 µg/ml of trastuzumab or T-DXd. J RT-qPCR was used to measure the expression levels of IL-12 in TDDCs that were indirectly cocultured with NCI-N87 cells for 48 h in the presence of 1 µg/ml of trastuzumab or T-DXd. Data from three independent experiments were shown as mean ± SD, *, p < 0.05; ***, p < 0.001. K PBMC-mediated killing assay of NCI-N87 cells pretreated with T-DXd or the vehicle. Following a 72-h coculture, flow cytometry was used to determine the percentage of live HER2+ cells. L Flow cytometry analysis of CD69 expression, as well as intracellular staining of Granzyme B and IFN-γ in CD8+ T cells from PBMCs and NCI-N87 cocultures, with or without T-DXd pre-treatment. Left panel; representative images from at least 11 experiments. Right panel; frequencies of CD8+ T cells expressing CD69, Granzyme B, and IFN-γ. Statistical significance was determined using a paired Wilcoxon test. M Scatterplots illustrating the correlation between cGAS expression (log2TPM) and the tumor infiltration of immune cells in TCGA-STAD, including subsets of CD8+ T cells, DCs, and macrophages, analyzed using the TIMER2.0 tumor immune estimation resource

Similar articles

Cited by

References

    1. Nam AR, Jin MH, Bang JH, Oh KS, Seo HR, Oh DY, et al. Inhibition of ATR Increases the Sensitivity to WEE1 Inhibitor in Biliary Tract Cancer. Cancer Res Treat. 2020;52:945–56. 10.4143/crt.2020.080. - PMC - PubMed
    1. Fu Z, Li S, Han S, Shi C, Zhang Y. Antibody drug conjugate: the “biological missile” for targeted cancer therapy. Signal Transduct Target Ther. 2022;7:93. 10.1038/s41392-022-00947-7. - PMC - PubMed
    1. Ogitani Y, Aida T, Hagihara K, Yamaguchi J, Ishii C, Harada N, et al. DS-8201a, A Novel HER2-Targeting ADC with a Novel DNA Topoisomerase I Inhibitor, Demonstrates a Promising Antitumor Efficacy with Differentiation from T-DM1. Clin Cancer Res. 2016;22:5097–108. 10.1158/1078-0432.CCR-15-2822. - PubMed
    1. Shitara K, Bang YJ, Iwasa S, Sugimoto N, Ryu MH, Sakai D, et al. Trastuzumab Deruxtecan in Previously Treated HER2-Positive Gastric Cancer. N Engl J Med. 2020;382:2419–30. 10.1056/NEJMoa2004413. - PubMed
    1. Yamaguchi K, Bang YJ, Iwasa S, Sugimoto N, Ryu MH, Sakai D, et al. Trastuzumab deruxtecan in anti-human epidermal growth factor receptor 2 treatment-naive patients with human epidermal growth factor receptor 2-low gastric or gastroesophageal junction adenocarcinoma: exploratory cohort results in a phase II trial. J Clin Oncol. 2023;41:816–25. 10.1200/JCO.22.00575. - PMC - PubMed

MeSH terms