. 2024 Oct 24;23(1):239.
doi: 10.1186/s12943-024-02155-z.

A multidimensional recommendation framework for identifying biological targets to aid the diagnosis and treatment of liver metastasis in patients with colorectal cancer

Affiliations

A multidimensional recommendation framework for identifying biological targets to aid the diagnosis and treatment of liver metastasis in patients with colorectal cancer

Feng Qi et al. Mol Cancer. .

Abstract

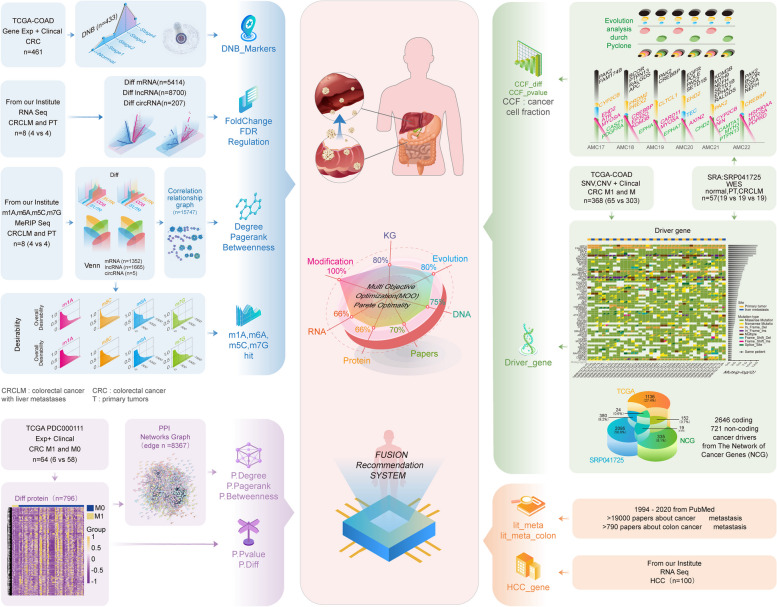
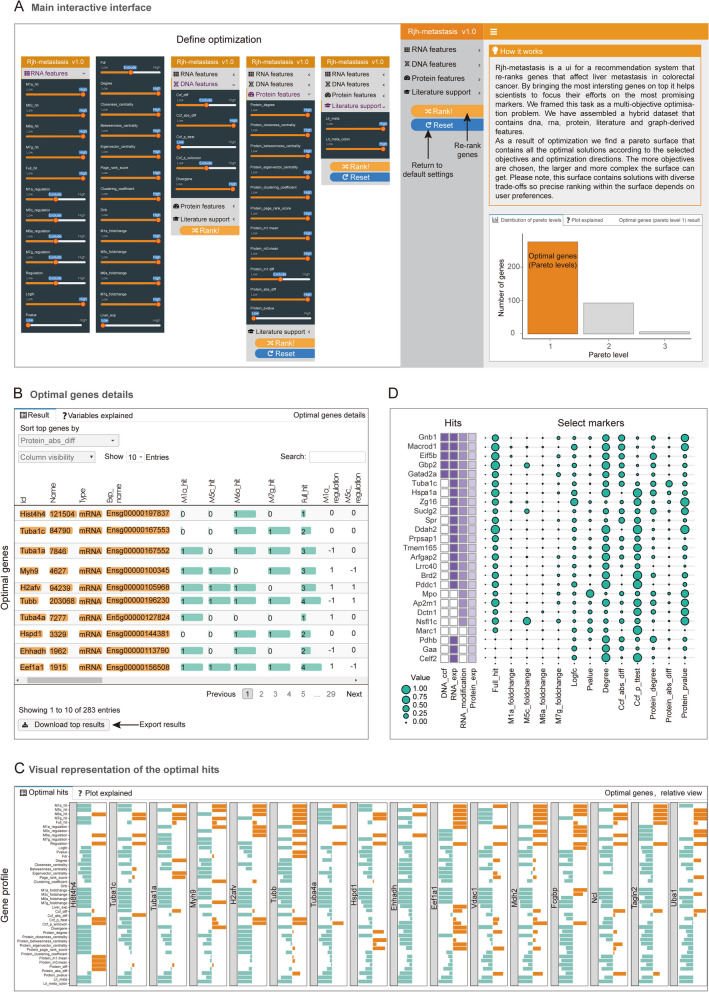
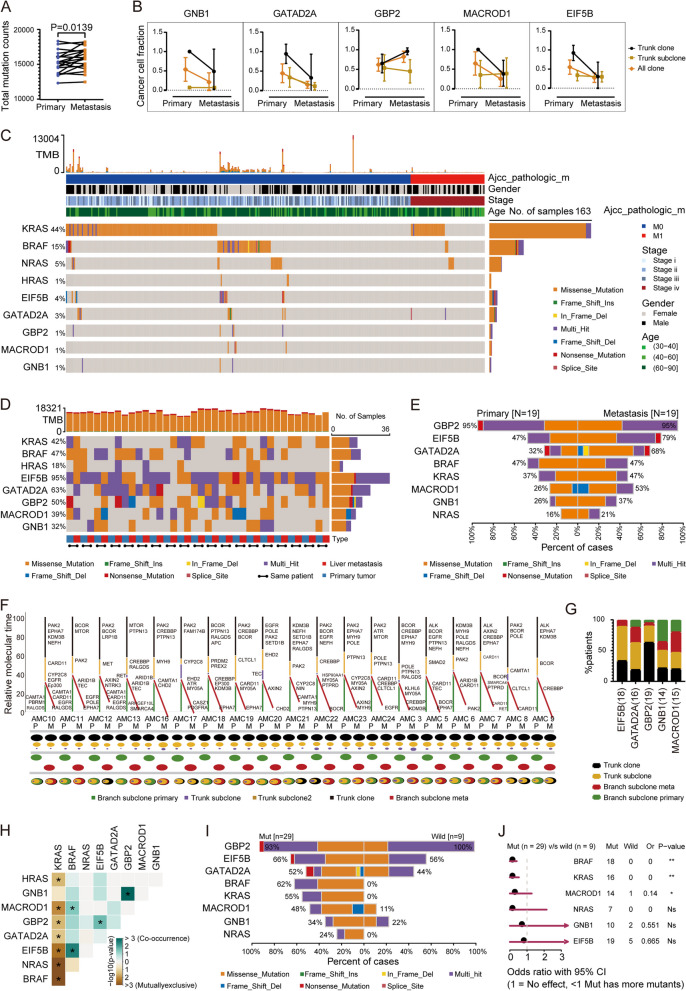
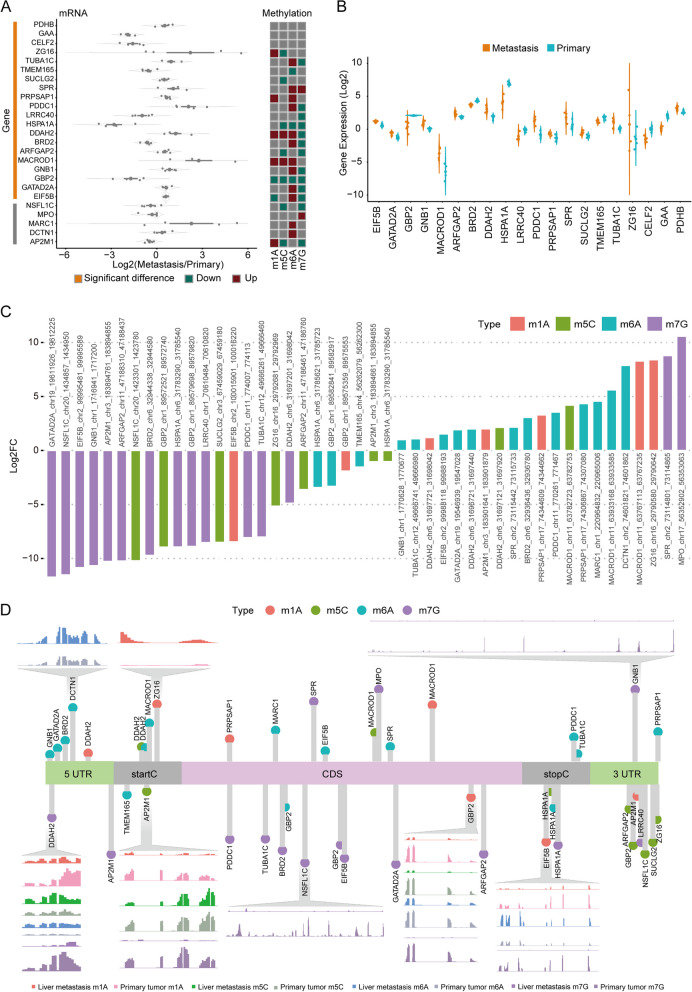
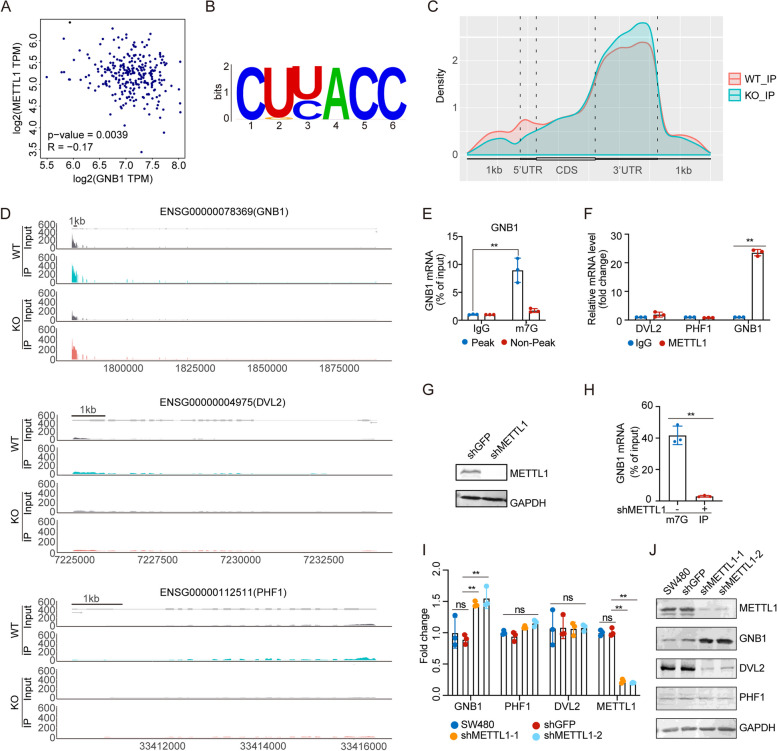
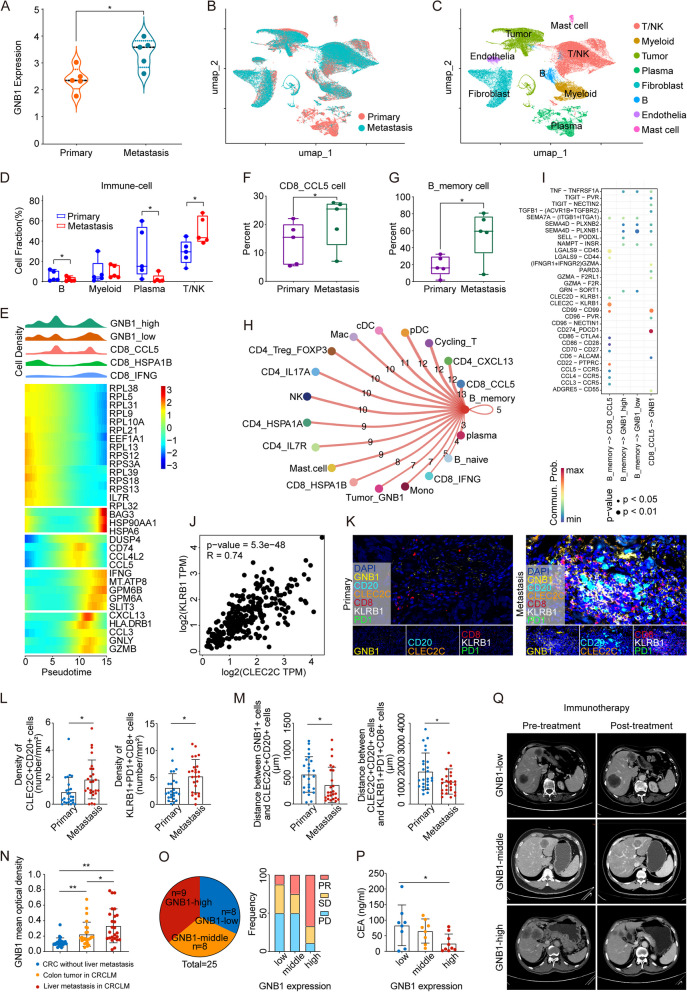
The quest to understand the molecular mechanisms of tumour metastasis and identify pivotal biomarkers for cancer therapy is increasing in importance. Single-omics analyses, constrained by their focus on a single biological layer, cannot fully elucidate the complexities of tumour molecular profiles and can thus overlook crucial molecular targets. In response to this limitation, we developed a multiobjective recommendation system (RJH-Metastasis 1.0) anchored in a multiomics knowledge graph to integrate genome, transcriptome, and proteome data and corroborative literature evidence and then conducted comprehensive analyses of colorectal cancer with liver metastasis (CRCLM). A total of 25 key genes significantly associated with CRCLM were recommended by our system, and GNB1, GATAD2A, GBP2, MACROD1, and EIF5B were further highlighted. Specifically, GNB1 presented fewer mutations but elevated RNA transcription and protein expression in CRCLM patients. The role of GNB1 in promoting the malignant behaviours of colon cancer cells was demonstrated via in vitro and in vivo studies. Aberrant expression of GNB1 could be regulated by METTL1-driven m7G modification. METTL1 knockdown decreased m7G modification in the 3' UTR of GNB1, increasing its mRNA transcription and translation during liver metastasis. Furthermore, GNB1 induced the formation of an immunosuppressive microenvironment by promoting the CLEC2C-KLRB1 interaction between memory B cells and KLRB1+PD-1+CD8+ cells. GNB1 expression and the efficacy of PD-1 antibody-based treatment in CRCLM patients were significantly correlated. In summary, our recommendation system can be used for effective exploration of key molecules in colorectal cancer, among which GNB1 was identified as a critical CRCLM promoter and immunotherapy biomarker in colorectal cancer patients.

Keywords: Colorectal cancer liver metastasis; GNB1; Immunotherapy; RNA modification; Recommendation system.


Conflict of interest statement

The authors declare no competing interests.

Figures

Fig. 1
Fig. 1
Workflow Diagram of the RJH-Metastasis 1.0 Recommendation System. RJH-Metastasis 1.0 integrates multiomics data across four –dimensions –RNA expression, protein expression, DNA expression, and bibliographic –evidence – to calculate and identify an optimized set of genes. This comprehensive approach leverages the synergy among various data types to increase the accuracy and relevance of the selected gene targets. By incorporating evidence from diverse biological layers and extensive literature reviews, RJH-Metastasis 1.0 aims to provide a holistic understanding of the molecular mechanisms underlying metastasis, facilitating the discovery of potential therapeutic targets and biomarkers for CRLM
Fig. 2
Fig. 2
Schematic Diagram of the Interactive Interface of RJH-Metastasis 1.0. (A) The interface allows the adjustment of 43 parameters to obtain the corresponding recommended optimal targets. (B) The resulting optimal genes can be arranged in various ways, with the default arrangement being the fold change in protein expression. (C-D) Detailed display of each gene across the 43 parameters
Fig. 3
Fig. 3
DNA Mutation and Evolution Analysis. (A) Comparison of total mutation counts between patients with primary and metastatic CRC revealed a significant increase in the number of mutations in hotspot genes in colorectal cancer liver metastasis patients. (B) Among the 25 genes, five exhibited clear trends in cancer cell fraction (CCF) changes. Mutations in GNB1, GATAD2A, MACROD1, and EIF5B were significantly enriched in patients without liver metastasis, whereas only mutations in GBP2 were significantly enriched in patients with liver metastasis. (C) All mutation types in the 25 genes were concentrated mostly in the M0 stage in the TCGA-COAD cohort. (D) In a set of 19 paired samples, EIF5B had a greater proportion of multihit mutations than other mutation types, whereas the other genes predominantly harboured missense mutations. (E) A greater variety of mutation types were present in liver metastasis patients. (F-G) Clonal evolution analysis of 19 paired patient samples revealed that these five genes are located at different evolutionary nodes, with GBP2 concentrated mainly in the early trunk clone stage, EIF5B and GATAD2A concentrated mainly in the trunk subclone stage, GNB1 concentrated mainly in the branch subclone primary, and MACROD1 concentrated mainly in the branch subclone meta. (H) Gene synergy and exclusivity analyses revealed that these five genes have significant exclusivity with KRAS while showing certain synergy among themselves. (I) Analysis of 319 patients in the WT group and 30 patients in the mutant-type group revealed a greater proportion of nonsynonymous mutations across all genes in the patients in the mutant-type group and that other mutation types, such as splice site mutations, frameshift deletions, and in-frame deletions, were concentrated in patients in the mutant-type group. (J) Mutations in BRAF, KRAS, and MACROD1 were significantly enriched in patients in the mutant-type group
Fig. 4
Fig. 4
Analysis of Methylation Types and Sites in 25 Genes. (A) Schematic diagram showing the RNA expression and methylation modification characteristics of the 25 genes. (B) Among the 25 genes, 20 exhibited significant differential expression. (C) Bar chart showing the levels of four types of RNA methylation modifications in each gene. (D) Genomic locations of the methylation sites in each gene
Fig. 5
Fig. 5
GNB1 Promotes CRC Progression and Metastasis. (A) Representative immunohistochemical images showing the expression of GNB1 in patients with CRC. scale bar, 20 μm (left); 100 μm (right). (B) GNB1 expression in tumour and peritumoral tissues from 155 CRC patients was measured via qRT‒PCR. (C) The prognostic value of GNB1, as assessed by Kaplan–Meier analysis. (D) The GNB1 protein level in GNB1-overexpressing and GNB1-knockdown cells was measured via western blotting. (E) The proliferation of GNB1-overexpressing and GNB1-knockdown cells was measured via a Cell Counting Kit-8 (CCK-8) assay. (F-G) Colony formation assays were performed with GNB1-overexpressing and GNB1-knockdown cells. (H-I) The migration potential of GNB1-overexpressing and GNB1-knockdown cells was measured via Transwell migration assays. (J-L) Mouse models were established with GNB1-overexpressing cells. Representative bioluminescence images of tumours (J) and pulmonary metastases (K), along with tumour images and weight changes (L), are shown. (M-O) Mouse models were established with GNB1-knockdown cells. Representative bioluminescence images of tumours (M) and pulmonary metastasis (N), as well as tumour images and weight changes (O), are shown. All qRT‒PCR data are presented as the means ± SEMs; n = 3. *p < 0.05. **p < 0.01. ***p < 0.001
Fig. 6
Fig. 6
METTL1 Regulates GNB1 Protein Expression. (A) Correlation analysis results showing that METTL1 expression was correlated with GNB1 expression in CRC patients. (B-C) Global profiling of METTL1 RIP-seq data from SW480 cells: (B) Sequence motif identified from the top-ranked peaks; (C) Distribution of peak reads across all the mRNAs. (D) Integrative Genomics Viewer (IGV) plots of peaks at individual mRNAs. (E) qRT‒PCR analysis of anti-m7G GNB1 immunoprecipitates in SW480 cells. (F) qRT‒PCR analysis of METTL1 RNA immunoprecipitates in SW480 cells. (G) Western blot analysis with the indicated antibodies. (H) qRT‒PCR analysis of GNB1 m7G levels upon depletion of METTL1 in SW480 cells. (I-J) Expression of METTL1 and GNB1/DVL2/PHF1 in METTL1-knockdown cells: (I) qRT‒PCR analysis of the expression of the indicated mRNAs; (J) Western blot analysis with the indicated antibodies. All qRT‒PCR data are presented as the means ± SEMs; n = 3. **p < 0.01
Fig. 7
Fig. 7
Immune Microenvironment Differences in CRC Patients with Liver Metastasis. (A) Violin plot showing increased expression of GNB1 in metastatic samples. (B-C) UMAP plot showing the annotations and colour codes for immune cell types. (D) Boxplot showing the changes in the relative proportions of B cells, myeloid cells, plasma cells and T/NK cells between the primary and metastasis groups. (E) Density distributions of three subtypes of CD8 + T cells and CD8 + T cells categorized by metastasis status along pseudotime (upper panel). Heatmap displaying dynamic changes in the expression of representative genes along pseudotime (lower panel). GNB1_high and GNB1_low represent GNB1 + tumor cells. (F) Percentage difference in the proportion of CD8_CCl5 cells between the primary and metastasis groups. (G) Percentage difference in the proportion of B_memory cells between the primary and metastasis groups. (H) Potential intercellular communication events based on ligand‒receptor interactions between B_memory cells and other immunocytes. The thickness of the line and the interaction weight score indicate the number and expression level of ligand‒receptor pairs, respectively. (I) Overview of the immune checkpoint ligand‒receptor pairs between B_memory cells and CD8_CCl5 cells or tumor_GNB1 cells. The colour represents the average expression levels of the ligands and receptors, and the dot size denotes the statistical significance of the interaction pair. (J) Scatter plots showing the relationships between CLEC2C and KLRB1. (K) Multiplex immunofluorescence images demonstrating in situ colocalization among GNB1 + tumour cells, CLEC2C + CD20 + B cells and KLRB1 + PD1 + CD8 + T cells in the primary and metastasis groups. (L) Quantitative analysis of the densities of CLEC2C + CD20 + cells and KLRB1 + PD1 + CD8 + cells in the primary and metastasis groups. (M) Quantitative analysis of the distances from GNB1 + cells to CLEC2C + CD20 + cells and from CLEC2C + CD20 + cells to KLRB1 + PD1 + CD8 + cells in the primary and metastasis groups. (N) Differences in GNB1 expression among tumours in CRC without metastasis and primary tumours in CRCLM, and liver metastasis in CRCLM. Blue: CRC without liver metastasis; Orange: Colon tumour in CRCLM; Red: Liver metastasis in CRCLM. (O) Pie chart showing the proportions of different GNB1 expression clusters and bar plots showing the effects of third-line immunotherapy in patients in the three clusters. (P) CEA expression decreased with increasing GNB1 expression. (Q) Changes in tumour volume found by CT scanning in patients with different GNB1 expression levels receiving third-line immunotherapy. All data are presented as the means ± SEMs; *p < 0.05. **p < 0.01

Similar articles

Cited by

References

    1. Li C, et al. Integrated omics of metastatic colorectal cancer. Cancer Cell. 2020;38:734-747 e739. 10.1016/j.ccell.2020.08.002. - PubMed
    1. Li W, et al. Multi-omics research strategies in ischemic stroke: a multidimensional perspective. Ageing Res Rev. 2022;81: 101730. 10.1016/j.arr.2022.101730. - PubMed
    1. Larsen SJ, Rottger R, Schmidt H, Baumbach J. E. Coli gene regulatory networks are inconsistent with gene expression data. Nucleic Acids Res. 2019;47:85–92. 10.1093/nar/gky1176. - PMC - PubMed
    1. Jannach D, Abdollahpouri H. A survey on multi-objective recommender systems. Front Big Data. 2023;6: 1157899. 10.3389/fdata.2023.1157899. - PMC - PubMed
    1. Radivojevic T, Costello Z, Workman K, Garcia Martin H. A machine learning automated recommendation tool for synthetic biology. Nat Commun. 2020;11:4879. 10.1038/s41467-020-18008-4. - PMC - PubMed

Substances