. 2024 Oct 24;12(1):219.
doi: 10.1186/s40168-024-01935-5.

A single-stranded based library preparation method for virome characterization

Affiliations

A single-stranded based library preparation method for virome characterization

Xichuan Zhai et al. Microbiome. .

Abstract

Background: The gut virome is an integral component of the gut microbiome, playing a crucial role in maintaining gut health. However, accurately depicting the entire gut virome is challenging due to the inherent diversity of genome types (dsDNA, ssDNA, dsRNA, and ssRNA) and topologies (linear, circular, or fragments), with subsequently biases associated with current sequencing library preparation methods. To overcome these problems and improve reproducibility and comparability across studies, universal or standardized virome sequencing library construction methods are highly needed in the gut virome study.

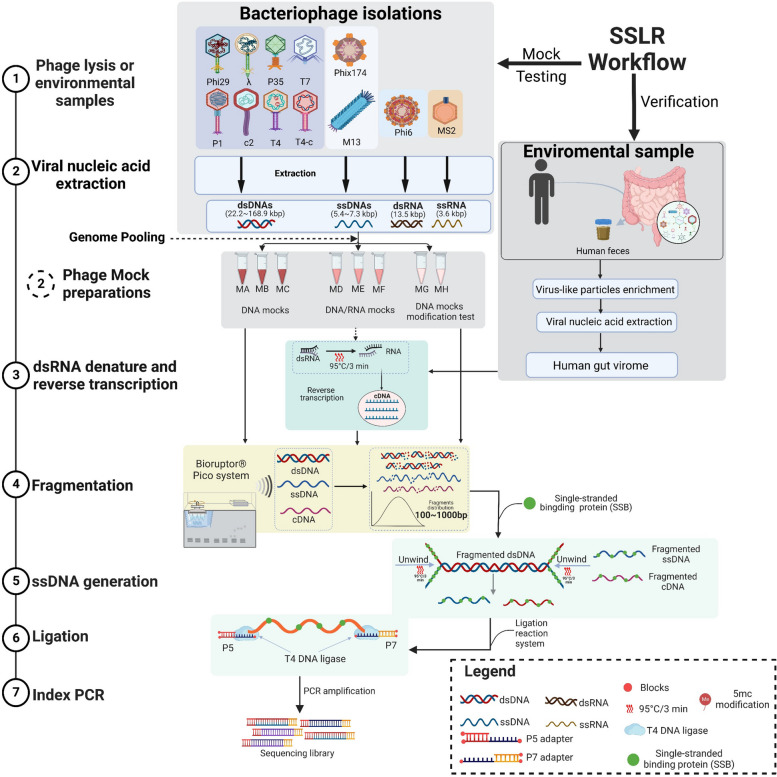
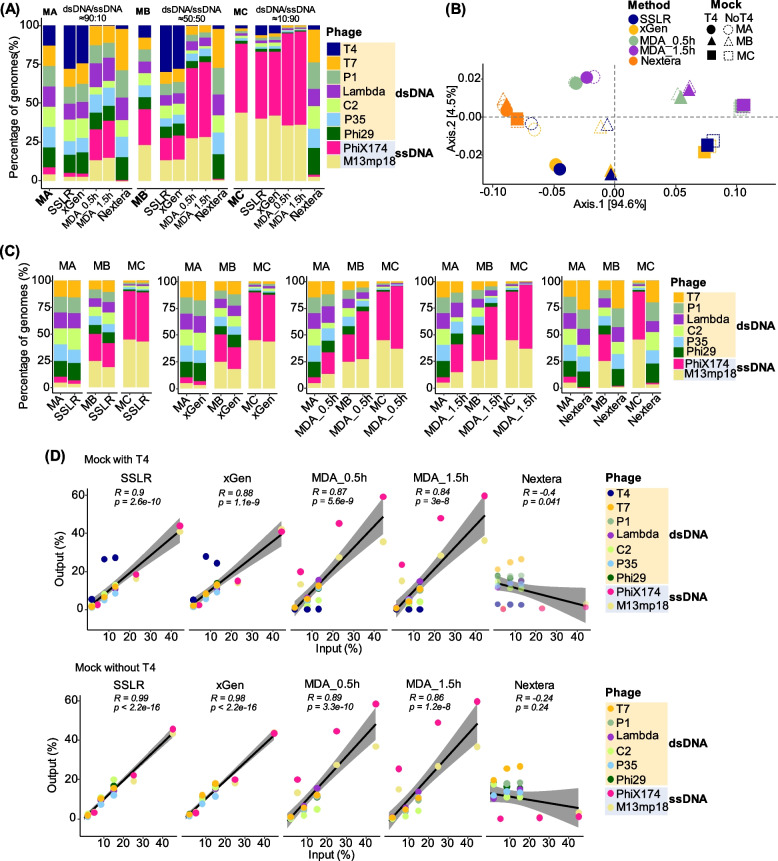
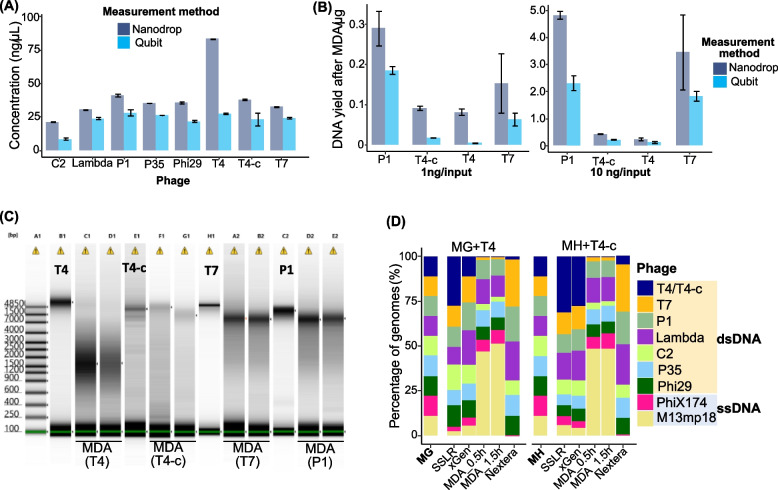
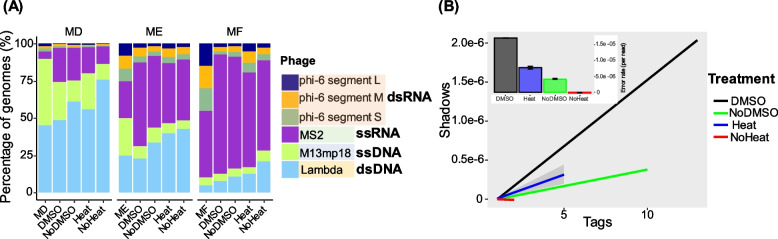
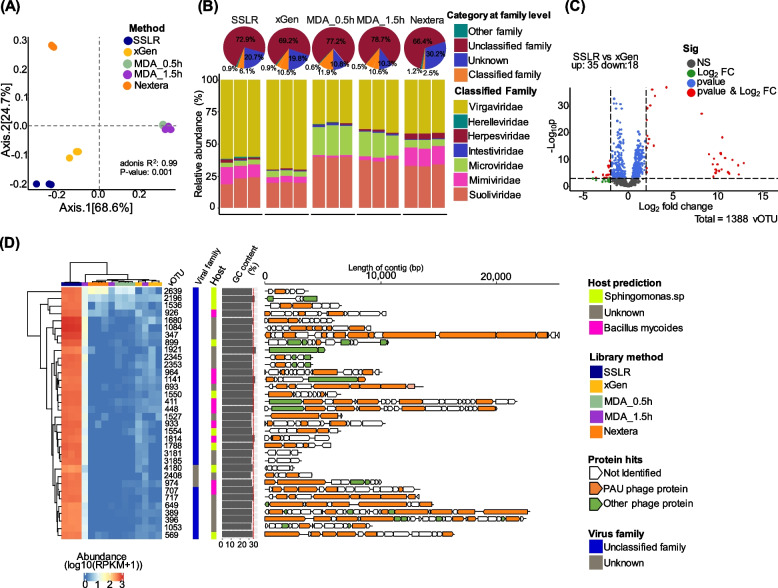
Results: We repurposed the ligation-based single-stranded library (SSLR) preparation method for virome studies. We demonstrate that the SSLR method exhibits exceptional efficiency in quantifying viral DNA genomes (both dsDNA and ssDNA) and outperforms existing double-stranded (Nextera) and single-stranded (xGen, MDA + Nextera) library preparation approaches in terms of minimal amplification bias, evenness of coverage, and integrity of assembling viral genomes. The SSLR method can be utilized for the simultaneous library preparation of both DNA and RNA viral genomes. Furthermore, the SSLR method showed its ability to capture highly modified phage genomes, which were often lost using other library preparation approaches.

Conclusion: We introduce and improve a fast, simple, and efficient ligation-based single-stranded DNA library preparation for gut virome study. This method is compatible with Illumina sequencing platforms and only requires ligation reagents within 3-h library preparation, which is similar or even better than the advanced library preparation method (xGen). We hope this method can be further optimized, validated, and widely used to make gut virome study more comparable and reproducible. Video Abstract.

Keywords: DsDNA virome; Gut virome; Modified nucleotides; Phage mock community; RNA virome; Single-stranded library; SsDNA virome.


Conflict of interest statement

The authors declare no competing interests.

Figures

Fig. 1
Fig. 1
Overview of study workflow. The reproposed library preparation method (SSLR) was indicated with seven steps (detailed information can be found from Fig. S1 and Supplementary file 1). Five different libraries were used to prepare and sequence three artificial bacteriophage mocks containing different proportions of the ssDNA phages (phiX174 and M13mp18) mixed with the dsDNA phages. These phage genome abundance values were calculated based on the quantity of dsDNA and ssDNA phages measured Qubit dsDNA (or ssDNA) HS Assay kit. MA, Mock A with a ratio of ~ 90:10 for dsDNA and ssDNA (Fig. S1E); MB, Mock B with a ratio of ~ 50:50 for dsDNA and ssDNA; MC, Mock C with a ratio of ~ 10:90 for dsDNA and ssDNA. MD, Mock D with a ratio of ~ 90:10 for DNA and RNA; ME, Mock E with a ratio of ~ 50:50 for DNA and RNA; MF, Mock F with a ratio of 10:90 for DNA and RNA (Fig. S1F). MG, Mock G contains the highly modified dsDNA T4 genome (T4) with equal ratio of all genomes; MH, Mock H contains less modified dsDNA T4 genome (T4-c) with equal ratio of all genomes (Fig. S1G)
Fig. 2
Fig. 2
Comparison of different library strategies for DNA mock communities. A Percentage of phage genomes with dsDNA T4 generated by different library preparation methods. Different colors indicate different phage genomes. B Principal coordinates analysis (PCoA) plots of bray–Curtis distance matrices. PCoA was used to plot the beta diversity of mock-associated communities using the bray matrix. Different colors indicate different library preparation methods, and different shapes indicate different DNA mock communities. The dark-filled shapes display the mock with dsDNA T4 genome and the non-filled without dsDNA T4. For each axis, in square brackets, the percentage of variation explained was reported. C Percentage of phage genomes without dsDNA T4 genome. D Pearson correlation coefficient (r) and two-tailed p-value between the expected and obtained read distributions (in percentage) in different DNAs phage mock communities with (top panel) or without (bottom panel) phage T4 genome. Five different libraries were used to prepare and sequence three artificial bacteriophage mocks containing different proportions of the ssDNA phage (phiX174 and M13mp18) mixed with the dsDNA phage. These phage genome abundance values were calculated based on the quantity of dsDNA and ssDNA phages measured Qubit dsDNA (or ssDNA) HS Assay kit. MA, Mock A with a ratio of ~ 90:10 for dsDNA and ssDNA; MB, Mock B with a ratio of ~ 50:50 for dsDNA and ssDNA; MC, Mock C with a ratio of ~ 10:90 for dsDNA and ssDNA
Fig. 3
Fig. 3
Quantification and MDA bias for highly modified T4 genome. A The concentrations of DNAs used in this study were measured by two different quantification methods (Qubit and NanoDrop). B MDA amplification differs in genomes. One and 10 ng of DNA from dsDNA P1, T4, T4-c, and T7 were amplified by 30 min of MDA and purified with Zymol Genomic Purification kit. The y-axis indicates the total yield of amplified MDA products (μg) and measured either by NanoDrop (red) or Qubit (blue). C The MDA amplification dsDNA products (T4, T4-c, P1, and T7) were visualized by TapeStation 4200 with genomic ScreenTape. D Percentage of dsDNA phage genomes with T4 or T4-c generated by different library preparation methods. Different colors indicate different phage genomes with equal input (11.11%). MG, Mock G contains high modification dsDNA T4 genome (T4) with equal ratio of all genomes; MH, Mock H contains lower modification dsDNA T4 genome (T4-c) with equal ratio of all genomes (Fig. S1G)
Fig. 4
Fig. 4
Comparison of the efficiency of SSLR on the simultaneous identification of DNA/RNA mock communities. SSLR was used to prepare and sequence four artificial virome containing different proportions of the DNA phage and RNA phage. A Effect of DMSO and heat treatment on the percentage of four phage genomes. These phage genome abundance values were calculated based on the quantity of DNA and RNA phages measured by NanoDrop. MD, Mock D with ratio of 90:10 for DNA and RNA; ME, Mock E with ratio of 50:50 for DNA and RNA; MF, Mock F with ratio of 10:90 for DNA and RNA. phi6 has 3 segments: large (6374 bp), medium (4063 bp), and small (2948 bp). B Heat treatment does not adversely affect sequencing error rates. The R package ShadowRegression estimates reference-free error rates (inset) based on a transform of the slope of read counts and their “shadows” (main plot line graphs). Shadows (y-axis) are a measure of the variation in read counts across different sequencing runs for the same sample. They are calculated by taking the logarithm of the ratio of read counts in one run to another run. A higher shadow value means a larger difference in read counts between the two runs. Tags (x-axis) are a measure of the abundance of reads for a given nucleotide position in a sample. They are calculated by taking the logarithm of the read count at that position. A higher tag value means a higher number of reads at that position. The figure shows the relationship between shadows and tags for different samples treated with or without heat/DMSO. The slope of this relationship is used to estimate the sequencing error rate for each sample, which is shown in the inset plots. The figures suggest that DMSO treatment does not affect the sequencing error rate significantly
Fig. 5
Fig. 5
Comparison of different library strategies for fecalvirome communities. A Principal coordinates analysis (PCoA) plots of Bray–Curtis distance matrices. PCoA was used to plot the beta diversity of viral-associated communities using the bray matrix. Different colors indicate different library preparation methods. For each axis, in square brackets, the percentage of variation explained was reported. B Representative taxonomic distribution (relative abundance) of the sequenced virome. Top pie chart shows the the percentage of the classified, unclassified and unknown at the taxa of family level. The bottom bar chart only includes the classified taxa at the taxonomical level of the family. The taxonomy of contigs was determined by querying the viral contigs against a database containing taxon signature genes for virus orthologous group hosted at www.vogdb.org. The unclassified are the contigs that cannot be assigned to any known viral taxonomy at the family level; the unknown is the contigs that are related to “viral dark matter.” C The volcano plot shows differentially abundant vOTUs identified from DESeq2 analysis, displaying those with a fold change of two or greater when comparing SSLR to xGen. Each dot represents a vOTU contig and is colored to indicate significance. Gray, not significant (NS); green, significant by log2 fold change (> 2); blue, significant by p-value (< 0.01); red, significant by log2 fold change and p-value. D Heatmap of the high abundance (RPKM) viral contigs that were highly enriched in SSLR method that does not present in the rest of methods. This figure shows a subset of the data presented in Fig. S9A. Different colors indicate different annotated protein, and directional boxes indicate open reading frames (ORFs) in the respective orientation. Non-filled arrows indicate no protein hits, and the rest of the colored arrows are hits to the majority of PAU proteins

Similar articles

Cited by

References

    1. Shkoporov AN, Hill C. Bacteriophages of the human gut: the “known unknown” of the microbiome. Cell Host Microbe. 2019;25:195–209. - PubMed
    1. Van Belleghem JD, Dąbrowska K, Vaneechoutte M, Barr JJ, Bollyky PL. Interactions between bacteriophage, bacteria, and the mammalian immune system. Viruses. 2019;11:10. - PMC - PubMed
    1. Liang G, Cobian-Guemes AG, Albenberg L, Bushman F. The gut virome in inflammatory bowel diseases. Curr Opin Virol. 2021;51:190–8. - PubMed
    1. Norman JM, et al. Disease-specific alterations in the enteric virome in inflammatory bowel disease. Cell. 2015;160:447–60. - PMC - PubMed
    1. Fernandes MA, et al. Enteric virome and bacterial microbiota in children with ulcerative colitis and Crohn disease. J Pediatr Gastroenterol Nutr. 2019;68:30–6. - PMC - PubMed

MeSH terms

LinkOut - more resources