. 2024 Oct 24;15(1):83.
doi: 10.1186/s13293-024-00661-9.

Age, sex, and cell type-resolved hypothalamic gene expression across the pubertal transition in mice

Affiliations

Age, sex, and cell type-resolved hypothalamic gene expression across the pubertal transition in mice

Dustin J Sokolowski et al. Biol Sex Differ. .

Abstract

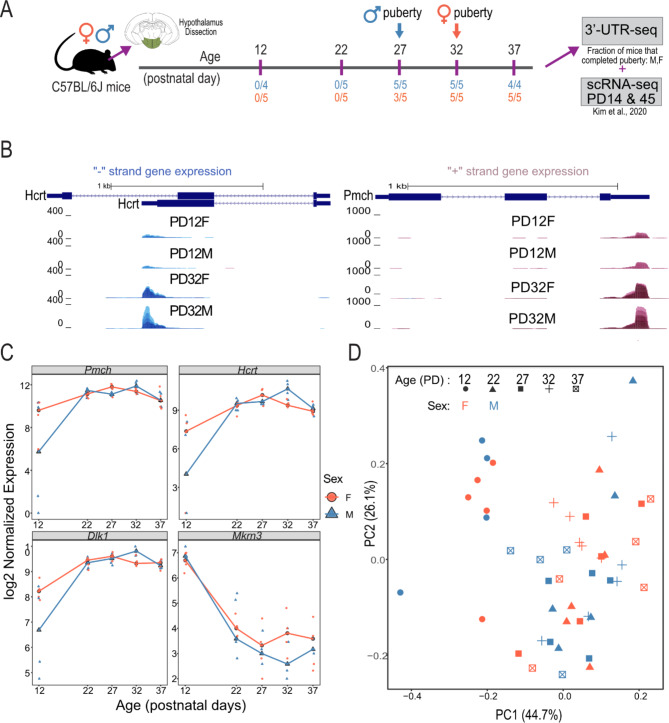
Background: The hypothalamus plays a central role in regulating puberty. However, our knowledge of the postnatal gene regulatory networks that control the pubertal transition in males and females is incomplete. Here, we investigate the age-, sex- and cell-type-specific gene regulation in the hypothalamus across the pubertal transition.

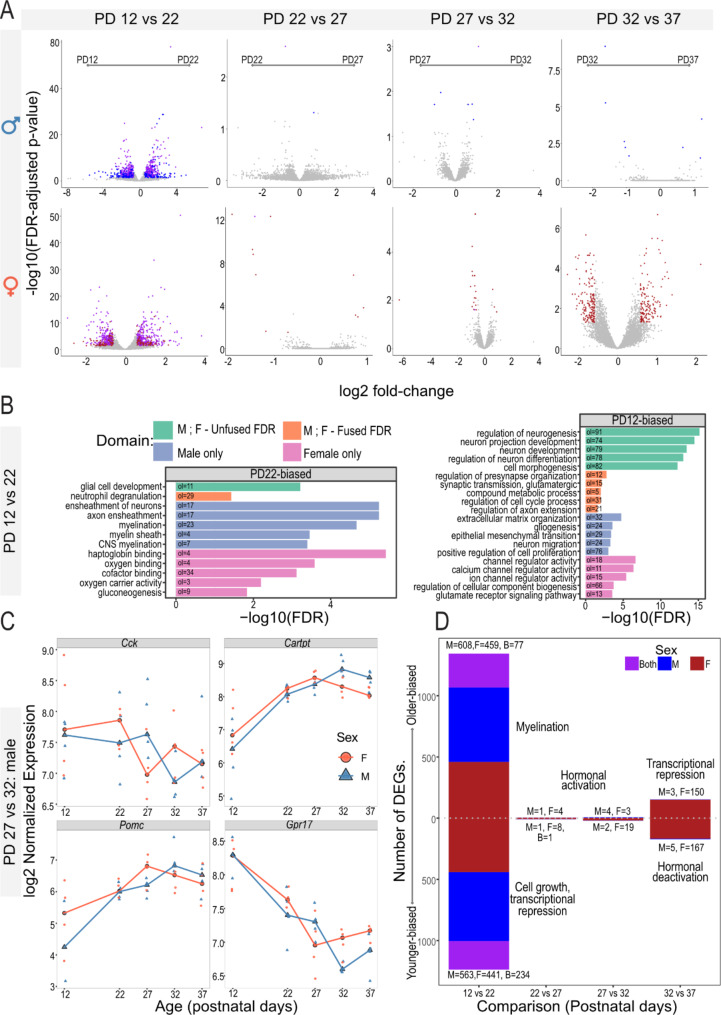
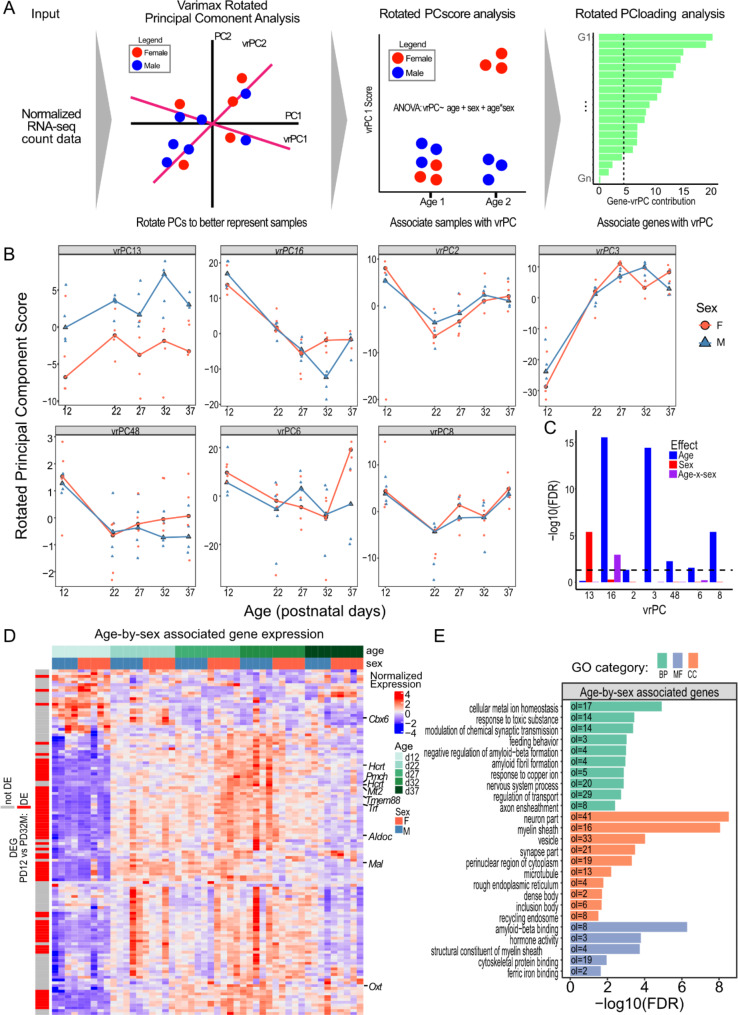
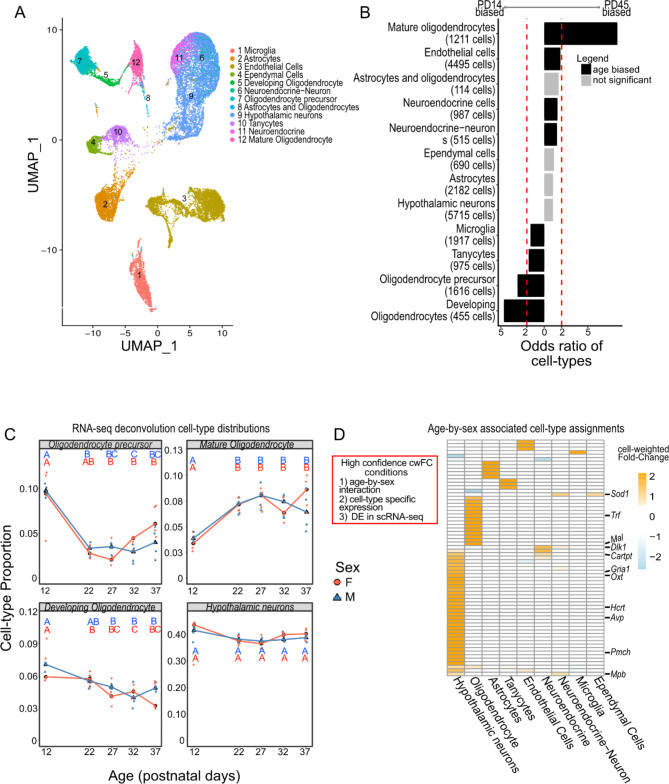
Methods: We used RNA-seq to profile hypothalamic gene expression in male and female mice at five time points spanning the onset of puberty (postnatal days (PD) 12, 22, 27, 32, and 37). By combining this data with hypothalamic single nuclei RNA-seq data from pre- and postpubertal mice, we assigned gene expression changes to their most likely cell types of origin. In our colony, pubertal onset occurs earlier in male mice, allowing us to focus on genes whose expression is dynamic across ages and offset between sexes, and to explore the bases of sex effects.

Results: Our age-by-sex pattern of expression enriched for biological pathways involved hormone production, neuronal activation, and glial maturation. Additionally, we inferred a robust expansion of oligodendrocytes precursor cells into mature oligodendrocytes spanning the prepubertal (PD12) to peri-pubertal (PD27) timepoints. Using spatial transcriptomic data from postpubertal mice, we observed the lateral hypothalamic area and zona incerta were the most oligodendrocyte-rich regions and that these cells expressed genes known to be involved in pubertal regulation.

Conclusion: Together, by incorporating multiple biological timepoints and using sex as a variable, we identified gene and cell-type changes that may participate in orchestrating the pubertal transition and provided a resource for future studies of postnatal hypothalamic gene regulation.


Conflict of interest statement

The authors declare that they have no competing interests.

Figures

Fig. 1
Fig. 1
Overview of the hypothalamic mouse transcriptome at five timepoints across pubertal development in males and females. A) Schematic of samples taken across pubertal development. Whole mice hypothalami were dissected at postnatal days (PD) 12, 22, 27, 32, and 37 in both male and female C57BL/6J mice. Arrows dictate the average age of puberty in males and females, respectively. Extracted hypothalamus samples underwent 3’UTR RNA-seq. B) Genome browser of the Hcrt (top) and Pmch (bottom) 3’UTR at PD12 and PD22 in males and females. C) Distribution of normalized counts of Pmch, Hcrt, Dlk1, and Mkr3 at every age and timepoint. The X-axis is age, and the Y-axis is log2-transformed RUVseq and ERCC-spike in normalized counts. Red lines and circles represent female samples, while blue lines and triangles represent male samples. D) Principal component analysis (PCA) of normalized gene expression across all samples and ages. The first two PCs are plotted with sexes designated with colour and ages designated by shape
Fig. 2
Fig. 2
Differentially expressed genes (DEGs) across postnatal development in the mouse hypothalamus. A) Volcano plot of differentially expressed genes in each pairwise timepoint. The X-axis is the log2(fold-change) of the DEG, and the Y-axis is the -log10 (FDR-adjusted P-value) of the DEG as identified by DESeq2. Genes in grey are not detected as DE (FDR-adjusted P-value < 0.05, absolute fold-change > 1.5). Genes in blue are DE in males, genes in red are DE in females, and genes in purple are DE at the same timepoint in both males and females. B) Barplot of enriched pathways derived from DEGs between PD12 and PD22 in male and female mice. Genes are separated by upregulated and downregulated DEGs. Barplots show the -log10(FDR-adjusted P-value) of enrichment. Green bars represent pathways detected in both sexes, orange bars represent pathways detected by integrating sexes, blue bars represent male-driven pathways, and pink bars represent female-driven pathways. C) Expression profile of the four remaining DEGs. D) Barplot summarizing the number and major theme of pairwise DEGs across each timepoint. The X-axis is each timepoint, and the Y-axis is the number of DEGs. Positive genes were older-biased, and negative genes were younger-biased. D) Expression profile of DEGs involved in hypogonadotropic hypogonadism. The X-axis is age, and the Y-axis is log2-transformed RUVseq and ERCC-spike in normalized counts. Red lines and circles represent female samples, while blue lines and triangles represent male samples. Expression profile of differentially expressed GWAS genes (right). Row-normalized heatmap of GWAS-associated genes that were also detected as differentially expressed in our RNA-seq data Rows are genes, and columns are samples
Fig. 3
Fig. 3
Evaluation of varimax-rotated principal component analysis revealed genes involved in sex-by-age interactions. A) Schematic of how varimax rotated PCA is applied to our data. B) Distribution of scores for enriched vrPCs. Male samples are triangles and blue lines, and female samples are circles and red lines. vrPC16 is highlighted because the genes associated with this vrPC are focused on for the rest of this study. C) Barplot showing the association between each significant varimax rotated PC (vrPC), age, and sex. The X-axis shows vrPCs whose scores are associated with age, sex, or an age-by-sex interaction (7/48 total vrPCs). Red bars show the significance of sex, blue bars show the significance of age, and purple bars show the significance of an age-by-sex interaction. D) Heatmap of the gene expression patterns of genes associated with vrPC16. Each row is a gene, and each column is a sample. The heatmap is populated by the log2-RUV-seq normalized gene expression of each gene. Rows are annotated by whether the gene displays pairwise expression in at least one pairwise timepoint. Columns are annotated by age and sex. E) Barplot of enriched pathways derived from genes strongly associated with rotated PC 16. Barplots show the -log10(FDR-adjusted P-value) of enrichment. Green bars represent pathways deriving from gene-ontology biology pathways, red bars represent pathways deriving from gene-ontology cellular components, and blue bars represent pathways deriving from gene-ontology molecular functions
Fig. 4
Fig. 4
Cell-type specific gene expression across the developing hypothalamus. A) Lower-dimension representation of scRNA-seq data in the PD14 and PD45 mouse hypothalamus with the Uniform Manifold Approximation and Projection (UMAP). Cell labels were identified using a mixture of labels provided by Kim et al., 2020 and unsupervised clustering. B) Distribution of cell proportions estimated from RNA-seq deconvolution at each age and time-point. The X-axis is age, and the Y-axis is estimated cell-type proportions. Red lines and circles represent female samples, while blue lines and triangles represent male samples. Letters represent significance using a Tukey post hoc test after identifying differences in cell-type proportion with ANOVA. C) Barplot of cell-type proportion differences within each cluster (Fisher’s exact-test). Red bars designate a fold-change of two between ages. Each column is a cell-type with the number of DEGs mapping to that cell-type in brackets. D) Heatmap of gene-normalized cell-weighted fold-changes (cwFold-changes) of the 129 age-by-sex associated genes and are DE in the complementary direction in the scRNA-seq data
Fig. 5
Fig. 5
Pseudotime of hypothalamic oligodendrocyte development. A) Lower-dimension representation of oligodendrocyte scRNA-seq data in the PD14 and PD45 mouse hypothalamus with the Uniform Manifold Approximation and Projection (UMAP) overlaid with the pseudotime trajectory identified with Slingshot. Points are cells coloured by cell-type. and the line is the plotted pseudotime trajectory measured with Slingshot, starting with OPCs and plotted with the tradeSeq R package. B) Heatmap of transcription factors associated with pseudotime. C) Heatmap of puberty-associated GWAS genes associated with pseudotime. D) Heatmap of oligodendrocyte-mapped age-by-sex associated genes associated with pseudotime. For a gene to be included, it must be associated with an age-by-sex interaction (i.e., varimax 16), mapping to oligodendrocyte precursor cells, developing oligodendrocytes, or mature oligodendrocytes with scMappR, and associate with pseudotime. For B-D, rows are genes associated with pseudotime. Columns are portions of the pseudotime trajectory blocked into 200 smoothers using tradeSeq. Heat is measured by scaling the predicted smoothers with the scale function in R

References

    1. Romanov RA, Zeisel A, Bakker J, Girach F, Hellysaz A, Tomer R, et al. Molecular interrogation of hypothalamic organization reveals distinct dopamine neuronal subtypes. Nat Neurosci. 2017;20:176–88. - PMC - PubMed
    1. Chen R, Wu X, Jiang L, Zhang Y. Single-cell RNA-Seq reveals hypothalamic cell diversity. Cell Rep. 2017;18:3227–41. - PMC - PubMed
    1. Kim DW, Washington PW, Wang ZQ, Lin SH, Sun C, Ismail BT, et al. The cellular and molecular landscape of hypothalamic patterning and differentiation from embryonic to late postnatal development. Nat Commun. 2020;11:4360. - PMC - PubMed
    1. Zhou S, Zang S, Hu Y, Shen Y, Li H, Chen W, et al. Transcriptome-scale spatial gene expression in rat arcuate nucleus during puberty. Cell Biosci. 2022;12:8. - PMC - PubMed
    1. Sokolowski DJ, Faykoo-Martinez M, Erdman L, Hou H, Chan C, Zhu H, et al. Single-cell mapper (scMappR): using scRNA-seq to infer the cell-type specificities of differentially expressed genes. NAR Genom Bioinform. 2021;3:lqab011. - PMC - PubMed

LinkOut - more resources