. 2024 Oct 24;16(1):236.
doi: 10.1186/s13195-024-01582-w.

EEG biomarkers in Alzheimer's and prodromal Alzheimer's: a comprehensive analysis of spectral and connectivity features

Affiliations

EEG biomarkers in Alzheimer's and prodromal Alzheimer's: a comprehensive analysis of spectral and connectivity features

Chowtapalle Anuraag Chetty et al. Alzheimers Res Ther. .

Abstract

Background: Biomarkers of Alzheimer's disease (AD) and mild cognitive impairment (MCI, or prodromal AD) are highly significant for early diagnosis, clinical trials and treatment outcome evaluations. Electroencephalography (EEG), being noninvasive and easily accessible, has recently been the center of focus. However, a comprehensive understanding of EEG in dementia is still needed. A primary objective of this study is to investigate which of the many EEG characteristics could effectively differentiate between individuals with AD or prodromal AD and healthy individuals.

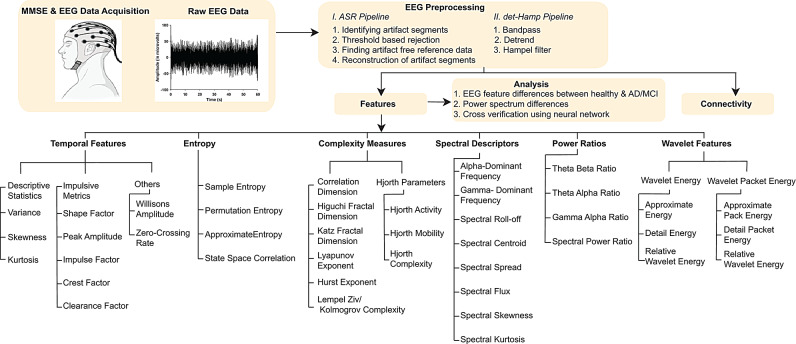
Methods: We collected resting state EEG data from individuals with AD, prodromal AD, and normal cognition. Two distinct preprocessing pipelines were employed to study the reliability of the extracted measures across different datasets. We extracted 41 different EEG features. We have also developed a stand-alone software application package, Feature Analyzer, as a comprehensive toolbox for EEG analysis. This tool allows users to extract 41 EEG features spanning various domains, including complexity measures, wavelet features, spectral power ratios, and entropy measures. We performed statistical tests to investigate the differences in AD or prodromal AD from age-matched cognitively normal individuals based on the extracted EEG features, power spectral density (PSD), and EEG functional connectivity.

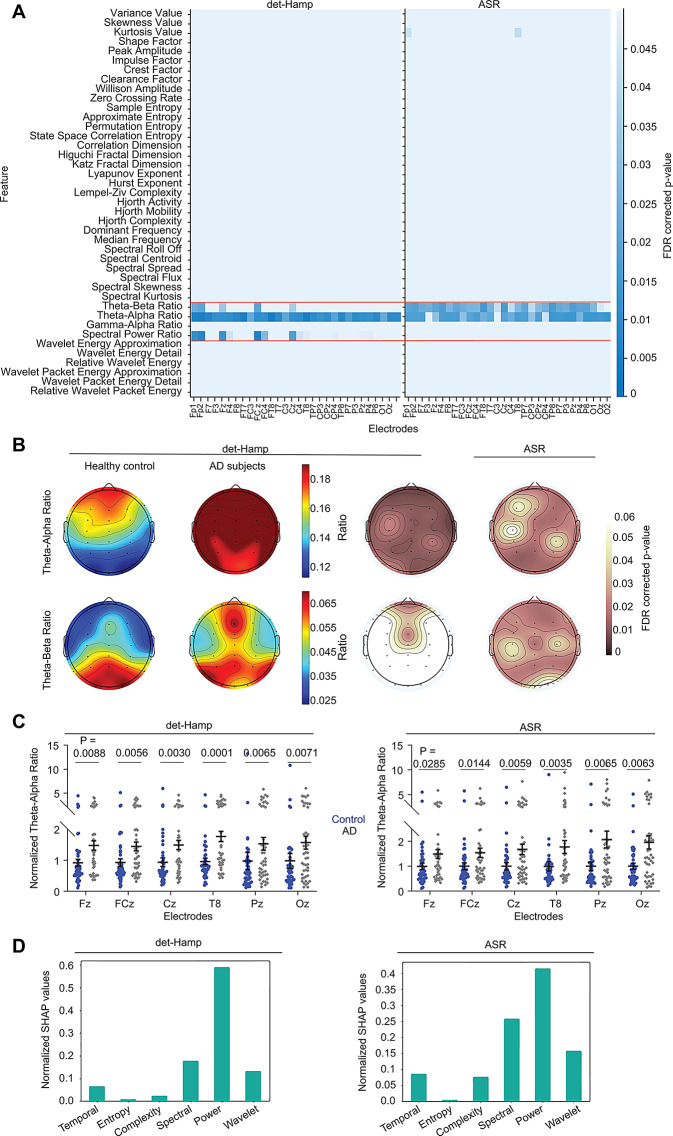
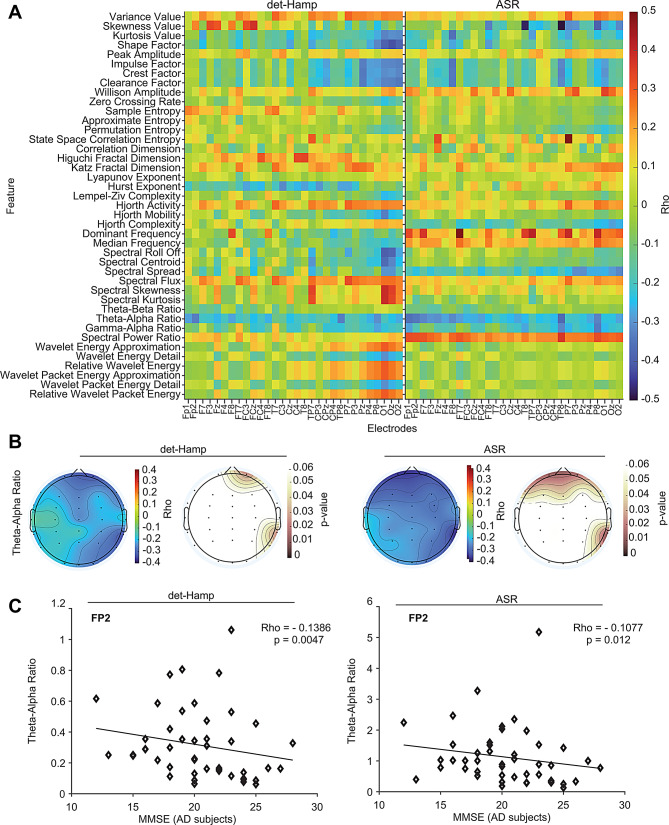
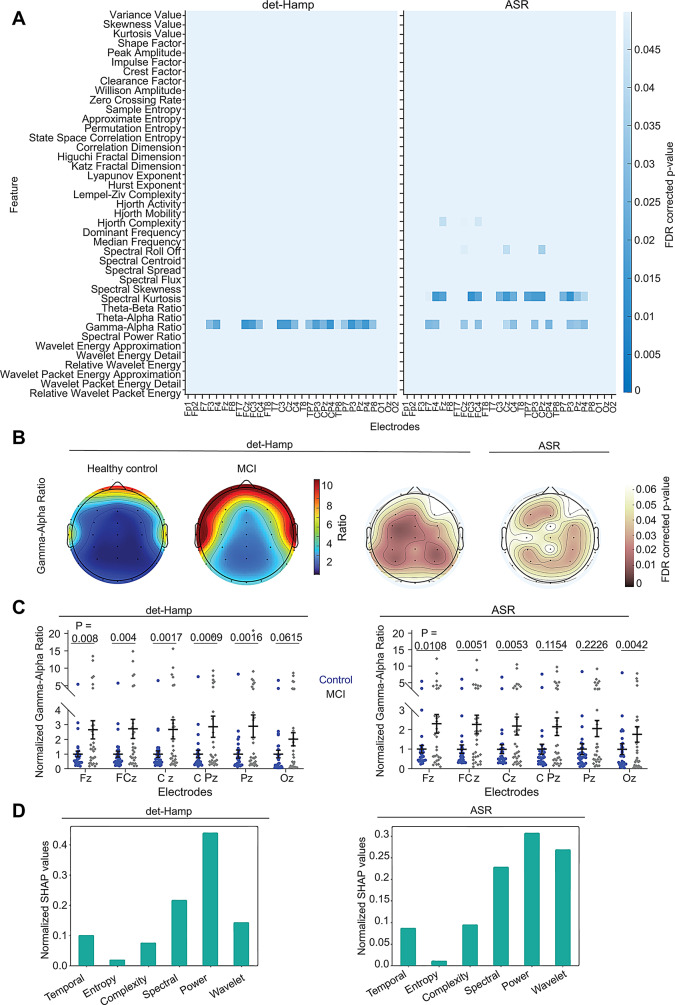
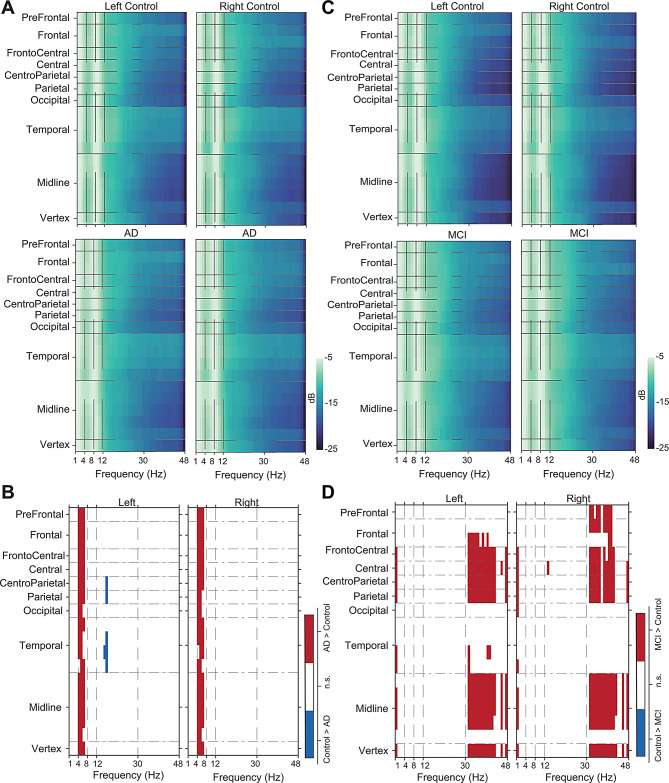
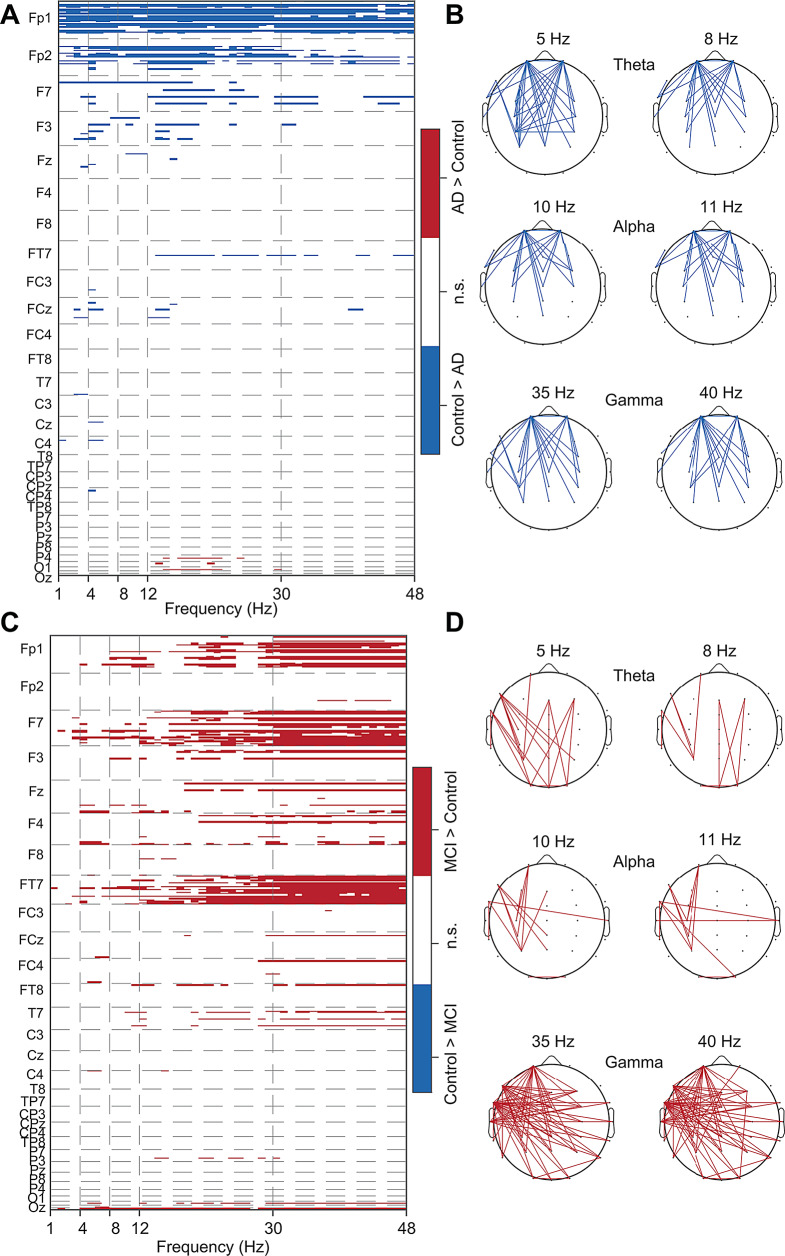
Results: Spectral power ratio measures such as theta/alpha and theta/beta power ratios showed significant differences between cognitively normal and AD individuals. Theta power was higher in AD, suggesting a slowing of oscillations in AD; however, the functional connectivity of the theta band was decreased in AD individuals. In contrast, we observed increased gamma/alpha power ratio, gamma power, and gamma functional connectivity in prodromal AD. Entropy and complexity measures after correcting for multiple electrode comparisons did not show differences in AD or prodromal AD groups. We thus catalogued AD and prodromal AD-specific EEG features.

Conclusions: Our findings reveal that the changes in power and connectivity in certain frequency bands of EEG differ in prodromal AD and AD. The spectral power, power ratios, and the functional connectivity of theta and gamma could be biomarkers for diagnosis of AD and prodromal AD, measure the treatment outcome, and possibly a target for brain stimulation.

Keywords: Aging; Brain connectivity; EEG-based biomarker; Eyes closed EEG; Gamma; Pairwise phase consistency; Slowing of oscillations; Theta-alpha power ratio.


Conflict of interest statement

The authors declare no competing interests.

Figures

Fig. 1
Fig. 1
Studying the relationship between EEG and cognition. The schematic shows the outline of the data pre-processing, EEG feature extraction, and analysis. At the bottom, a comprehensive cataloging and classification of various EEG features extracted and analyzed are shown (see Supplementary Methods)
Fig. 2
Fig. 2
Widespread power ratio changes in AD. (A) Heatmaps show Wilcoxon Rank-sum test differences of EEG features between control and AD for the det-Hamp (left) and ASR (right) pipelines after FDR correction. Scalp electrodes (channels) and EEG features are shown on the horizontal (X) and vertical (Y) axes, respectively. Power ratios that show robust differences are highlighted (orange line). (B) Topographical plots show the distribution of the theta/alpha power ratio (top) and theta/beta power ratio (bottom), averaged across all subjects in healthy control (left) and AD (middle left). Statistically significant scalp locations sustaining FDR correction are shown for the det-Hamp (middle right) and ASR (right) pipelines. (C) The normalized theta/alpha ratio for representative electrodes for the det-Hamp (left) and ASR pipelines (right, Wilcoxon Rank-sum test). Data points represent subjects. (D) The normalized cumulative mean of absolute SHAP values for det-Hamp and ASR pipelines are shown
Fig. 3
Fig. 3
Correlation of EEG features with MMSE scores in AD subjects. (A) Heatmaps show Spearman’s rank correlation between EEG features and MMSE of AD subjects using det-Hamp (left) and ASR (right) pipelines. (B) Topographical plots show the correlation between theta/alpha power ratio and MMSE across all electrodes using det-Hamp (left) and ASR (middle right) pipelines. Correlations with significant P values using det-Hamp (left middle) and ASR (right) are shown. (C) The correlation between theta/alpha power ratio and MMSE of AD subjects for representative FP2 electrode (rho = -0.1386, P = 0.0047) or ASR (rho = -0.1077, P = 0.012) pipelines are shown
Fig. 4
Fig. 4
Enhanced gamma alpha power ratio in prodromal AD. Enhanced gamma/alpha power ratio in prodromal AD. (A) Heatmaps show EEG feature differences between healthy control and prodromal AD for the det-Hamp (left) and ASR (right) pipelines after FDR correction. (B) The distribution of the gamma/alpha power ratios averaged across all subjects in healthy control (left) and prodromal AD (middle left). The topographic plots with statistically significant scalp locations sustaining FDR correction are shown for the det-Hamp (middle right) and ASR (right) pipelines. (C) Plots show the normalized gamma/alpha ratios for det-Hamp (left) and ASR (right, Wilcoxon Rank-sum test) pipelines from Cohort 3 (prodromal AD). Data points represent subjects. (D) The normalized cumulative mean of absolute SHAP values are shown
Fig. 5
Fig. 5
Changes in theta power in AD and gamma power in prodromal AD. (A) Heatmaps show the average EEG power in different areas across left and right brain hemispheres in controls (N = 46) and AD subjects (N = 46). (B) PSD differences between controls and AD after FDR correction. (C) Heatmaps show the average EEG power in different areas across left and right brain hemispheres between controls (N = 30) and prodromal AD subjects (N = 30). (D) PSD differences between control and prodromal AD after FDR correction are shown
Fig. 6
Fig. 6
Altered theta connectivity in AD and gamma connectivity in prodromal AD. (A) Heatmap shows the PPC differences between controls and AD. (B) The connectivity patterns in AD compared to age-matched control subjects in theta, alpha, and slow gamma bands. (C) Heatmap shows the PPC differences between controls and prodromal AD. (D) The connectivity patterns in prodromal AD in theta, alpha, and slow gamma bands. The red and blue colors represent the measures studied statistically significantly (FDR corrected P < 0.05) higher and lower in AD/prodromal AD than in the control, respectively. The Y- axis labels in the A and C represent the seed electrode for connectivity with other remaining electrodes

References

    1. (2023). 2023 Alzheimer’s disease facts and figures. Alzheimer’s Dement. 10.1002/alz.13016 - PubMed
    1. Rowley PA, et al. Amyloid and tau PET imaging of Alzheimer Disease and other neurodegenerative conditions. Seminars Ultrasound CT MRI. 2020. 10.1053/j.sult.2020.08.011. - PubMed
    1. Frontzkowski L, et al. Earlier Alzheimer’s disease onset is associated with tau pathology in brain hub regions and facilitated tau spreading. Nat Commun. 2022. 10.1038/s41467-022-32592-7. - PMC - PubMed
    1. Liddelow SA, et al. Neurotoxic reactive astrocytes are induced by activated microglia. Nature. 2017. 10.1038/nature21029. - PMC - PubMed
    1. van de Haar HJ et al. (2016). Blood-Brain Barrier Leakage in Patients with Early Alzheimer Disease. Radiology. 10.1148/radiol.2016152244 - PubMed

LinkOut - more resources