Meta-Analysis
. 2024 Oct 15;45(15):e70046.
doi: 10.1002/hbm.70046.

Macroscale Gradient Dysfunction in Alzheimer's Disease: Patterns With Cognition Terms and Gene Expression Profiles

Affiliations
Meta-Analysis

Macroscale Gradient Dysfunction in Alzheimer's Disease: Patterns With Cognition Terms and Gene Expression Profiles

Dawei Wang et al. Hum Brain Mapp. .

Abstract

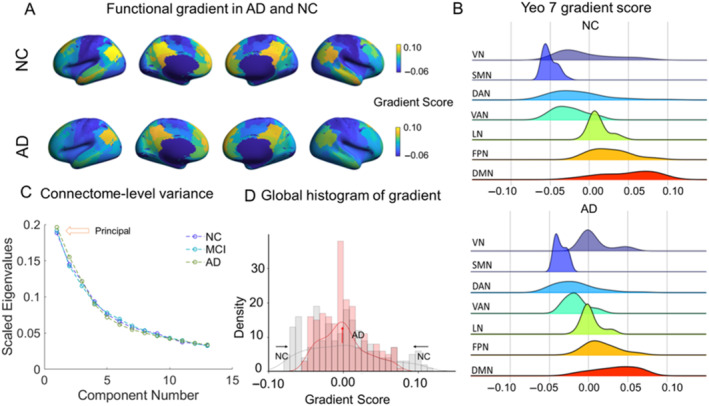
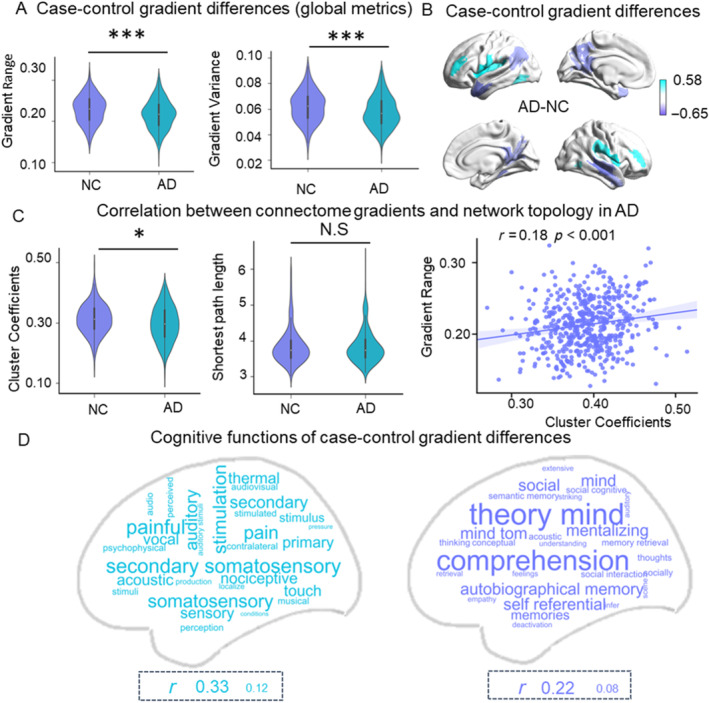
Macroscale functional gradient techniques provide a continuous coordinate system that extends from unimodal regions to transmodal higher-order networks. However, the alterations of these functional gradients in AD and their correlations with cognitive terms and gene expression profiles remain to be established. In the present study, we directly studied the functional gradients with functional MRI data from seven scanners. We adopted data-driven meta-analytic techniques to unveil AD-associated changes in the functional gradients. The principal primary-to-transmodal gradient was suppressed in AD. Compared to NCs, AD patients exhibited global connectome gradient alterations, including reduced gradient range and gradient variation, increased gradient scores in the somatomotor, ventral attention, and frontoparietal regions, and decreased in the default mode network. More importantly, the Gene Ontology terms of biological processes were significantly enriched in the potassium ion transport and protein-containing complex remodeling. Our compelling evidence provides a new perspective in understanding the connectome alterations in AD.

Keywords: Alzheimer's disease; functional gradient; microscale transcriptome profile.


Figures

FIGURE 1
FIGURE 1
(A) The principal gradient of connectivity in AD and NC groups. (B) A well‐established functional community decomposition is applied to summarize surface‐wide findings; the Brainnetome website provided the maps of the region of interest (ROIs) into the Yeo 7 networks (http://atlas.brainnetome.org/download.html). (C) The explanation ratio of connectome‐level variance is explained by the top 13 components obtained from the diffusion embedding algorithm in AD, MCI and NC. (D) Global histogram of gradients in AD and NC groups. Abbreviations: DAN, dorsal attention network; DMN, default mode network; FPN, frontoparietal network; LN, limbic network; SMN, sensorimotor network; VAN, ventral attention network; VN, visual network.
FIGURE 2
FIGURE 2
Case–control differences of the gradient metrics. (A) Case–control principal gradient differences in the global metrics (ANOVA analysis). The statistical significance threshold for the global gradient metrics was set to p < 0.05. (B) ROI‐wise comparisons in the primary‐to‐transmodal gradient between groups (p < 0.05/N, N = 210, FWE correction). (C) Case–control differences in the clustering coefficient (Cp) and the association between Cp and gradient range ([ANOVA analysis]). The statistical significance threshold for the network topology metrics was set to p < 0.05. (D) Association between meta‐analytic cognitive terms and AD‐related connectome gradient alterations. Word cloud plots show the relationships between meta‐analytic cognitive terms and AD's higher (cyan) or lower (purple) gradient scores. The font size was scaled according to the correlation of meta‐analytic cognitive terms and AD‐related connectome gradient alterations.
FIGURE 3
FIGURE 3
Gene expression profiles related to AD‐related alterations in module dynamics and gene expression profiles. (A) Gene expression profiles across 202 brain areas. (B) The explanation ratios for the top 10 components were obtained from the partial least squares (PLS) regression analysis. (C) Spatial patterns in case–control differences and PLS1 scores. (D) The correlation between PLS1 scores and case–control difference. (E) Enrichment analysis of gene ontology terms was observed for PLS1 gene weights.

Similar articles

Cited by

References

    1. Abrigo, J. , Shi L., Luo Y., et al. 2019. “Standardization of Hippocampus Volumetry Using Automated Brain Structure Volumetry Tool for an Initial Alzheimer's Disease Imaging Biomarker.” Acta Radiologica 60, no. 6: 769–776. 10.1177/0284185118795327. - DOI - PubMed
    1. Alderson‐Day, B. , Diederen K., Fernyhough C., et al. 2016. “Auditory Hallucinations and the Brain's Resting‐State Networks: Findings and Methodological Observations.” Schizophrenia Bulletin 42, no. 5: 1110–1123. 10.1093/schbul/sbw078. - DOI - PMC - PubMed
    1. Altmann, A. , Ng B., Landau S. M., Jagust W. J., Greicius M. D., and Alzheimer's Disease Neuroimaging Iniative . 2015. “Regional Brain Hypometabolism Is Unrelated to Regional Amyloid Plaque Burden.” Brain 138, no. Pt 12: 3734–3746. 10.1093/brain/awv278. - DOI - PMC - PubMed
    1. Amadoruge, P. C. , and Barnham K. J.. 2011. “Alzheimer's Disease and Metals: A Review of the Involvement of Cellular Membrane Receptors in Metallosignalling.” International Journal of Alzheimer's Disease 2011: 542043. 10.4061/2011/542043. - DOI - PMC - PubMed
    1. Bayrak, S. , Khalil A. A., Villringer K., et al. 2019. “The Impact of Ischemic Stroke on Connectivity Gradients.” Neuroimage. Clinical 24: 101947. 10.1016/j.nicl.2019.101947. - DOI - PMC - PubMed

Publication types

MeSH terms