. 2025 Jan;37(3):e2409731.
doi: 10.1002/adma.202409731. Epub 2024 Oct 24.

Microgels With Electrostatically Controlled Molecular Affinity to Direct Morphogenesis

Affiliations

Microgels With Electrostatically Controlled Molecular Affinity to Direct Morphogenesis

Sebastian Kühn et al. Adv Mater. 2025 Jan.

Abstract

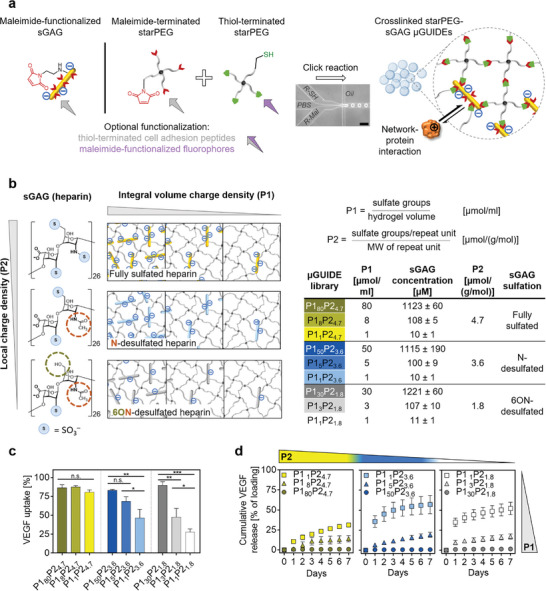
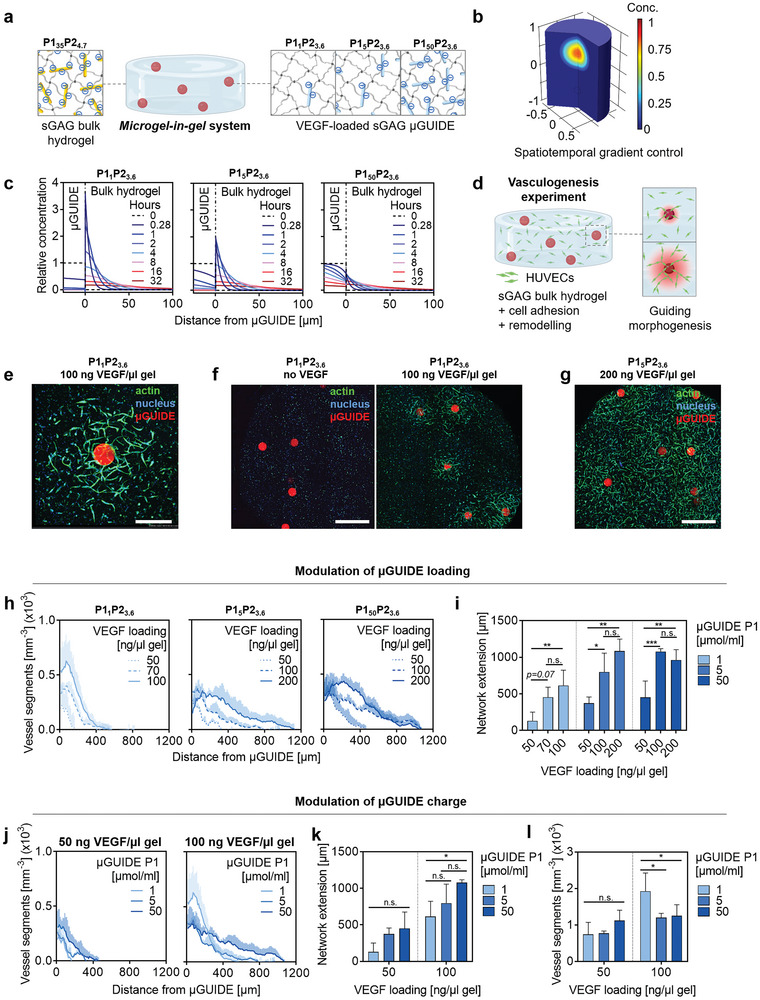
Concentration gradients of soluble signaling molecules-morphogens-determine the cellular organization in tissue development. Morphogen-releasing microgels have shown potential to recapitulate this principle in engineered tissue constructs, however, with limited control over the molecular cues in space and time. Inspired by the functionality of sulfated glycosaminoglycans (sGAGs) in morphogen signaling in vivo, a library of sGAG-based microgels is developed and designated as µGel Units to Instruct Development (µGUIDEs). Adjustment of the microgel's sGAG sulfation patterns and concentration enabled the programming of electrostatic affinities that control the release of morphogens. Based on computational analyses of molecular transport processes, µGUIDEs provided unprecedented precision in the spatiotemporal modulation of vascular endothelial growth factor (VEGF) gradients in a microgel-in-gel vasculogenesis model and kidney organoid cultures. The versatile approach offers new options for creating morphogen signaling centers to advance the understanding of tissue and organ development.

Keywords: VEGF; artificial signaling centers; beads; heparin; kidney organoids; microgels; morphogen gradients; sulfated glycosaminoglycans; vascular morphogenesis.


Conflict of interest statement

U.F. and C.W. are co‐inventors of a patent (WO2010060485A1) covering the hydrogel materials used in this study. They also hold shares in the spin‐off company ZetaScience GmbH, Dresden, offering customized hydrogel precursors.

Figures

Figure 1
Figure 1
Fabrication and characterization of starPEG‐sGAG µGUIDEs for spatiotemporally controlled morphogen administration. a), Overview of starPEG‐sGAG µGUIDE synthesis via thiol‐maleimide Michael type addition (bio‐orthogonal click reaction). Microfluidic flow‐focusing (scale bar = 200 µm) is used for µGUIDE fabrication. The modular design allows for µGUIDE customization through the choice of (sGAG and starPEG) building blocks and further functionalization (e.g., conjugation of adhesion peptides or fluorophores). b), Left: The morphogen affinity of µGUIDEs is dominated by electrostatic interactions, which is governed by their integral space charge density (P1, sGAG volume concentration) and the local charge density (P2, sGAG sulfation pattern). The ratio of maleimide‐functionalized sGAG and starPEG components determines P1, while the choice of the sGAG type (heparin or heparin derivatives with selectively removed sulfate groups at the N‐ and/or 6O‐position) governs P2. Right: Calculation of P1 and P2 (top), and nomenclature and charge properties of the starPEG‐sGAG µGUIDE library (bottom). c,d), Modulation of the morphogen (VEGF) uptake (c) and release (d) from µGUIDEs of different P1 and P2 properties (diameter ≈ 65 µm). Of note, charge adjustment on the network level (through P1) was observed to primarily control morphogen release, whereas the sGAG molecular characteristics (P2) defined the release modulation range. P‐values for all comparisons in (c) were <0.018. Data are shown as mean ± s.d. (n = 3).
Figure 2
Figure 2
µGUIDEs to generate localized VEGF gradients that direct HUVEC network formation in microgel‐in‐gel systems. a), Schematic overview of the microgel‐in‐gel setup and charge parameters (P1, P2) of the µGUIDE (microgel) and bulk gel components. b,c), VEGF gradient simulation in (cell‐free) microgel‐in‐gel systems using a reaction‐diffusion model for three µGUIDE types with N‐desulfated heparin: P11P23.6 (left), P15P23.6 (center), and P150P23.6 (right) demonstrating the effect of the µGUIDE charge on the gradient formation. The VEGF concentration is shown relative to the initial µGUIDE loading (freely diffusing + sGAG‐bound VEGF). d), Scheme of vasculogenesis experiment, embedding µGUIDEs together with HUVECs in an sGAG‐based, in situ‐crosslinking bulk hydrogel matrix. Defined µGUIDE and bulk gel charge parameters (P1, P2) allow for precise spatiotemporal control of vascular network formation. Bulk hydrogels are additionally functionalized with peptides to promote cell adhesion and protease‐driven cellular remodeling. e), Representative image of local network assembly around a VEGF‐loaded µGUIDE. Scale bar, 400 µm. f), P11P23.6 µGUIDEs without (left) and with 100 ng VEGF/µl gel (right). Scale bar, 800 µm). g), P15P23.6 µGUIDEs with 200 ng VEGF/µl gel. Scale bar, 800 µm). h), Effect of the µGUIDE loading on the EC network formation for P11P23.6 (left), P15P23.6 (center), and P150P23.6 (right) µGUIDEs. The number of vessel segments from the negative control (µGUIDEs without VEGF) has been subtracted. i), Extension of the cellular response for different µGUIDE loadings. j), Effect of the µGUIDE charge on the EC network formation for loadings of 50 ng VEGF/µl gel (left) or 100 ng VEGF/µl gel (right). The same experimental data as in (f). k), Extension of the cellular response for different µGUIDE charges. The same experimental data as in (g). l, EC network density within the first 150 µm from the µGUIDEs for the differently charged µGUIDEs and VEGF loadings. For all experiments and simulations, µGUIDEs with a diameter of ≈185 µm were used. Data are shown as mean ± s.d. (n = 3).
Figure 3
Figure 3
µGUIDEs as engineered signaling centers to locally stimulate kidney organoid vascularization. a,b), Colocalization of EC networks and emerging epithelial structures in human iPSC‐based kidney organoid cultures. a), Day 7 immunofluorescence staining showing PAX2+ RVs and CD31+ ECs. Scale bars: 1 mm (left) and 500 µm (right). b), Day 17 Immunofluorescence staining highlighting WT1+ glomeruli, LTL+ proximal tubule cells, and CD31+ ECs. Scale bars: 1 mm (left), 500 µm (right). c), Schematic representation of the µGUIDE deposition within kidney organoids. d), 3D simulation of the kidney organoid transwell culture depicting the VEGF gradient formation from starPEG‐sGAG µGUIDEs using a reaction‐diffusion model. The simulations show the concentration profiles of freely diffusing VEGF (normalized by initial µGUIDE loading) between two adjacent µGUIDEs, 100 µm above the organoid base (dashed line in the schematic on the top left). The µGUIDE integral charge density (P1) is concluded to determine the duration of the VEGF gradient, from short‐term (hours) to long‐term (days). e), Phase contrast images of kidney organoids with P15P23.6 µGUIDEs at day 0 (left; scale bar: 1 mm) and day 7 (right; scale bar: 200 µm). The arrowhead in the right image indicates a µGUIDE. f), Day 7 confocal images of kidney organoids cultured with VEGF‐loaded µGUIDEs (w/ VEGF), unloaded µGUIDEs (w/o VEGF) and no µGUIDEs (w/o µGUIDE). Scale bars, 1 mm. g), Quantitative analysis of the EC response (CD31 coverage area) to VEGF gradients around and between µGUIDEs at day 7. Control regions of interest (ROIs) of identical size were positioned in organoids without µGUIDEs. h,i), Analysis of the interactions between RVs and ECs. h), Confocal images of day 7 organoids stained for PAX2+ RVs and CD31+ ECs, with magenta indicating the contact area. Scale bar, 500 µm. i), Quantitative analysis of the RV‐EC contact. For all experiments, µGUIDEs with a diameter of ≈ 182 µm were used. Data are shown as mean ± s.d. (n = 4).

Similar articles

References

    1. Briscoe J., Small S., Dev 2015, 142, 3996. - PMC - PubMed
    1. Rogers K. W., Schier A. F., Annu. Rev. Cell Dev. Biol. 2011, 27, 377. - PubMed
    1. Regier M. C., Tokar J. J., Warrick J. W., Pabon L., Berthier E., Beebe D. J., Stevens K. R., Sci. Rep. 2019, 9, 6433. - PMC - PubMed
    1. Manfrin A., Tabata Y., Paquet E. R., Vuaridel A. R., Rivest F. R., Naef F., Lutolf M. P., Nat. Methods 2019, 16, 640. - PubMed
    1. Homan K. A., Gupta N., Kroll K. T., Kolesky D. B., Skylar‐Scott M., Miyoshi T., Mau D., Valerius M. T., Ferrante T., Bonventre J. V., Lewis J. A., Morizane R., Nat. Methods 2019, 16, 255. - PMC - PubMed

MeSH terms

LinkOut - more resources