

Toward quantitative CEST imaging of glutamate in the mouse brain using a multi-pool exchange model calibrated by 1H-MRS
- PMID: 39449296
- PMCID: PMC11680732
- DOI: 10.1002/mrm.30353
Toward quantitative CEST imaging of glutamate in the mouse brain using a multi-pool exchange model calibrated by 1H-MRS
Abstract
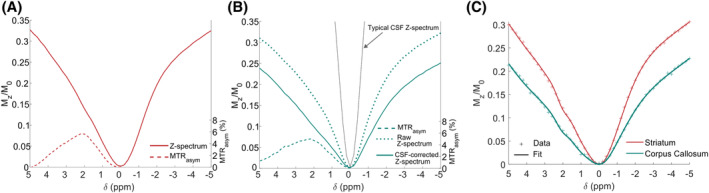
Purpose: To develop a CEST quantification model to map glutamate concentration in the mouse brain at 11.7 T, overcoming the limitations of conventional glutamate-weighted CEST (gluCEST) contrast (magnetization transfer ratio with asymmetric analysis).
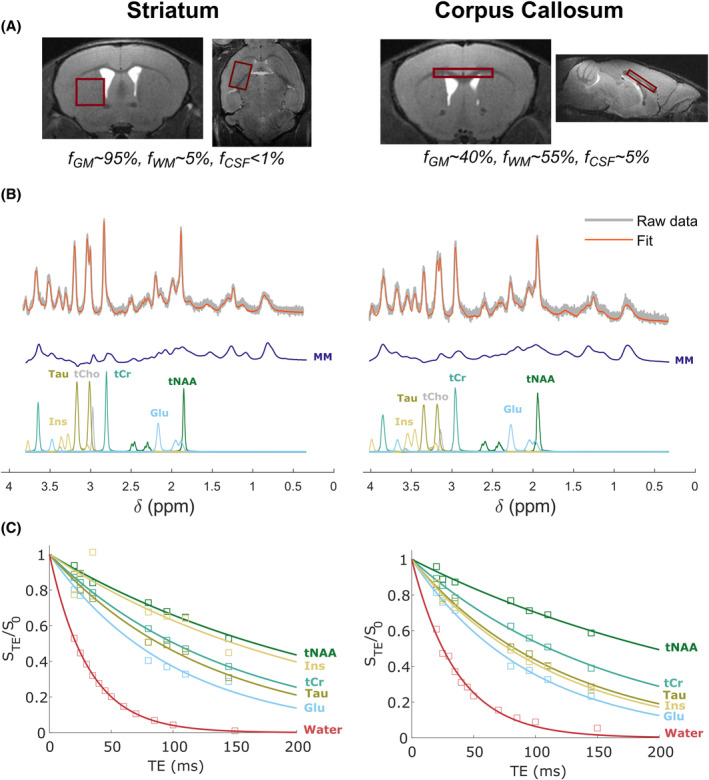
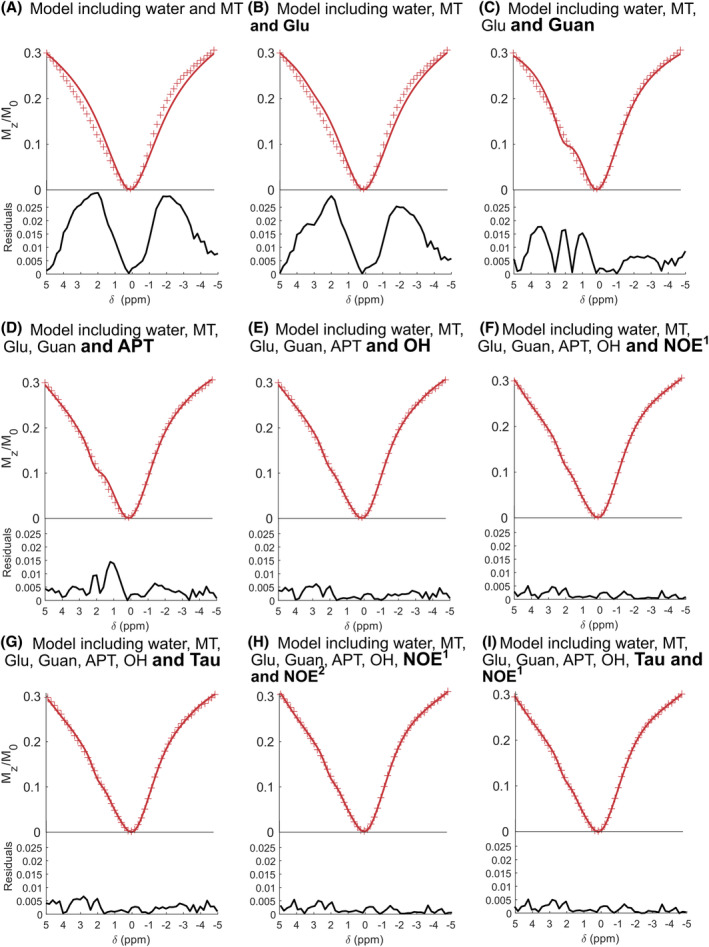
Methods: 1H-MRS was used as a gold standard for glutamate quantification to calibrate a CEST-based quantitative pipeline. Joint localized measurements of Z-spectra at B1 = 5 μT and quantitative 1H-MRS were carried out in two voxels of interest in the mouse brain. A six-pool Bloch-McConnell model was found appropriate to fit experimental data. Glutamate exchange rate was estimated in both regions with this dedicated multi-pool fitting model and using glutamate concentration determined by 1H-MRS.
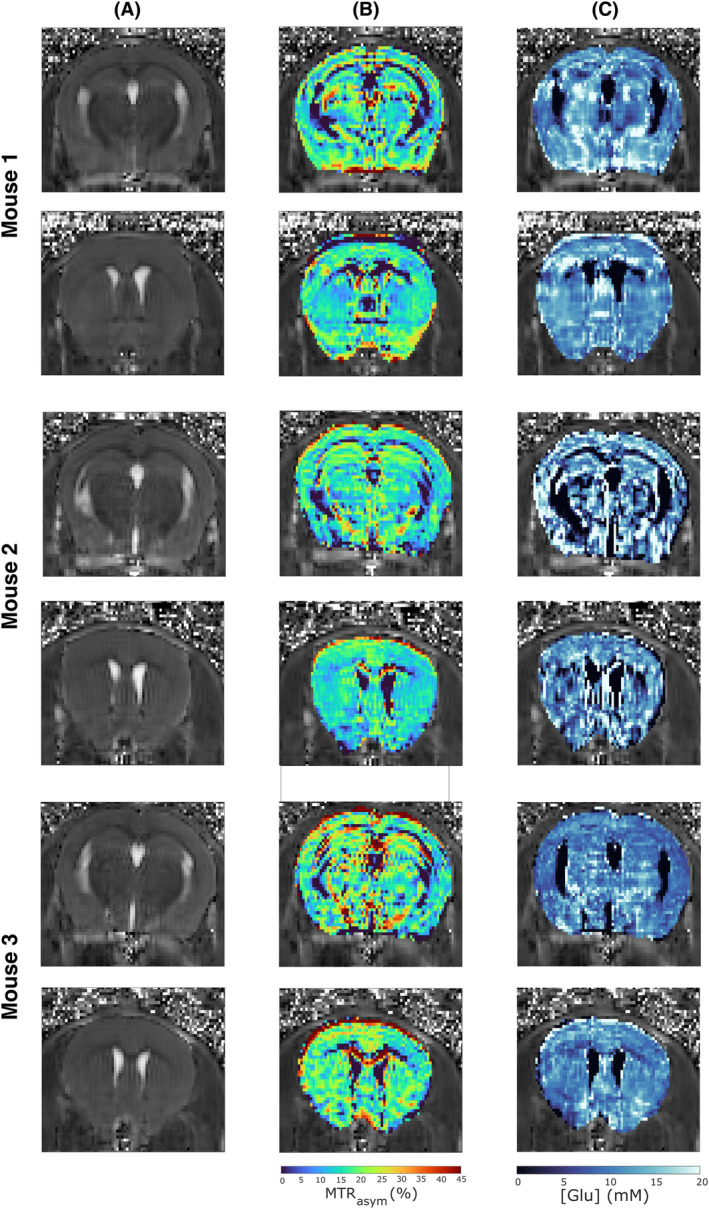
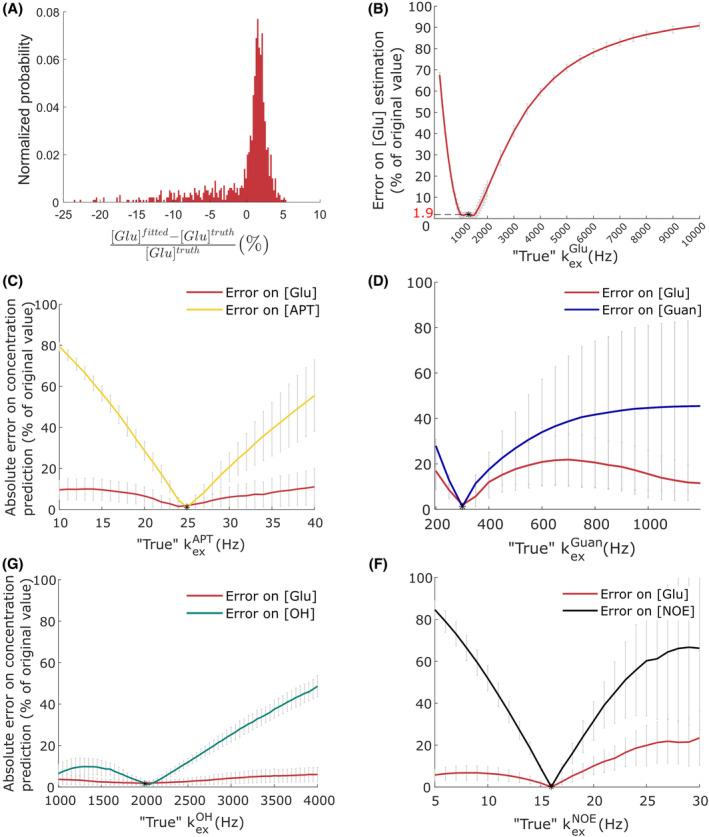
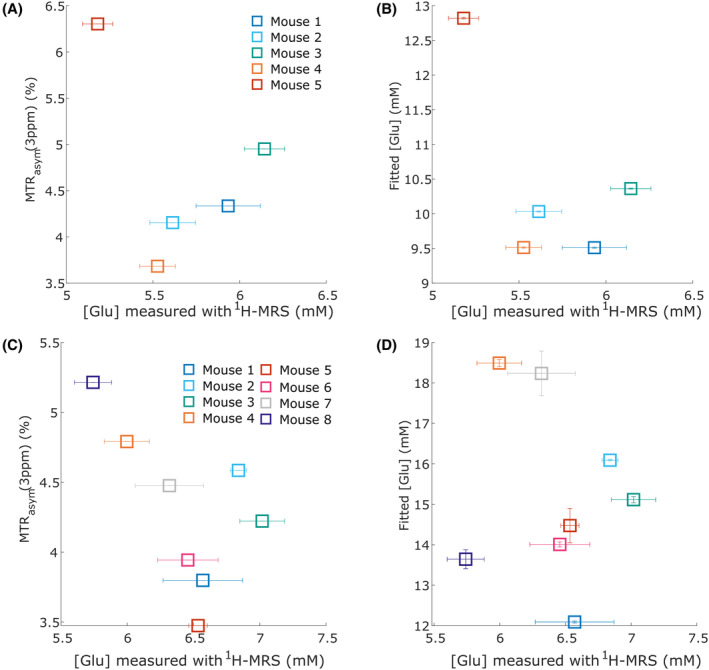
Results: Glutamate exchange rate was estimated to be ˜1300 Hz in the mouse brain. Using this calibrated value, maps of glutamate concentration in the mouse brain were obtained by pixel-by-pixel fitting of Z-spectra at B1 = 5 μT. A complementary study of simulations, however, showed that the quantitative model has high sensitivity to noise, and therefore, requires high-SNR acquisitions. Interestingly, fitted [Glu] seemed to be overestimated compared to 1H-MRS measurements, although it was estimated with simulations that the model has no intrinsic fitting bias with our experimental level of noise. The hypothesis of an unknown proton-exchanging pool contributing to gluCEST signal is discussed.
Conclusion: High-resolution mapping of glutamate in the brain was made possible using the proposed calibrated quantification model of gluCEST data. Further studying of the in vivo molecular contributions to gluCEST signal could improve modeling.
Keywords: 1H‐MRS; Bloch‐McConnell fitting; CEST; glutamate; quantification; quantitative CEST.
© 2024 The Author(s). Magnetic Resonance in Medicine published by Wiley Periodicals LLC on behalf of International Society for Magnetic Resonance in Medicine.
Figures
Similar articles
-
Glutamate-Weighted CEST Contrast After Removal of Magnetization Transfer Effect in Human Brain and Rat Brain with Tumor.Mol Imaging Biol. 2020 Aug;22(4):1087-1101. doi: 10.1007/s11307-019-01465-9. Mol Imaging Biol. 2020. PMID: 31907844
-
Improved method for post-processing correction of B1 inhomogeneity in glutamate-weighted CEST images of the human brain.NMR Biomed. 2021 Jun;34(6):e4503. doi: 10.1002/nbm.4503. Epub 2021 Mar 21. NMR Biomed. 2021. PMID: 33749037
-
Voxel-wise Optimization of Pseudo Voigt Profile (VOPVP) for Z-spectra fitting in chemical exchange saturation transfer (CEST) MRI.Quant Imaging Med Surg. 2019 Oct;9(10):1714-1730. doi: 10.21037/qims.2019.10.01. Quant Imaging Med Surg. 2019. PMID: 31728314 Free PMC article.
-
Glutamate-weighted CEST (gluCEST) imaging for mapping neurometabolism: An update on the state of the art and emerging findings from in vivo applications.NMR Biomed. 2023 Jun;36(6):e4780. doi: 10.1002/nbm.4780. Epub 2022 Jul 4. NMR Biomed. 2023. PMID: 35642353 Review.
-
A review of optimization and quantification techniques for chemical exchange saturation transfer MRI toward sensitive in vivo imaging.Contrast Media Mol Imaging. 2015 May-Jun;10(3):163-178. doi: 10.1002/cmmi.1628. Epub 2015 Jan 12. Contrast Media Mol Imaging. 2015. PMID: 25641791 Free PMC article. Review.
Cited by
-
CEST imaging combined with 1H-MRS reveal the neuroprotective effects of riluzole by improving neurotransmitter imbalances in Alzheimer's disease mice.Alzheimers Res Ther. 2025 Jan 13;17(1):20. doi: 10.1186/s13195-025-01672-3. Alzheimers Res Ther. 2025. PMID: 39806490 Free PMC article.
References
-
- Pépin J, Jego P, Valette J, Bonvento G, Flament J. Imaging of neuronal compartment using gluCEST method. Proceedings of the 25th Annual Meeting of ISMRM; 2017:3741.
MeSH terms
Substances
Grants and funding
LinkOut - more resources
Full Text Sources
Medical
