. 2024 Oct 22;8(4):39.
doi: 10.3390/epigenomes8040039.

Epigenome Mapping in Quiescent Cells Reveals a Key Role for H3K4me3 in Regulation of RNA Polymerase II Activity

Affiliations

Epigenome Mapping in Quiescent Cells Reveals a Key Role for H3K4me3 in Regulation of RNA Polymerase II Activity

Shengyuan Zeng et al. Epigenomes. .

Abstract

(1) Background: Quiescent cells are those that have stopped dividing and show strongly reduced levels of gene expression during dormancy. In response to appropriate signals, the cells can wake up and start growing again. Many histone modifications are regulated in quiescence, but their exact functions remain to be determined. (2) Methods: Here, we map the different histone modifications, H3K4me3, H3K9ac, H3K9me2, and H3K9me3, and the histone variant H2A.Z, comparing vegetative and quiescent fission yeast (S. pombe) cells. We also map histone H3 as a control and RNA polymerase II (phosphorylated at S2 and S5) to enable comparisons of their occupancies within genes. We use ChIP-seq methodology and several different bioinformatics tools. (3) Results: The histone modification mapping data show that H3K4me3 changes stand out as being the most significant. Changes in occupancy of histone variant H2A.Z were also significant, consistent with earlier studies. Regarding gene expression changes in quiescence, we found that changes in mRNA levels were associated with changes in occupancy of RNA polymerase II (S2 and S5). Analysis of quiescence genes showed that increased H3K4me3 levels and RNA polymerase II occupancy were super-significant in a small set of core quiescence genes that are continuously upregulated during dormancy. We demonstrate that several of these genes were require Set1C/COMPASS activity for their strong induction during quiescence. (4) Conclusions: Our results imply that regulation of gene expression in quiescent cells involves epigenome changes with a key role for H3K4me3 in regulation of RNA polymerase II activity, and that different gene activation mechanisms control early and core quiescence genes. Thus, our data give further insights into important epigenome changes in quiescence using fission yeast as an experimental model.

Keywords: G0 arrest; H3K4me3; RNA polymerase II; Set1C/COMPASS; cellular quiescence; fission yeast; histone modifications; regulation of gene expression.


Conflict of interest statement

The authors declare no conflicts of interest.

Figures

Figure 1
Figure 1
Correlation matrix of vegetative (V) cells. Heat map showing pairwise Spearman correlation coefficients for all vegetative ChIP-seq samples calculated based on ranks of each bin.
Figure 2
Figure 2
Correlation matrix of quiescent (Q) cells. Heat map showing pairwise Spearman correlation coefficients for all quiescent ChIP-seq samples calculated based on ranks of each bin.
Figure 3
Figure 3
Volcano plots. Batch effects were removed using DEseq2 (see Section 4). Significantly changed TSS regions in Q cells vs. V cells, are labelled by red, pink, light-blue, and blue colors. Highly significant up: log fold change > 2.0; p < 0.01. Significant up: log fold change > 1.0; p < 0.05; p-value only: log fold change < 1.0 or >−1.0; p value < 0.05. Highly significant down: log fold change < −2.0; p < 0.01. Significant down: log fold change < −1.0; p < 0.05. No difference p > 0.05. Panels (ah) show the different ChIP-seq signals comparing Q cells v.s V cells: (a) RNA Pol II S5; (b) RNA pol II S2; (c) H3K4me3; (d) H2A.Z; (e) H3K9ac; (f) H3K9me2; (g) H3K9me3; (h) H3.
Figure 3
Figure 3
Volcano plots. Batch effects were removed using DEseq2 (see Section 4). Significantly changed TSS regions in Q cells vs. V cells, are labelled by red, pink, light-blue, and blue colors. Highly significant up: log fold change > 2.0; p < 0.01. Significant up: log fold change > 1.0; p < 0.05; p-value only: log fold change < 1.0 or >−1.0; p value < 0.05. Highly significant down: log fold change < −2.0; p < 0.01. Significant down: log fold change < −1.0; p < 0.05. No difference p > 0.05. Panels (ah) show the different ChIP-seq signals comparing Q cells v.s V cells: (a) RNA Pol II S5; (b) RNA pol II S2; (c) H3K4me3; (d) H2A.Z; (e) H3K9ac; (f) H3K9me2; (g) H3K9me3; (h) H3.
Figure 4
Figure 4
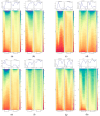
TSS to TES region heatmaps. Sequencing depth and input normalized ChIP-seq signals (read counts). The color gradient from blue to red indicates high to low signals in the different regions. The plot above each heatmap displays the average signal in the different regions. The panels show the ChIP-seq signals in V cells and Q cells as indicated (a) RNA Pol II S5; (b) RNA pol II S2; (c) H3K4me3; (d) H3K9ac; (e) H2A.Z; (f) H3K9me2; (g) H3K9me3; (h) H3.
Figure 5
Figure 5
Differential TSS-to-TES profile plots. Sequencing depth and input normalized. Plot profiles for upregulated (yellow area), downregulated (brown area), and non-changed genes (blue area) in Q vs. V cells for the different ChIP-seq signals (read counts) as indicated. ‘Up’ = upregulated in Q cells; ‘Non’ = non-changed in Q cells; ‘Down’ = downregulated in Q cells. The panels show the average ChIP-seq signals in V cells and Q cells as indicated (a) RNA Pol II S5; (b) RNA pol II S2; (c) H3K4me3; (d) H3K9ac; (e) H3K9me2; (f) H3K9me3; (g) H2A.Z; (h) H3.
Figure 6
Figure 6
Venn diagram. Chromatin state changes comparing RNA Pol II S5 and H3K4me3 (ChIP-seq signals) vs. gene expression changes (RNA-seq). Panel (a) shows the number of upregulated (induced) genes in Q cells that change to an active chromatin state and panel (b) shows the number of downregulated genes in Q cells that change to a repressed chromatin state.
Figure 7
Figure 7
Integrative Genomics Viewer (IGV) displays showing examples of genes changing their chromatin state in Q cells. The first panel shows the rpl27+ gene region in V cells (a) and Q cells (b). The second panel shows the hhf1+ and hht1+ gene region in V cells (c) and Q cells (d). The third panel shows the gdp3+ gene region in V cells (e) and Q cells (f). The fourth panel shows the SPBPB21E7 region containing three genes in V cells (g) and Q cells (h). ChIP-seq signals for RNA Pol II S2, RNA Pol II S5, H3K4me3, H3K9ac, H3K9me2, H3K9me3, H2A-Z, and H3 are indicated in each panel.
Figure 7
Figure 7
Integrative Genomics Viewer (IGV) displays showing examples of genes changing their chromatin state in Q cells. The first panel shows the rpl27+ gene region in V cells (a) and Q cells (b). The second panel shows the hhf1+ and hht1+ gene region in V cells (c) and Q cells (d). The third panel shows the gdp3+ gene region in V cells (e) and Q cells (f). The fourth panel shows the SPBPB21E7 region containing three genes in V cells (g) and Q cells (h). ChIP-seq signals for RNA Pol II S2, RNA Pol II S5, H3K4me3, H3K9ac, H3K9me2, H3K9me3, H2A-Z, and H3 are indicated in each panel.
Figure 8
Figure 8
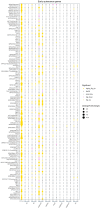
The majority of core quiescence genes show a significant increase in H3K4me3 and RNA polymerase S5. A bubble plot of core quiescence genes generated by Deseq2 tool is shown. RNA_seq = gene expression levels measured by RNA-seq; S2 = RNA polymerase II S2; S5 = RNA polymerase S5; and histone marks, as indicated in TSS and ORF regions, respectively. The gene names are indicated in the left margin.
Figure 9
Figure 9
A small subset of early quiescence genes shows a significant increase of RNA polymerase II S5 and H3K4me3. A bubble plot of core quiescence genes generated by Deseq2 tool is shown. RNA_seq = gene expression levels measured by RNA-seq; S2 = RNA polymerase II S2; S5 = RNA polymerase S5; and histone marks, as indicated in TSS and ORF regions, respectively. The gene names are indicated in the left margin.
Figure 10
Figure 10
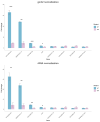
Real-time quantitative PCR (RT-QPCR) analysis of gene expression for core quiescence genes in Q cells vs. V cells. The 2−ΔΔCT method for relative quantitation was used (see Materials and Methods). Statistical significance for reduced expression in set1Δ vs. WT is indicated (paired T-test): p < 0.001 “***”; p < 0.01 “**”; p < 0.05 “*”. Panels: (top) gmh2+ normalized data; (bottom) rRNA normalized data.

Similar articles

References

    1. de Morree A., Rando T.A. Regulation of adult stem cell quiescence and its functions in the maintenance of tissue integrity. Nat. Rev. Mol. Cell Biol. 2023;24:334–354. - PMC - PubMed
    1. Roche B., Arcangioli B., Martienssen R. Transcriptional reprogramming in cellular quiescence. RNA Biol. 2017;14:843–853. doi: 10.1080/15476286.2017.1327510. - DOI - PMC - PubMed
    1. Li Y., Wang Z., Ajani J.A., Song S. Drug resistance and Cancer stem cells. Cell Commun. Signal. 2021;19:19. doi: 10.1186/s12964-020-00627-5. - DOI - PMC - PubMed
    1. Hayles J., Nurse P. Introduction to Fission Yeast as a Model System. Cold Spring Harb. Protoc. 2018;2018:pdb-top079749. doi: 10.1101/pdb.top079749. - DOI - PubMed
    1. Sajiki K., Hatanaka M., Nakamura T., Takeda K., Shimanuki M., Yoshida T., Hanyu Y., Hayashi T., Nakaseko Y., Yanagida M. Genetic control of cellular quiescence in S. pombe. Pt 9J. Cell Sci. 2009;122:1418–1429. doi: 10.1242/jcs.046466. - DOI - PubMed

LinkOut - more resources