. 2024 Jul 2:2:1-20.
doi: 10.1162/imag_a_00217. eCollection 2024 Jul 1.

Optimization and validation of multi-echo, multi-contrast SAGE acquisition in fMRI

Affiliations

Optimization and validation of multi-echo, multi-contrast SAGE acquisition in fMRI

Elizabeth G Keeling et al. Imaging Neurosci (Camb). .

Abstract

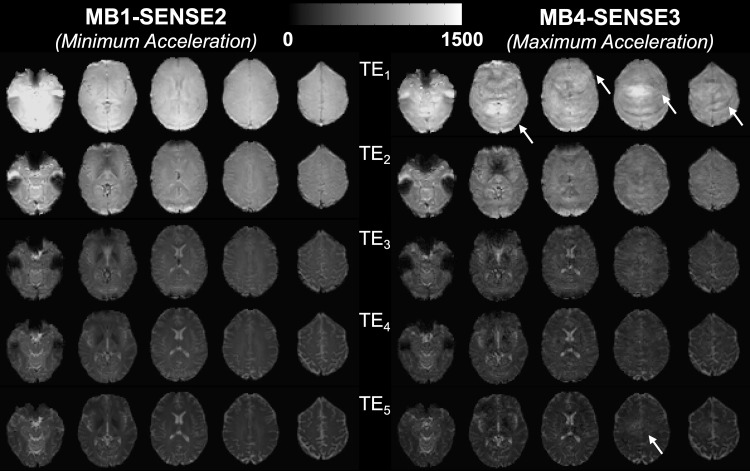
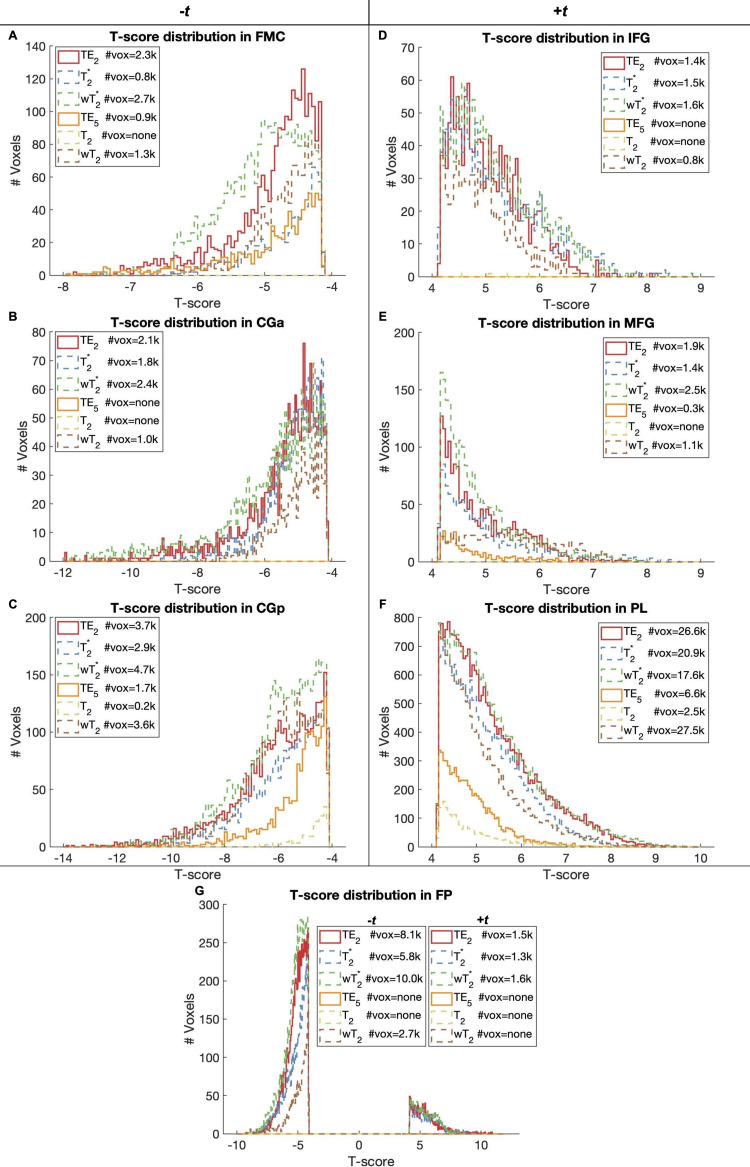
The purpose of this study was to optimize and validate a multi-contrast, multi-echo fMRI method using a combined spin- and gradient-echo (SAGE) acquisition. It was hypothesized that SAGE-based blood oxygen level-dependent (BOLD) functional MRI (fMRI) will improve sensitivity and spatial specificity while reducing signal dropout. SAGE-fMRI data were acquired with five echoes (2 gradient-echoes, 2 asymmetric spin-echoes, and 1 spin-echo) across 12 protocols with varying acceleration factors, and temporal SNR (tSNR) was assessed. The optimized protocol was then implemented in working memory and vision tasks in 15 healthy subjects. Task-based analysis was performed using individual echoes, quantitative dynamic relaxation times T2 * and T2, and echo time-dependent weighted combinations of dynamic signals. These methods were compared to determine the optimal analysis method for SAGE-fMRI. Implementation of a multiband factor of 2 and sensitivity encoding (SENSE) factor of 2.5 yielded adequate spatiotemporal resolution while minimizing artifacts and loss in tSNR. Higher BOLD contrast-to-noise ratio (CNR) and tSNR were observed for SAGE-fMRI relative to single-echo fMRI, especially in regions with large susceptibility effects and for T2-dominant analyses. Using a working memory task, the extent of activation was highest with T2 *-weighting, while smaller clusters were observed with quantitative T2 * and T2. SAGE-fMRI couples the high BOLD sensitivity from multi-gradient-echo acquisitions with improved spatial localization from spin-echo acquisitions, providing two contrasts for analysis. SAGE-fMRI provides substantial advantages, including improving CNR and tSNR for more accurate analysis.

Keywords: BOLD contrast; BOLD contrast-to-noise ratio (CNR); functional MRI (fMRI); multi-echo fMRI; spin-echo fMRI.


Conflict of interest statement

Dr. Stokes has received speaking fees from Eli Lilly.

Figures

Fig. 1.
Fig. 1.
Single-subject acquisition for each TE across acceleration factor combinations. T1-weighted (T1-w) sagittal image is included with each maximum brain coverage achievable per protocol listed in the legend.
Fig. 2.
Fig. 2.
Representative SAGE images for minimum and maximum acceleration protocols per TE. Arrows highlight visible acceleration-related artifacts, apparent in TE1as bands and in TE5as loss of definition and blurring.
Fig. 3.
Fig. 3.
Group-level mean tSNR across acceleration factor combinations for TE1-5in gray (A) and white matter (B). There were no significant differences in tSNR in gray or white matter across TEs between protocols with feasible acquisition parameters (i.e., full brain coverage ≥120 mm, TE1< 10 ms, TE5< 100 ms).
Fig. 4.
Fig. 4.
TE2per acquisition and corresponding g-factor analysis in a representative subject. Increasing g-factor values may correspond to acceleration-associated artifacts seen in TE2. Histograms exhibiting the distribution of whole-brain voxelwise g-factor values are provided.
Fig. 5.
Fig. 5.
Group-level tSNR maps for the working memory task across macro- (TE2, SAGE T2*, and SAGEwT2*) and microvascular (TE5, SAGE T2, and SAGEwT2) acquisitions. Anatomical T1-w image is included for reference.
Fig. 6.
Fig. 6.
Group-level CNR maps for the working memory task across macro- (TE2, SAGE T2*, and SAGEwT2*) and microvascular (TE5, SAGE T2, and SAGEwT2) acquisitions. Anatomical T1-w image with task-related regions of interest (ROIs) is included for reference.
Fig. 7.
Fig. 7.
Group-levelt-maps for the working memory task across macro- (TE2, SAGE T2*, and SAGEwT2*) and microvascular (TE5, SAGE T2, and SAGEwT2) acquisitions. # vox = voxel count for significant functional activation.
Fig. 8.
Fig. 8.
N-back task-based activation histograms for ROIs with negative (A-C; G) and positive (D-G) activation. Each histogram shows the distribution of statistically significant voxels (p < 0.001, cluster size corrected) for each single-echo or SAGE-based method, with the significant voxel count in the legend. FP had both positive (dorsolateral prefrontal cortex) and negative (dorsomedial prefrontal cortex) activation. Voxel clusters of less than 100 were removed for visualization. FMC = Frontal Medial Cortex; CGa = Cingulate Gyrus anterior division; CGp = Cingulate Gyrus posterior division; IFG = Inferior Frontal Gyrus; MFG = Middle Frontal Gyrus; PL = Parietal Lobe; FP = Frontal Pole.
Fig. 9.
Fig. 9.
Task-based activation (corrected for multiple comparisons, FDRq< 0.05) in a representative subject for all SAGE macro- (TE2, SAGE T2*, and SAGEwT2*) and microvascular (TE5, SAGE T2, and SAGEwT2) analyses. The VENAT probabilistic atlas, co-registered into native space, is provided for reference corresponding to large draining veins in the brain. VENAT and activation maps are overlaid on T1-w anatomical image co-registered into native space. Macrovascular-weighted activations overlap with the straight, transverse, and sagittal sinuses, whereas microvascular-weighted activations appear to be largely constrained to gray matter of the visual cortex. P(VENAT) = VENAT atlas probability estimate.

Similar articles

Cited by

References

    1. Barch , D. M. , Burgess , G. C. , Harms , M. P. , Petersen , S. E. , Schlaggar , B. L. , Corbetta , M. , Glasser , M. F. , Curtiss , S. , Dixit , S. , Feldt , C. , Nolan , D. , Bryant , E. , Hartley , T. , Footer , O. , Bjork , J. M. , Poldrack , R. , Smith , S. , Johansen-Berg , H. , Snyder , A. Z. , & Van Essen , D. C. ( 2013. ). Function in the human connectome: Task-fMRI and individual differences in behavior . NeuroImage , 80 , 169 – 189 . 10.1016/J.NEUROIMAGE.2013.05.033 - DOI - PMC - PubMed
    1. Bell , L. C. , Does , M. D. , Stokes , A. M. , Baxter , L. C. , Schmainda , K. M. , Dueck , A. C. , & Quarles , C. C . ( 2017. ). Optimization of DSC MRI echo times for CBV measurements using error analysis in a pilot study of high-grade gliomas . AJNR American Journal of Neuroradiology , 38 ( 9 ), 1710 – 1715 . 10.3174/ajnr.A5295 - DOI - PMC - PubMed
    1. Binney , R. J. , Embleton , K. V. , Jefferies , E. , Parker , G. J. M. , & Ralph Lambon , A. M. ( 2010. ). The ventral and inferolateral aspects of the anterior temporal lobe are crucial in semantic memory: Evidence from a novel direct comparison of distortion-corrected fMRI, rTMS, and semantic dementia . Cerebral Cortex , 20 ( 11 ), 2728 – 2738 . 10.1093/cercor/bhq019 - DOI - PubMed
    1. Birn , R. M. , Diamond , J. B. , Smith , M. A. , & Bandettini , P. A . ( 2006. ). Separating respiratory-variation-related fluctuations from neuronal-activity-related fluctuations in fMRI . NeuroImage , 31 ( 4 ), 1536 – 1548 . 10.1016/j.neuroimage.2006.02.048 - DOI - PubMed
    1. Boxerman , J. L. , Hamberg , L. M. , Rosen , B. R. , & Weisskoff , R. M. ( 1995. ). MR contrast due to intravascular magnetic susceptibility perturbations . Magnetic Resonance in Medicine , 34 ( 4 ), 555 – 566 . 10.1002/MRM.1910340412 - DOI - PubMed

LinkOut - more resources