. 2024 Oct 16;32(11):1709-1721.
doi: 10.32604/or.2024.053972. eCollection 2024.

Piperlongumine in combination with EGFR tyrosine kinase inhibitors for the treatment of lung cancer cells

Affiliations

Piperlongumine in combination with EGFR tyrosine kinase inhibitors for the treatment of lung cancer cells

Shail Rakesh Modi et al. Oncol Res. .

Abstract

Objectives: EGFR tyrosine kinase inhibitor (EGFR-TKI) therapies such as erlotinib and gefitinib are approved for the treatment of non-small cell lung cancer (NSCLC). However, the high incidence of acquired resistance to these EGFR-TKIs may preclude their effectiveness. Piperlongumine (PPL), an extract from the long pepper fruit (Piper longum), has been shown to possess anticancer properties. The purpose of the study was to investigate piperlongumine as an anticancer agent and to study a combination treatment approach with EGFR-TKIs against lung cancer cells.

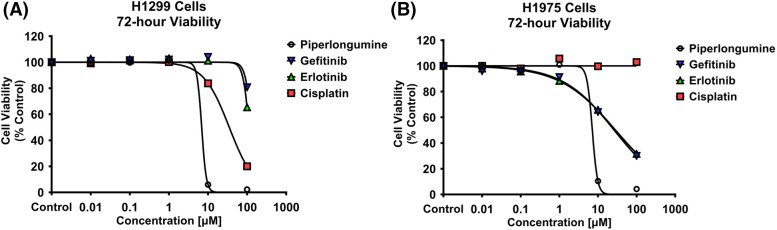
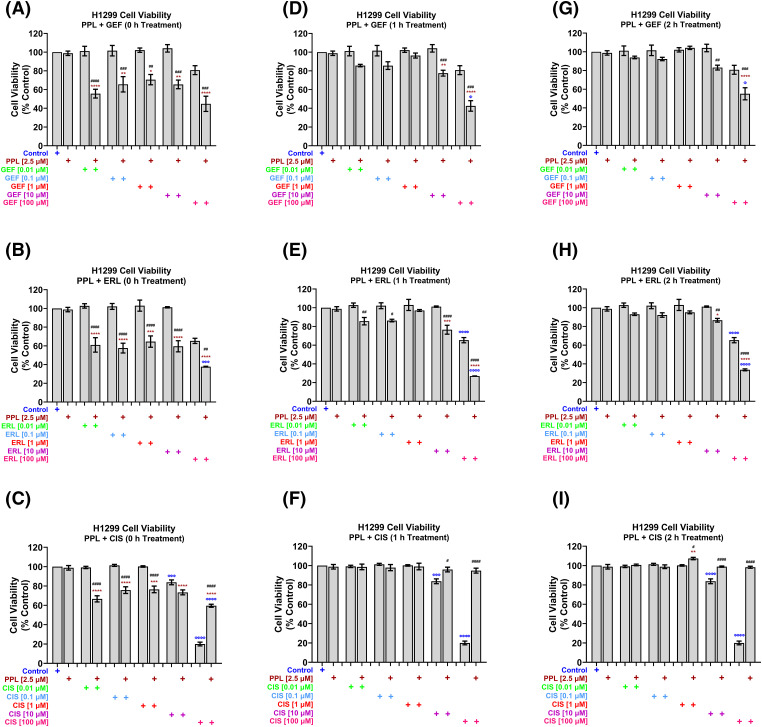
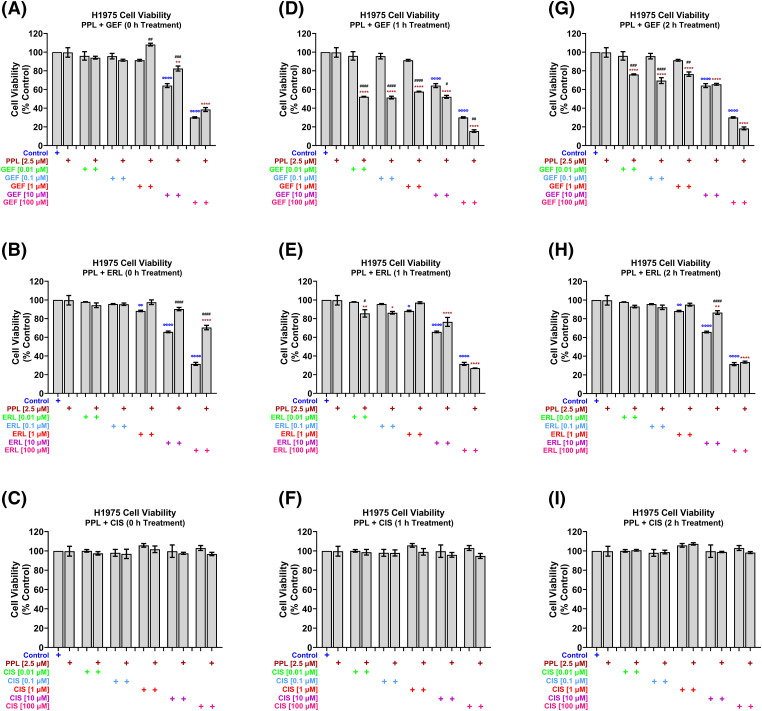
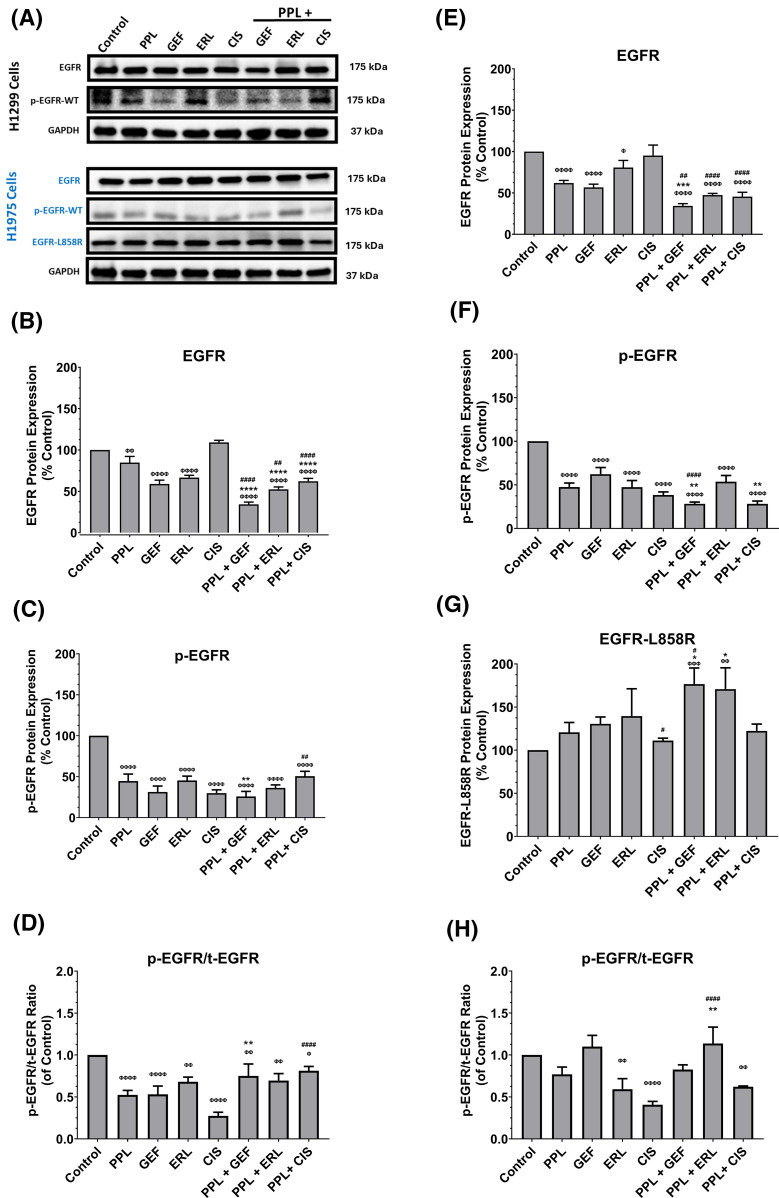
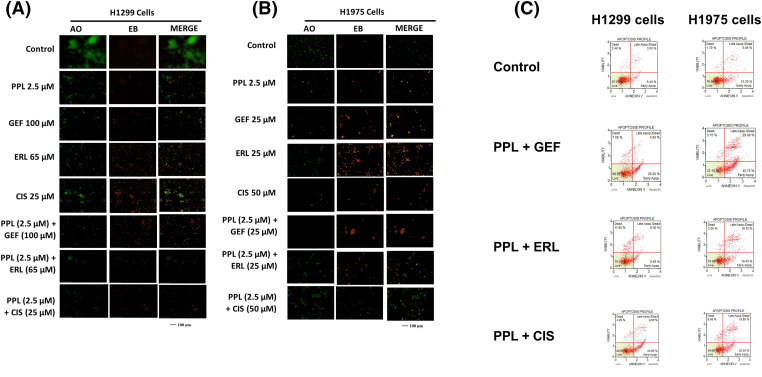
Methods: Anticancer efficacy of PPL, erlotinib (ERL), gefitinib (GEF), and cisplatin (CIS) were investigated in H1299 and H1975 cell lines. Cells were treated with PPL, ERL, GEF, and CIS alone, and in combination, cell viability was determined after 72 h. The mechanism of PPL-induced cytotoxicity was investigated via reactive oxygen species (ROS) induction, and apoptosis induction using acridine orange/ethidium bromide staining and flow cytometry. The effect of treatment on EGFR-mediated oncogenic signaling was investigated by immunoblotting for mitogenic and apoptotic markers.

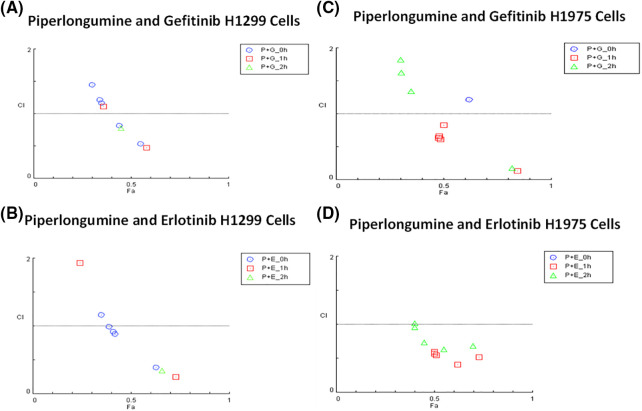
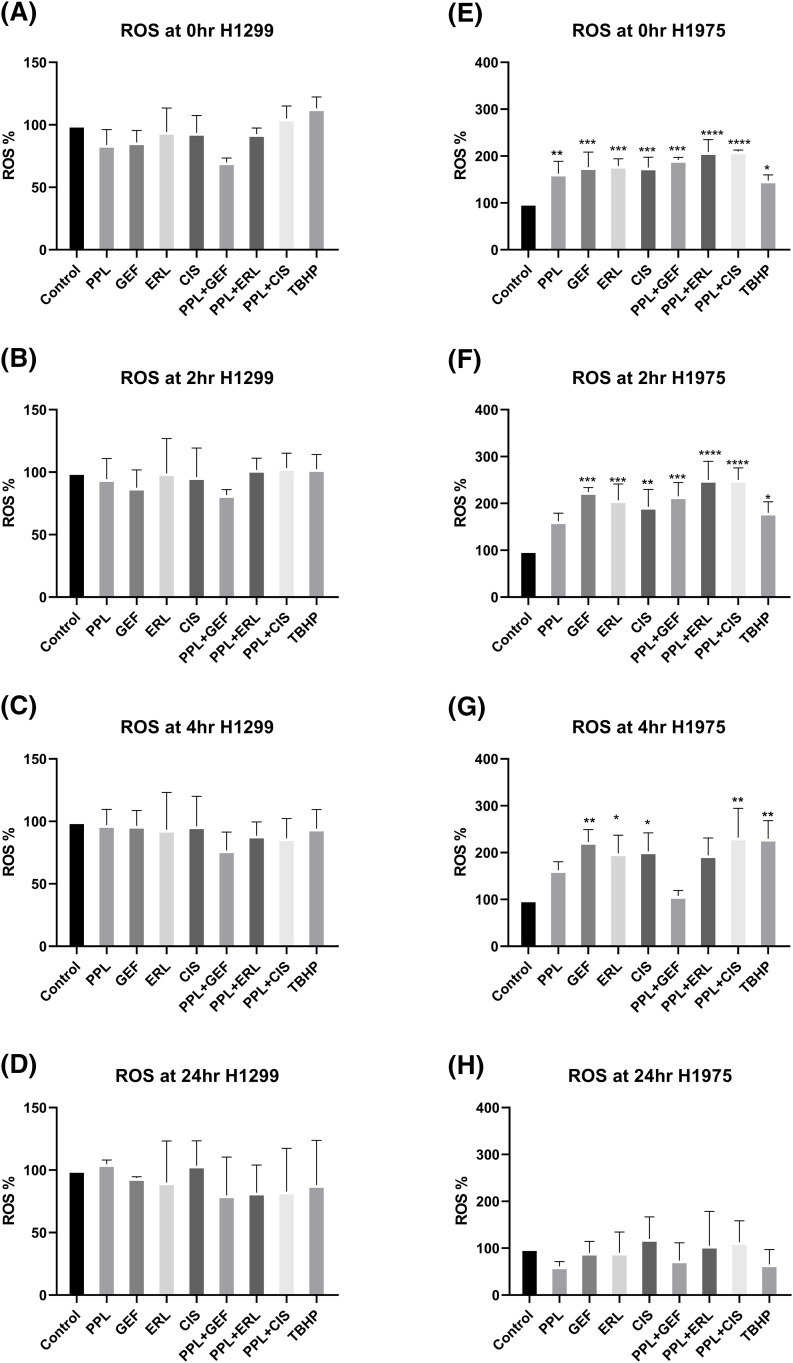
Results: PPL exhibited a potent cytotoxic effect in H1299 and H1975 cells compared to ERL, GEF, and CIS. Combination treatments of PPL with GEF and ERL showed significant reductions in cancer cells compared to control in both cell lines, which were associated with apoptotic induction, but without significant ROS induction. Compared to control, PPL with GEF significantly increased apoptotic cell death in H1975as confirmed with flow cytometry. Treatment with PPL alone and in combination induced anti-mitogenic and apoptotic responses at the molecular level.

Conclusion: PPL sensitized lung cancer cells to EGFR-TKI and induced potent cytotoxic effects at low concentrations.

Keywords: Mutation; Non-small cell lung cancer (NSCLC); Piperlongumine (PPL); Resistance; Tyrosine kinase inhibitors (TKI).


Conflict of interest statement

The authors declare that they have no conflicts of interest to report regarding the present study. The authors also declare that the article is an original research work that has not been submitted anywhere else.

Figures

Figure 1
Figure 1. Alamar blue cell viability assay was performed in (A) H1299 and (B) H1975 for 72 h following individual treatments with PPL, GEF, ERL, and CIS at 0.01, 0.1, 1, 10, and 100 μM. Dimethyl sulfoxide (DMSO) was used as a control. Treatment with PPL resulted in a decrease in cell viability with an increase in concentration in both cell lines demonstrating a potential anticancer agent.
Figure 2
Figure 2. H1299 cell viability using alamar blue assay following combination treatments of PPL (2.5 µM) with varying concentrations of (A, D, G) GEF, (B, E, H) ERL, and (C, F, I) CIS. Combination treatment scheduling was either concurrent/immediate (0 h) or sequential/delayed (1 and 2 h). DMSO was used as a control. The concurrent treatment of EGFR-TKIs and PPL has significantly decreased cell viability at lower concentrations of EGFR-TKIs while the delayed treatment has decreased cell viability only at higher concentrations of EGFR-TKIs in the wild-type cells. The combination of PPL and CIS has decreased cell viability, however, the monotherapy of cisplatin has a better effect compared to the combination. Statistical analysis: One-way ANOVA with Sidak’s post-test. Compared to the control group: Φp < 0.05, ΦΦΦp < 0.001, and ΦΦΦΦp < 0.0001. Compared with the PPL (2.5 μM): *p < 0.05, **p < 0.01, ***p < 0.001, and ****p < 0.0001. Compared to the corresponding single treatment group of GEF, ERL, or CIS: #p < 0.05, ##p < 0.01, ###p < 0.001 and ####p < 0.0001.
Figure 3
Figure 3. H1975 cell viability alamar blue assay following combination treatment of PPL (2.5 µM) with varying concentrations of (A, D, G) GEF, (B, E, H) ERL, and (C, F, I) CIS. Combination treatment scheduling was either concurrent/immediate (0 h) or sequential/delayed (1 and 2 h). DMSO was used as a control. The monotherapy of EGFR-TKIs had a significant decrease in cell viability compared to the concurrent combination of EGFR-TKIs and PPL. Delaying the addition of the EGFR-TKIs resulted in a significant decrease in cell viability in the mutant lung cancer cells. The combination of PPL and CIS had no significant changes in the cell viability against H1975 cells. Statistical analysis: One-way ANOVA with Sidak’s post-test. Compared to the control group: Φp < 0.05, ΦΦp < 0.01, ΦΦΦΦp < 0.0001. Compared with the PPL (2.5 μM): *p < 0.05, **p < 0.01, and ****p < 0.0001. Compared to the corresponding single treatment group of GEF, ERL, or CIS: #p < 0.05, ##p < 0.01, ###p < 0.001 and ####p < 0.0001.
Figure 4
Figure 4. (A) Representative western blots of EGFR, p-EGFR, and EGFR-L858R (mutant) proteins in H1299 and H1975 cells following treatments with single and combination regimens of PPL, GEF, ERL, and CIS; DMSO was used as control. GAPDH was used as a loading control. (B–D) Graphs showing the relative expression of EGFR, p-EGFR, and p-EGFR/t-EGFR proteins in H1299 cells. (E–H) Graphs showing the relative expression of EGFR, p-EGFR, and EGFR-L858R in H1975 cells. Statistical analysis: One-way ANOVA with Sidak’s post-test. Compared to the control group: Φp < 0.05, ΦΦp < 0.01, ΦΦΦp < 0.001, and ΦΦΦΦp < 0.0001. Compared with the PPL (2.5 μM): *p < 0.05, **p < 0.01, ***p < 0.001, and ****p < 0.0001. Compared to the corresponding single treatment group of GEF, ERL, or CIS: #p < 0.05, ##p < 0.01, ####p < 0.0001.
Figure 5
Figure 5. Combination index plots characterizing the interactions occurring with combination treatment of PPL with GEF, or ERL in (A and B) H1299 and (C and D) H1975 via CompuSyn. Combination Index, CI (y-axis) values over 1-antagonistic effect, CI less than 1–synergistic effect, and CI equal to 1–additive effect. Fraction associated, Fa (x-axis) represents the effect of the drug. Each panel shows the effect of combination treatment schedules based on either concurrent/immediate (0 h) or sequential/delayed (1; 2 h) administration with PPL and GEF (P+G_0 h; P+G_1 h; P+G_2 h, respectively), or PPL and ERL (P+E_0 h; P+E_1 h; P+E_2 h, respectively).
Figure 6
Figure 6. Results of ROS assay in (A–D) H1299 and (E–H) H1975 cells at 0, 2, 4, and 24 h following concurrent/immediate (0 h) single and combination treatments with PPL (2.5 μM), GEF (100 and 25 μM), ERL (65 and 25 μM), and CIS (25 and 50 μM) in H1299 cells and H1975 cells, respectively; DMSO and TBHP (100 μM) were used as untreated and positive control, respectively. One-way ANOVA with Dunnet’s post-test. Compared to the control group: *p < 0.05, **p < 0.01, ***p < 0.001 and ****p < 0.0001.
Figure 7
Figure 7. Fluorescence micrographs showing results of Acridine orange/Ethidium Bromide (AO/EB) staining following individual treatments with Control (DMSO), PPL, GEF, ERL, and CIS and their combination in (A) H1299 cells and (B) H1975 cells. The green color denotes live cells, and the orange-to-red color indicates different stages of apoptosis from early to late apoptosis. (C) Representative flow cytometry scatter plots showing the distribution of live, early apoptotic, late apoptotic, and dead cells in H1299 cells (left panel) and H1975 cells (right panel) following treatment with Control (DMSO), PPL + GEF, PPL + ERL, and PPL + CIS. For H1299 cells the concentrations used were PPL (2.5 µM), GEF (100 µM), ERL (65 µM), CIS (25 µM), PPL + GEF (2.5 + 100 µM), PPL + ERL (2.5 + 65 µM), and PPL + CIS (2.5 + 25 µM). For H1975 cells the concentrations used were PPL (2.5 µM), GEF (25 µM), ERL (25 µM), CIS (50 µM), PPL + GEF (2.5 + 25 µM), PPL + ERL (2.5 + 25 µM), and PPL + CIS (2.5 + 50 µM).

Similar articles

Cited by

References

    1. Siegel, R. L., Giaquinto, A. N., Jemal, A. (2024). Cancer statistics. CA: A Cancer Journal for Clinicians , 74(1), 12–49. 10.3322/caac.21820; - DOI - PubMed
    1. Thai, A. A., Solomon, B. J., Sequist, L. V., Gainor, J. F., Heist, R. S. (2021). Lung cancer. The Lancet , 398(10299), 535–554. 10.1016/s0140-6736(21)00312-3; - DOI - PubMed
    1. Choo, J. R. E., Tan, C. S., Soo, R. A. (2018). Treatment of EGFR T790M-positive non-small cell lung cancer. Targeted Oncology , 13(2), 141–156. 10.1007/s11523-018-0554-5; - DOI - PubMed
    1. Suda, K., Onozato, R., Yatabe, Y., Mitsudomi, T. (2009). EGFR T790M mutation: A double role in lung cancer cell survival? Journal of Thoracic Oncology , 4(1), 1–4. 10.1097/jto.0b013e3181913c9f; - DOI - PubMed
    1. Liang, H., Pan, Z., Wang, W., Guo, C., Chen, D.et al. (2018). The alteration of T790M between 19 del and L858R in NSCLC in the course of EGFR-TKIs therapy: A literature-based pooled analysis. Journal of Thoracic Disease , 10(4), 2311–2320. 10.21037/jtd.2018.03.150; - DOI - PMC - PubMed

MeSH terms