. 2024;143(5):1349-1364.
doi: 10.1007/s10342-024-01694-w. Epub 2024 May 13.

Population-specific climate sensitive top height curves and their applications to assisted migration

Affiliations

Population-specific climate sensitive top height curves and their applications to assisted migration

Dawei Luo et al. Eur J For Res. 2024.

Abstract

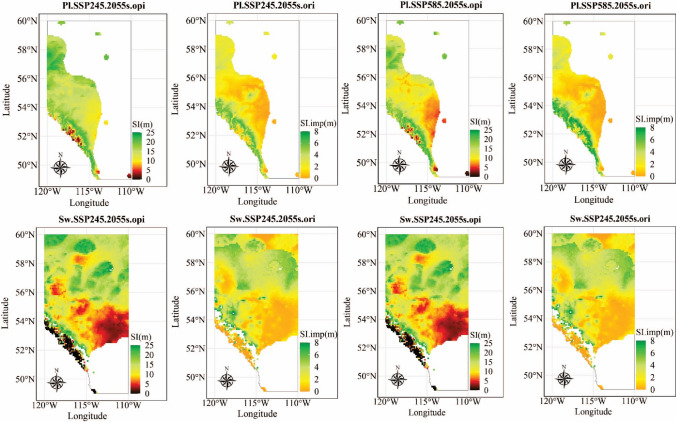
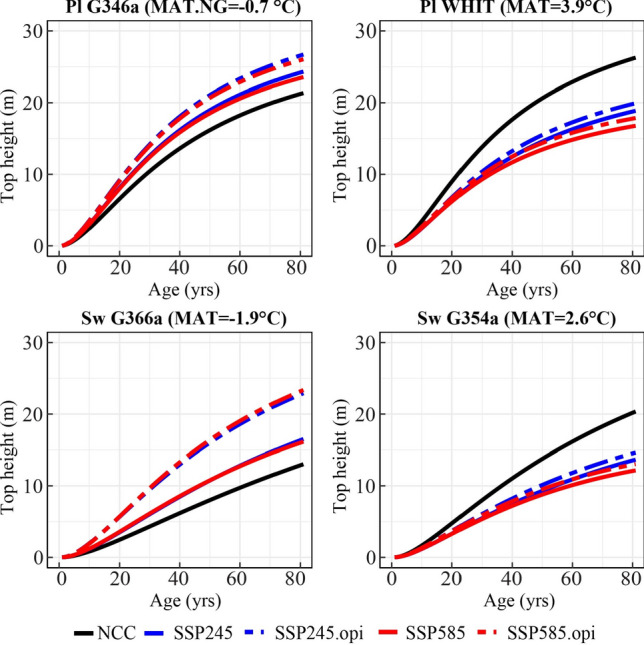
Growth and yield (G&Y) of forest plantations can be significantly impacted by maladaptation resulting from climate change, and assisted migration has been proposed to mitigate these impacts by restoring populations to their historic climates. However, genecology models currently used for guiding assisted migration do not account for impacts of climate change on cumulative growth and assume that responses of forest population to climate do not change with age. Using provenance trial data for interior lodgepole pine (Pinus contorta subsp. latifolia Douglas) and white spruce (Picea glauca (Moench) Voss) in western Canada, we integrated Universal Response Functions, representing the relationship of population performance with their provenance and site climates, into top height curves in a G&Y model (Growth and Yield Projection System, GYPSY) to develop population-specific climate sensitive top height curves for both species. These new models can estimate the impact of climate change on top height of local populations and populations from a range of provenances to help guide assisted migration. Our findings reveal that climate change is expected to have varying effects on forest productivity across the landscape, with some areas projected to experience a slight increase in productivity by the 2050s, while the remainder are projected to face a significant decline in productivity for both species. Adoption of assisted migration, however, with the optimal populations selected was projected to maintain and even improve productivity at the provincial scale. The findings of this study provide a novel approach to incorporating assisted migration approaches into forest management to mitigate the negative impacts of climate change.

Keywords: Assisted migration; Climate change; Lodgepole pine; Top height; Universal Response Function; White spruce.


Conflict of interest statement

Conflict of interestThe authors declare that they have no known competing financial interests or personal relationships that could have appeared to influence the work reported in this paper.

Figures

Fig. 1
Fig. 1
Locations of the test site (Site) and provenance (Prov) of the populations of lodgepole pine (Pl) and white spruce (Sw) trials used in this study. Mean annual temperature (MAT) and mean annual precipitation (MAP) of provenances and test sites across North America
Fig. 2
Fig. 2
Flow chart for building a population-specific climate sensitive top height curve (a); population-specific climate sensitive and climate non-sensitive top height curves in the case of top height increasing with site mean annual temperature (b); and top height decreasing with site mean annual temperature (c); under climate change scenarios; URF is Universal Response Function; GYPSY is Growth and Yield Projection System; MAT.s is site mean annual temperature at age i
Fig. 3
Fig. 3
Results from the tenfold cross validation for the selected Universal Response Function (URF) for height estimated at age-32 for lodgepole pine (a); and height estimated at age-16 for white spruce (b); results from the tenfold cross validation for the selected population-specific climate sensitive top height curves for Pl (c); and Sw (d); RMSEP is residual means square error of prediction; EF is prediction efficiency
Fig. 4
Fig. 4
Site index (SI, age 50) and site index difference (SI.dif) for the local populations of lodgepole pine (Pl) and white spruce (Sw) under no climate change (NCC), Shared Socioeconomic Pathways (SSP)245 and SSP585 in 2055s (averaged from 2041–2070) within each species’ current natural distribution in Alberta
Fig. 5
Fig. 5
Site index (SI, age 50) and site index improvement compared to local populations (SI.imp) for the optimal populations (.opi) of lodgepole pine (Pl) and white spruce (Sw) under Shared Socioeconomic Pathways (SSP)245 and SSP585 in 2055s (averaged from 2041–2070) within species natural range in Alberta
Fig. 6
Fig. 6
Case study of population-specific climate sensitive top height curves for lodgepole pine (Pl) growing at site G346a, site WHIT, and white spruce (Sw) at site G366a, G354a under no climate change (NCC), Shared Socioeconomical Pathway (SSP) 245 and SSP 585; optimal population (.opi) is selected based on grid scanning (100 random points) that cover the natural range within Alberta
Fig. 7
Fig. 7
Mean annual temperature (MAT), log mean annual precipitation (MAP) and their change (dif) in Alberta under no climate change (NCC) and under Shared Socioeconomic Pathway (SSP) 245 in the 2055s (averaged over 2041–2070)

Similar articles

References

    1. AAF (Alberta Agriculture and Forestry). 2016. Alberta forest genetic resource management and conservation standards. Alberta Agriculture and Forestry, Government of Alberta, Edmonton, Alberta.
    1. Aitken SN, Yeaman S, Holliday JA, Wang T, Curtis-McLane S (2008) Adaptation, migration or extirpation: climate change outcomes for tree populations. Evol Appl 1:95–111 - PMC - PubMed
    1. Eyring V, Bony S, Meehl GA, Senior CA, Stevens B, Stouffer RJ, Taylor KE (2016) Overview of the coupled model intercomparison project phase 6 (CMIP6) experimental design and organization. Geosci Model Dev 9:1937–1958
    1. Guo X, Khare S, Silvestro R, Huang J, Sylvain J-D, Delagrange S, Rossi S (2020) Minimum spring temperatures at the provenance origin drive leaf phenology in sugar maple populations. Tree Physiol 40:1639–1647 - PubMed
    1. Hogg EH, Michaelian M, Hook TI, Undershultz ME (2017) Recent climatic drying leads to age-independent growth reductions of white spruce stands in western Canada. Glob Change Biol 23:5297–5308 - PubMed

LinkOut - more resources