. 2024 Oct 19:17:3849-3861.
doi: 10.2147/DMSO.S480457. eCollection 2024.

Type 2 Diabetes Mellitus Aggravates Complement Dysregulation and Affects Cortisol Response in Patients with Post-COVID-19

Affiliations

Type 2 Diabetes Mellitus Aggravates Complement Dysregulation and Affects Cortisol Response in Patients with Post-COVID-19

Wenrui Ji et al. Diabetes Metab Syndr Obes. .

Abstract

Purpose: COVID-19 viral infection results in dysregulation of the complement system and a decrease in cortisol and adrenocorticotropin hormone (ACTH) levels. This study aimed to explore the complement system, as well as cortisol and ACTH responses in patients with post-COVID-19 conditions (PCC) and type 2 diabetes mellitus (T2DM).

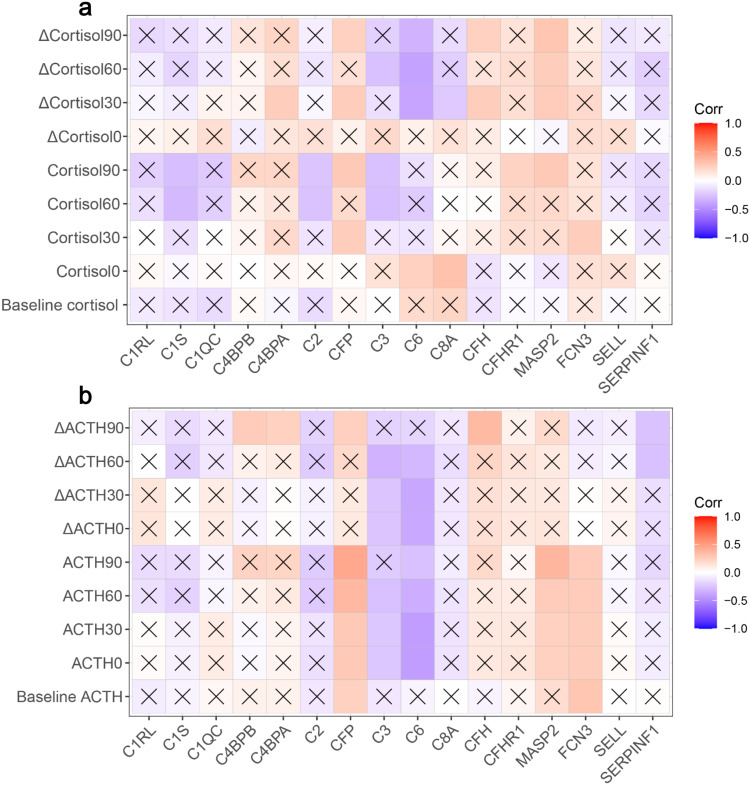
Patients and methods: This study recruited 31 patients with PCC and T2DM (PCC-T2DM), 19 patients with PCC (PCC), 10 patients with T2DM (T2DM), and 10 healthy participants (control). Cortisol and ACTH in the PCC and PCC-T2DM groups were assessed using the insulin tolerance test. In the fasting state, serum samples were collected for proteomic analyses. Spearman correlation analysis was performed between proteins and cortisol, as well as between proteins and ACTH.

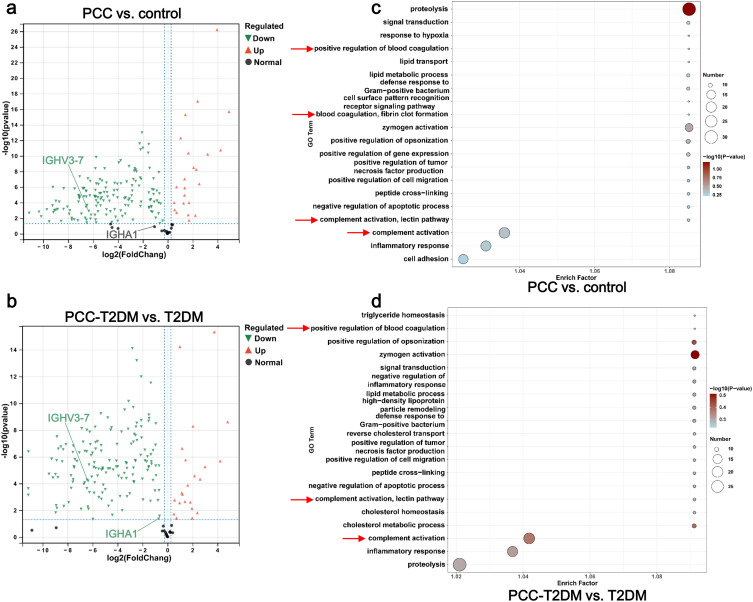
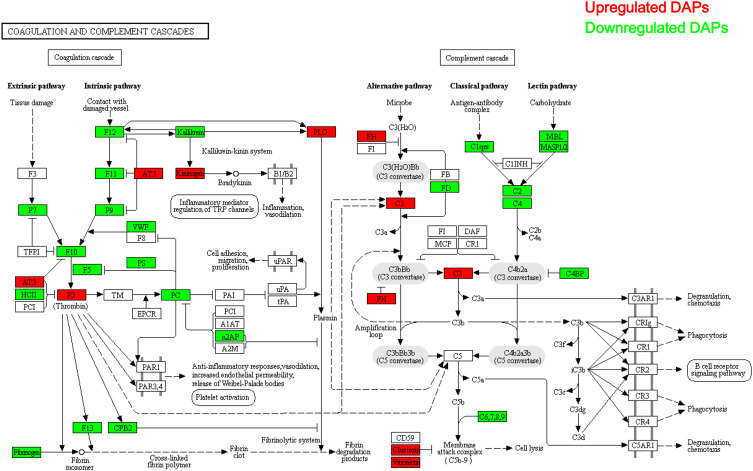
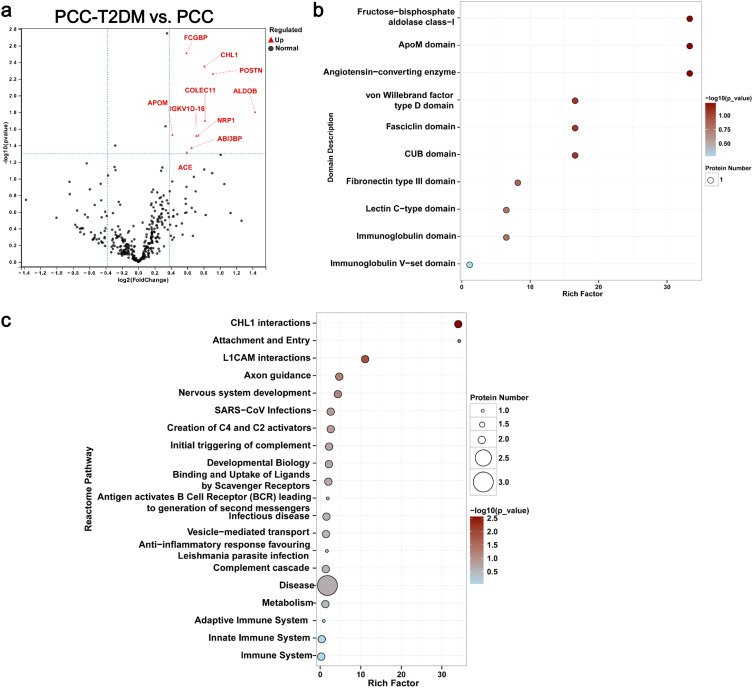
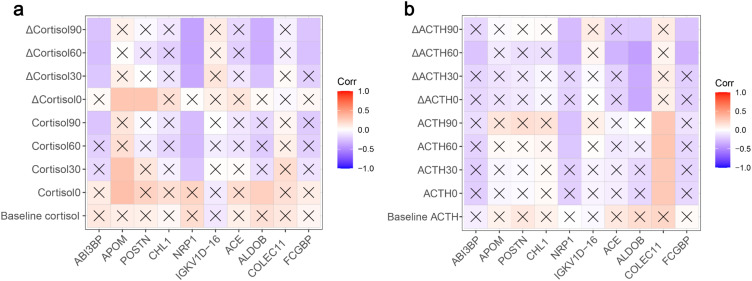
Results: Cortisol and ACTH levels were consistently decreased in the PCC and PCC-T2DM groups. Proteomic analyses revealed that most of the differentially abundant proteins (DAPs) in the PCC vs control and PCC-T2DM vs T2DM were involved in the coagulation and complement cascade, and the essential complement C3 was significantly upregulated in the PCC and PCC-T2DM groups when compared to their controls. Additionally, complement-related DAPs in the PCC vs control and PCC-T2DM vs T2DM were significantly correlated with cortisol and ACTH levels. In comparing PCC-T2DM samples with PCC samples, we found that upregulated DAPs were linked to the complement system and other immune system, and most DAPs were negatively correlated with cortisol and ACTH.

Conclusion: Our study revealed that T2DM exacerbated dysregulation of the complement system in patients with PCC, and significant correlations were present between complement protein levels and those of cortisol and ACTH. These results provide novel insights into the dysregulation of complement and endocrine hormones in patients with PCC and T2DM.

Keywords: adrenocorticotropin hormone; complement; cortisol; post-COVID-19 condition; type 2 diabetes mellitus.


Conflict of interest statement

The authors report no conflicts of interest in this work.

Figures

Figure 1
Figure 1
Dysregulation of complement and coagulation cascade in PCC patients and patients with PCC and T2DM. (a and b) Volcano plots indicate the DAPs in PCC vs control (a) and PCC-T2DM vs T2DM (b). The orange, green, and black dots represent upregulated, downregulated, and normal DAPs, respectively. (c and d) GO enrichment analysis of DAPs in the PCC vs control (c) and PCC-T2DM vs T2DM (d).
Figure 2
Figure 2
KEGG map of coagulation and complement cascades. KEGG map of coagulation and complement cascades (ko04610) depicts the relationships among 42 DAPs between PCC and control groups, as well as T2DM and PCC-T2DM groups. The red and green boxes represent upregulated and downregulated DAPs in the PCC and PCC-T2DM groups compared to the control and T2DM groups, respectively.
Figure 3
Figure 3
Correlation analysis between complement proteins and levels of cortisol ACTH. (a and b) Correlations between complement-related DAPs and cortisol (a) and ACTH (b) levels. The “×” in each box indicates that the p value is > 0.05, with color intensity indicating the Spearman correlation intensity. P < 0.05 is considered statistically significant correlations between two factors.
Figure 4
Figure 4
Enrichment analysis of DAPs between the PCC and PCC-T2DM groups. (a) Volcano plot showing fold change (log2 values) and probability (log10 values) for individual DAPs between the PCC-T2DM and PCC groups. Upregulated and normal DAPs are highlighted by red and black dots, respectively. (b and c) Bubble diagrams showing the enriched protein domains (b) and Reactome pathways (c) of DAPs between the PCC-T2DM and PCC subjects.
Figure 5
Figure 5
Correlation analysis between DAPs in the PCC-T2DM vs PCC and levels of cortisol ACTH. (a and b) Heatmap visualizing Spearman correlations between the expression of DAPs in the PCC-T2DM vs PCC and levels of cortisol (a) and ACTH (b).

Similar articles

References

    1. Sukocheva OA, Maksoud R, Beeraka NM. et al. Analysis of post COVID-19 condition and its overlap with myalgic encephalomyelitis/chronic fatigue syndrome. J Adv Res. 2022;40:179–196. doi:10.1016/j.jare.2021.11.013 - DOI - PMC - PubMed
    1. Soriano JB, Murthy S, Marshall JC, et al. A clinical case definition of post-COVID-19 condition by a Delphi consensus. Lancet Infect Dis. 2022;22(4):e102–e07. doi:10.1016/S1473-3099(21)00703-9 - DOI - PMC - PubMed
    1. Klein J, Wood J, Jaycox JR, et al. Distinguishing features of long COVID identified through immune profiling. Nature. 2023;623(7985):139–148. doi:10.1038/s41586-023-06651-y - DOI - PMC - PubMed
    1. Conte C, Cipponeri E, Roden M. Diabetes mellitus, energy metabolism, and COVID-19. Endocr Rev. 2024;45(2):281–308 doi:10.1210/endrev/bnad032. - DOI - PMC - PubMed
    1. Nassar M, Daoud A, Nso N, et al. Diabetes mellitus and COVID-19: review Article. Diabetes Metab Syndr. 2021;15(6):102268. doi:10.1016/j.dsx.2021.102268 - DOI - PMC - PubMed

LinkOut - more resources