

Contrasted agronomical and physiological responses of five Coffea arabica genotypes under soil water deficit in field conditions
- PMID: 39450079
- PMCID: PMC11500665
- DOI: 10.3389/fpls.2024.1443900
Contrasted agronomical and physiological responses of five Coffea arabica genotypes under soil water deficit in field conditions
Abstract
Introduction: Breeding programs have developed high-yielding Coffea arabica F1-hybrids as an adaptation against adverse conditions associated with climate change. However, theresponse to drought of coffee F1 hybrids has seldom been assessed.
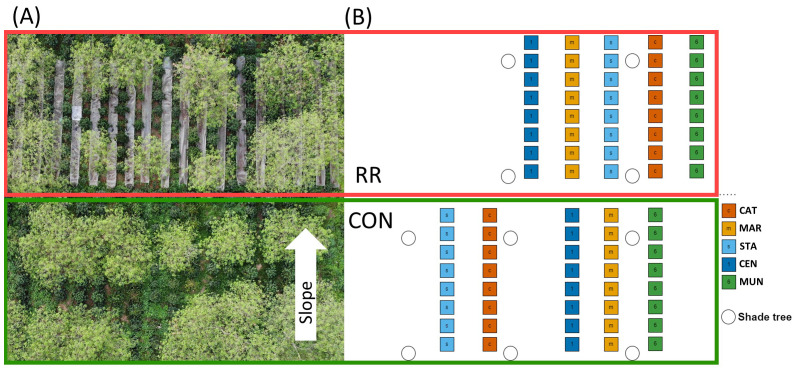
Methods: A trial was established with five C. arabica genotypes (2 pure lines: Catimor and Marsellesa and 3 F1 hybrids: Starmaya, Centroamericano and Mundo Maya) planted under the leguminous tree species Leuceana leucocephala. Coffee growth, yield and physiological responses were assessed under a rain-fed (control: CON) and a rainfall reduction treatment (RR) for 2 years.
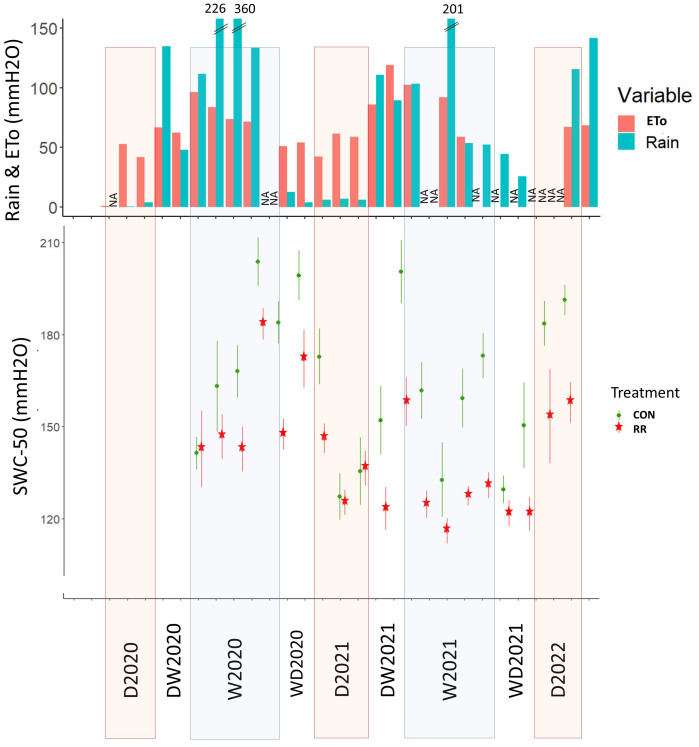
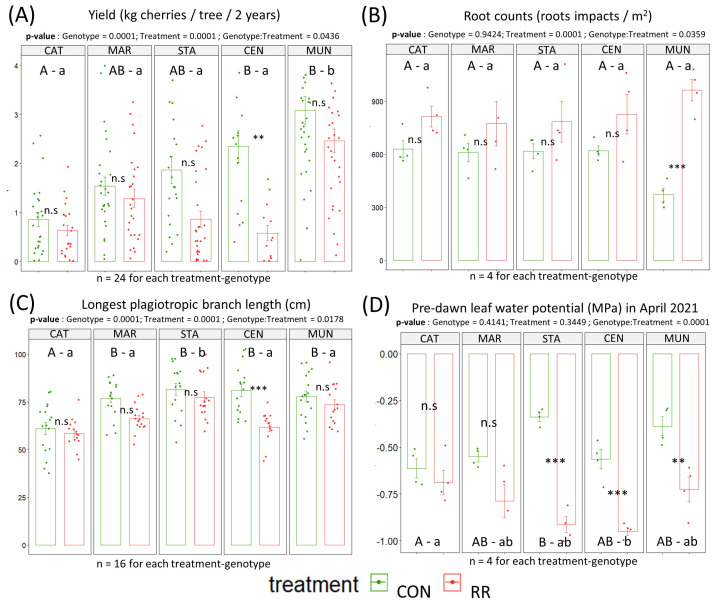
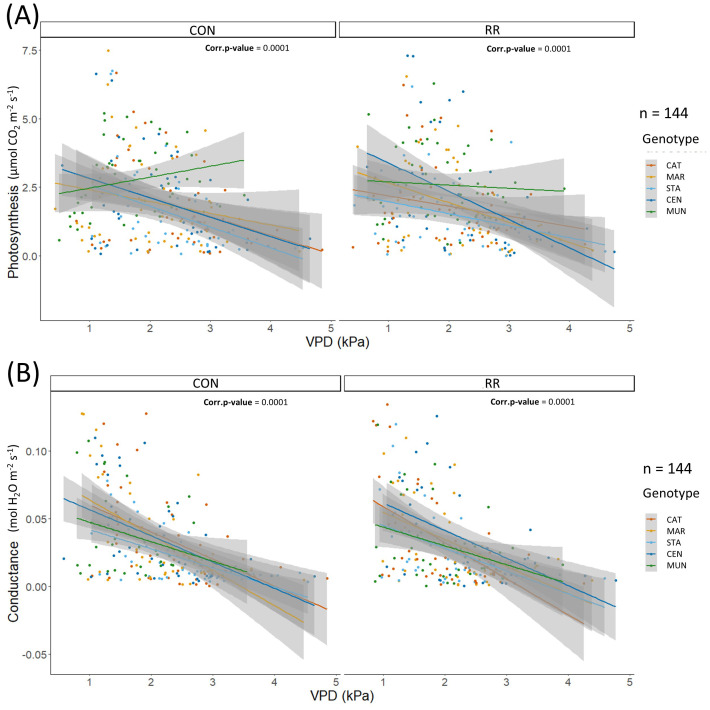
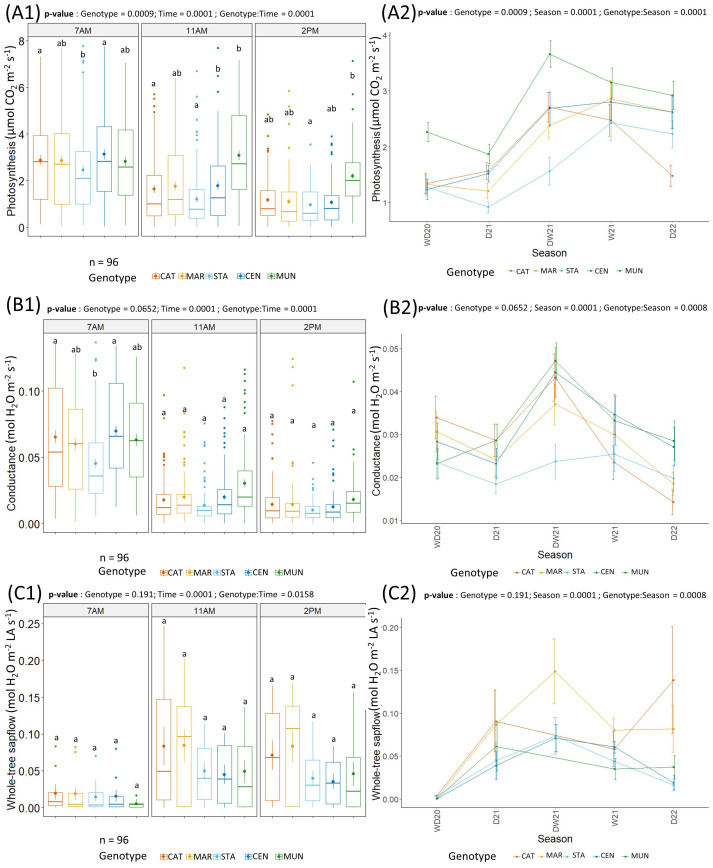
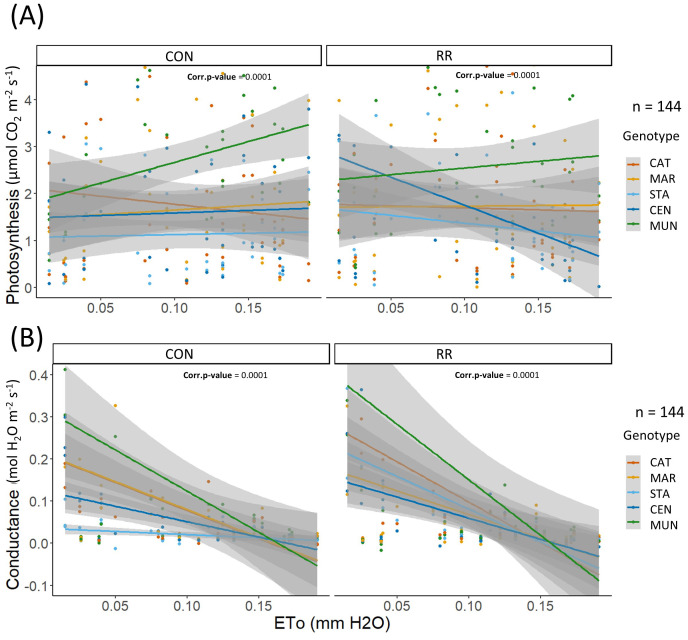
Results: The RR treatment created a long-term rainfall deficit in a region with suboptimal temperature similar to those predicted by climate change scenarios. Moreover, the RR treatment reduced soil water content by 14% over 2 successive years of production and increased hydric stress of the three F1-hybrids (leaf water potentials averaged -0.8 MPa under RR compared with -0.4 MPa under CON). Under RR, coffee yields were reduced from 16 to 75% compared to CON. Mundo Maya F1 hybrid was the sole high-yielding genotype apable of sustaining its yield under RR conditions. Our results suggested that its significant increase in fine root density (CON = 300 and RR = 910 root.m-2) and its maintenance of photosynthetic rate (2.5 - 3.5 mmol CO2 m-2 s-1) at high evaporative demand might explain why this genotype maintained high yield under RR condition.
Discussion: This work highlights a possible drought tolerance mechanism in fruit bearing adult coffee trees where the plant fine root number increases to intake more water in order to preserve turgor and sustainphotosynthesis at high ETo and therefore conserves high yield in dry conditions.
Keywords: Coffea arabica; Vietnam; climate change; drought tolerance; evapotranspiration; photosynthesis; plant physiology; water relations.
Copyright © 2024 Sarzynski, Vaast, Rigal, Marraccini, Delahaie, Georget, Nguyen, Nguyen, Nguyen, Ngoc, Ngan, Bossolasco and Etienne.
Conflict of interest statement
The authors declare that the research was conducted in the absence of any commercial or financial relationships that could be construed as a potential conflict of interest.
Figures
References
-
- Allen R. G., Pereira L. S., Raes D., Smith M. (1998). Crop evapotranspiration —guidelines for computing crop water requirements. FAO Irrigation and drainage paper 56 (Rome: Food and Agriculture Organization; ).
-
- Almeida W. L., Ávila R. T., Pérez-Molina J. P., Barbosa M. L., Marçal D. M. S., de Souza R. P. B., et al. (2021). The interplay between irrigation and fruiting on branch growth and mortality, gas exchange and water relations of coffee trees. Tree Physiol. 41, 35–49. doi: 10.1093/treephys/tpaa116 - DOI - PubMed
-
- Batista K. D., Araújo W. L., Antunes W. C., Cavatte P. C., Moraes G. A. B. K., Partelli F., et al. (2012). Photosynthetic limitations in coffee plants are chiefly governed by diffusive factors. Trees 26, 459–468. doi: 10.1007/s00468-011-0606-2 - DOI
-
- Bertrand B., Breitler J.-C., Georget F., Penot É., Bordeaux M., Marraccini P., et al. (2019). “New varieties for innovative agroforestry coffee systems,” in The agroecological transition of agricultural systems in the Global South. Eds. Côte F.-X., Poirier-Magona E., Perret S., Roudier P., Rapidel B., Thirion M.-C. (France: Quae; ), 161–176.
LinkOut - more resources
Full Text Sources