. 2024 Oct 10:15:1462076.
doi: 10.3389/fimmu.2024.1462076. eCollection 2024.

A novel strategy of co-expressing CXCR5 and IL-7 enhances CAR-T cell effectiveness in osteosarcoma

Affiliations

A novel strategy of co-expressing CXCR5 and IL-7 enhances CAR-T cell effectiveness in osteosarcoma

Xinhui Hui et al. Front Immunol. .

Abstract

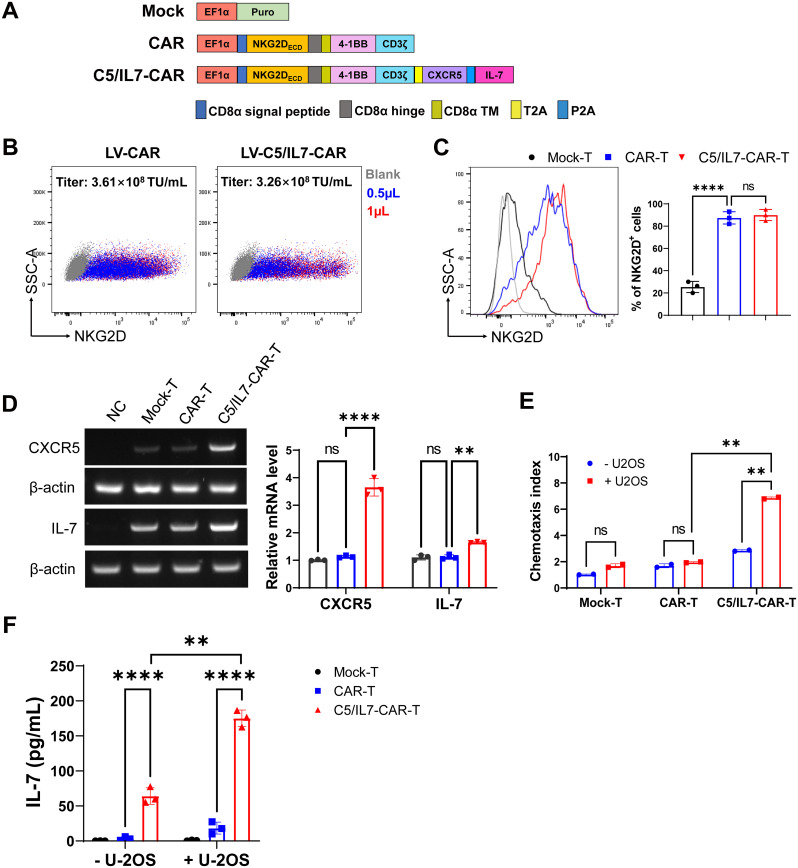
Background: Solid tumors are characterized by a low blood supply, complex stromal architecture, and immunosuppressive milieu, which inhibit CAR-T cell entry and survival. CXCR5 has previously been employed to increase CAR-T cell infiltration into CXCL13+ cancers. On the other hand, IL-7 improves the survival and persistence of T cells inside a solid tumor milieu.

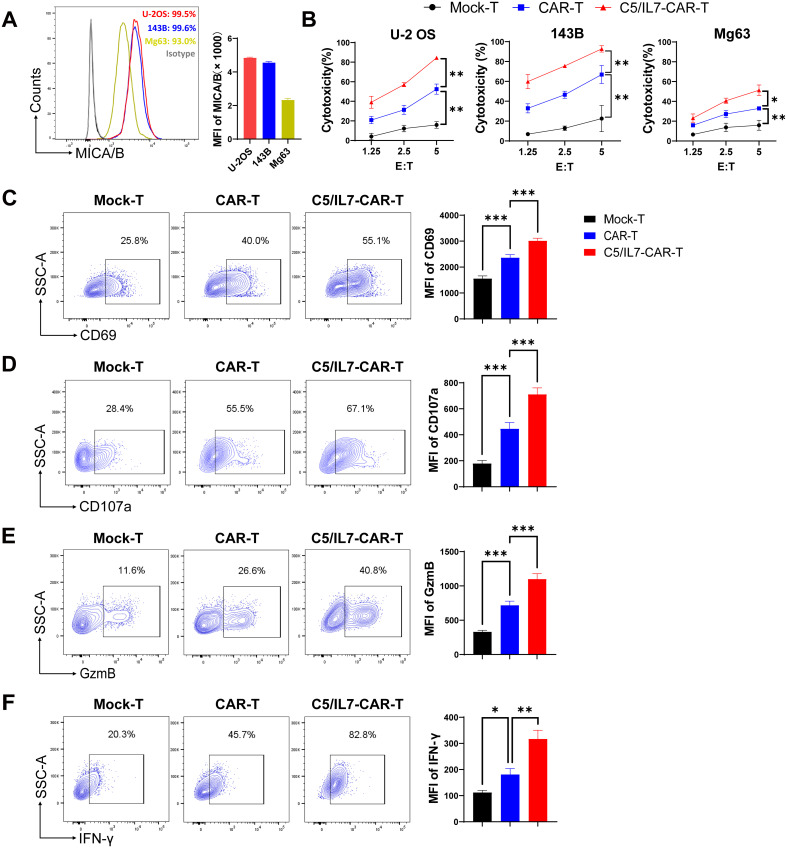
Methods: We constructed a novel NKG2D-based CAR (C5/IL7-CAR) that co-expressed CXCR5 and IL-7. The human osteosarcoma cell lines U-2 OS, 143B, and Mg63 highly expressed MICA/B and CXCL13, thus presenting a perfect avenue for the present study.

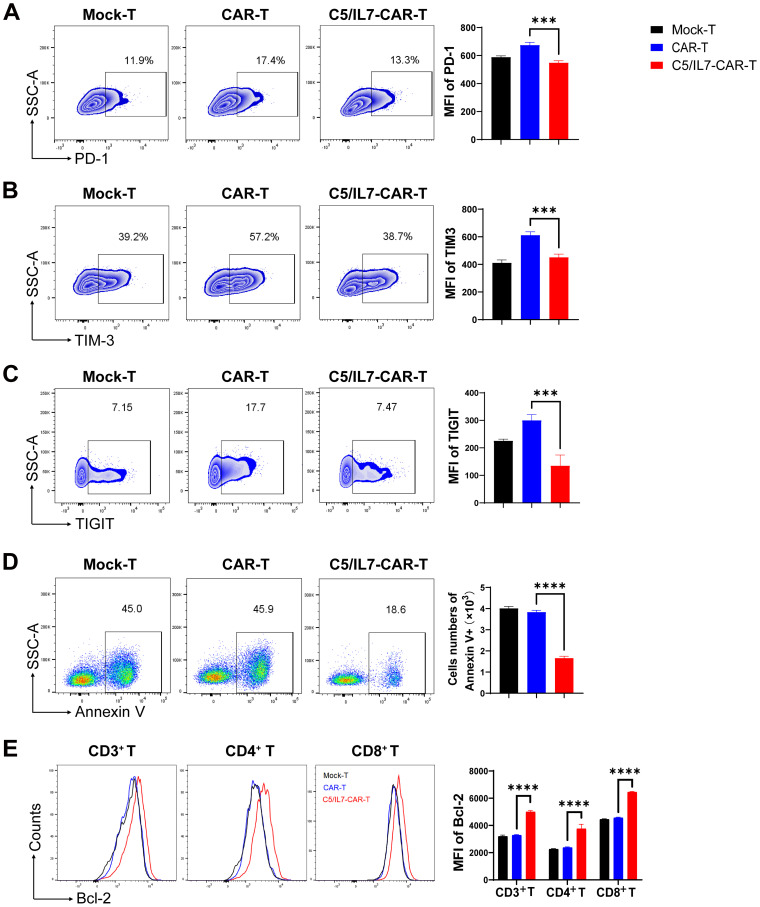
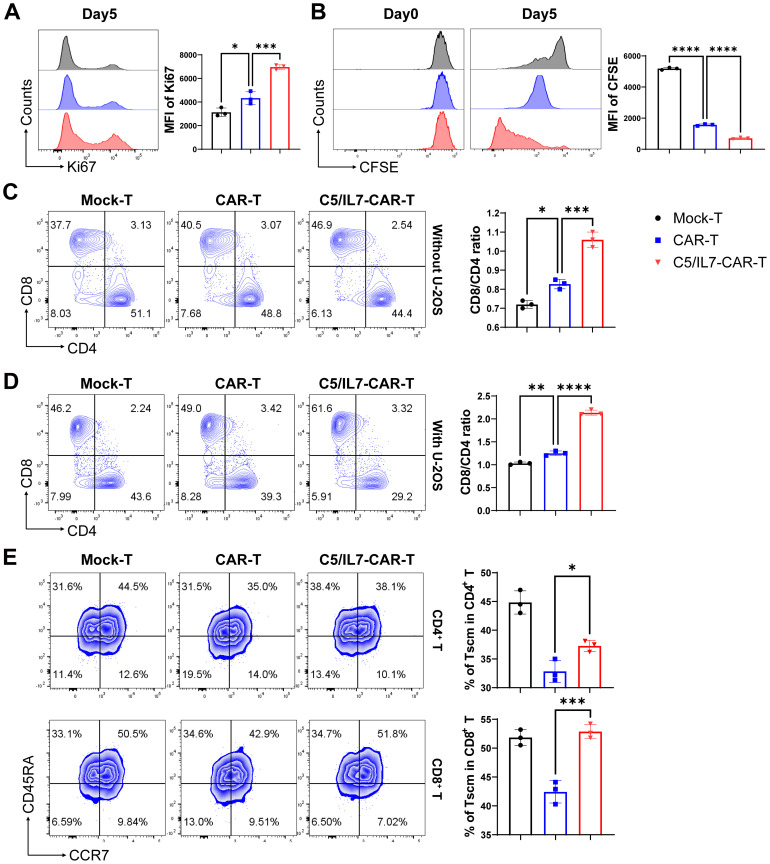
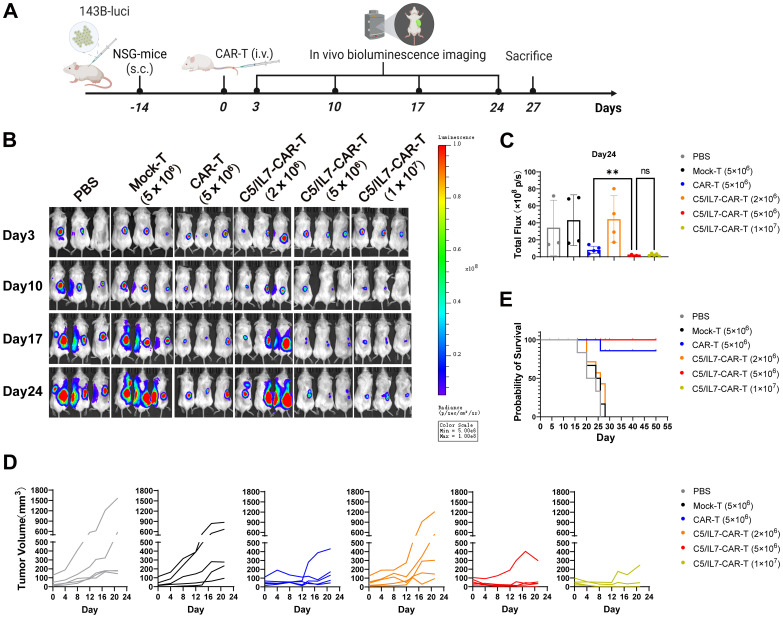
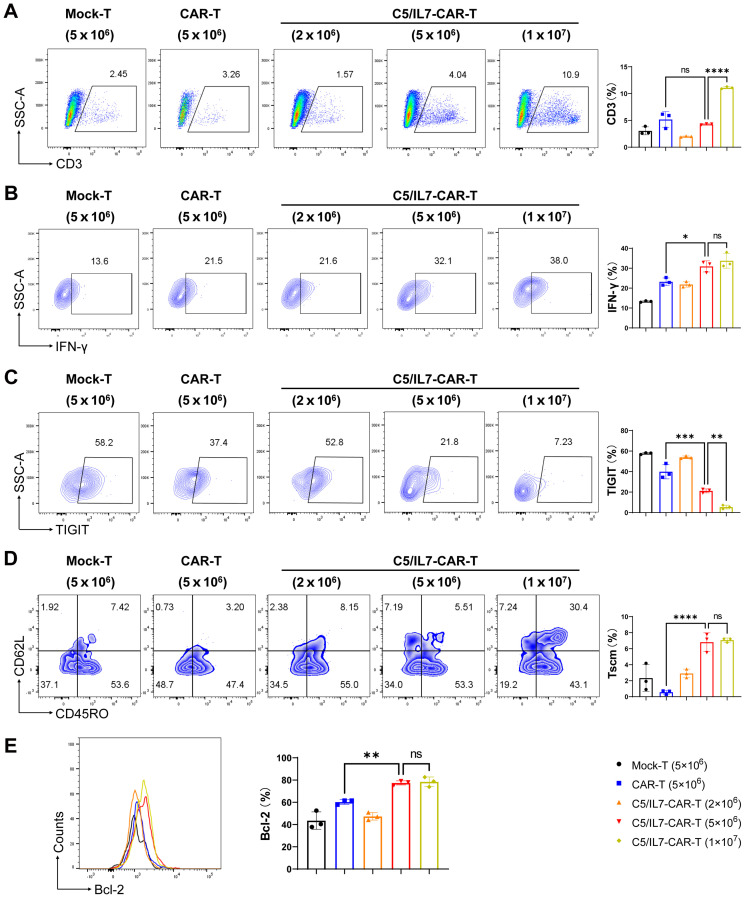
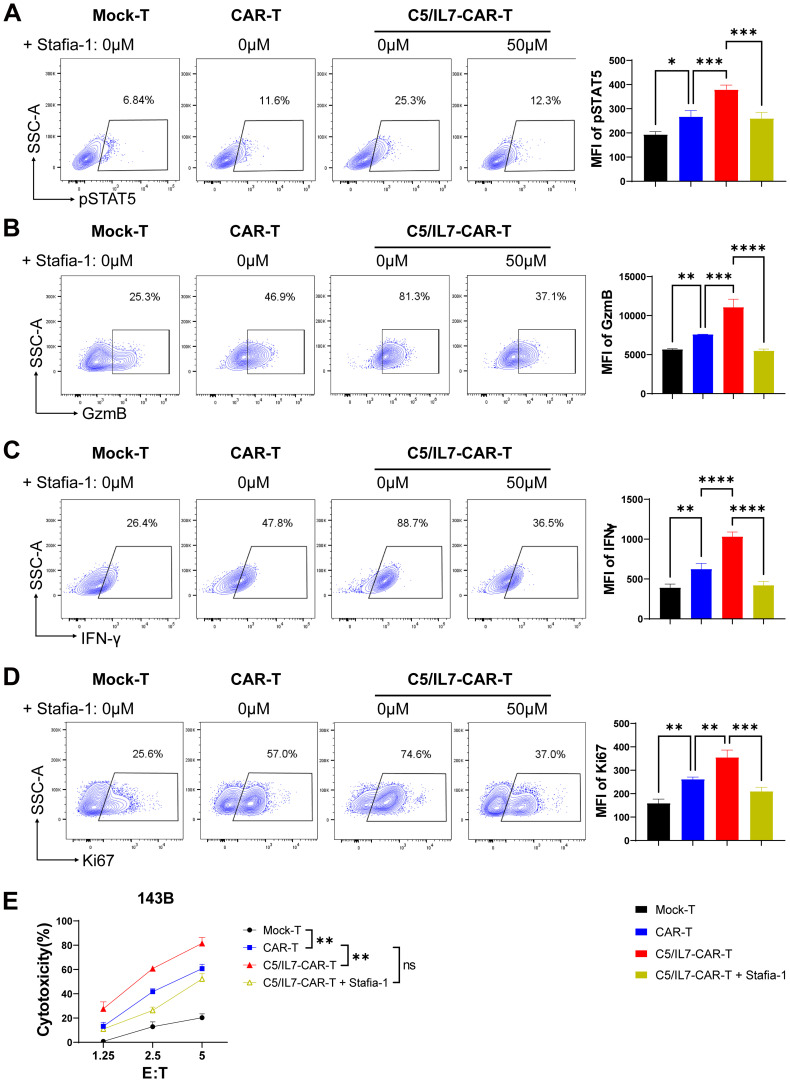
Results: Novel CAR-T cells are superior in their activation, degranulation, and cytokine release competence, hence lysing more target cells than conventional CAR. Furthermore, CXCR5 and IL-7 co-expression decreased the expression of PD-1, TIM-3, and TIGIT and increased Bcl-2 expression. Novel CAR-T cells show enhanced proliferation and differentiation towards the stem cell memory T cell phenotype. C5/IL7-CAR-T cells outperformed conventional CAR-T in eradicating osteosarcoma in mouse models and displayed better survival. Additionally, CXCR5 and IL-7 co-expression enhanced CAR-T cell numbers, cytokine release, and survival in implanted tumor tissues compared to conventional CAR-T cells. Mechanistically, C5/IL7-CAR-T cells displayed enhanced STAT5 signaling.

Conclusion: These findings highlight the potential of CXCR5 and IL-7 co-expression to improve CAR-T cell therapy efficacy against osteosarcoma.

Keywords: CAR-T therapy; CXCR5; IL-7; T cell migration; osteosarcoma; tumor microenvironment.


Conflict of interest statement

The authors declare that the research was conducted in the absence of any commercial or financial relationships that could be construed as a potential conflict of interest.

Figures

Figure 1
Figure 1
C5/IL7-CAR vector construction and validation. (A) Schematic representation of Mock, CAR, and C5/IL7-CAR constructs. (B) 2×10⁵ HEK293T cells were transduced with different volumes of CAR and C5/IL7-CAR lentiviruses separately. After 48 hours, NKG2D expressions were analyzed by flow cytometry. The percentages of positive cells indicated in the dot plot and the titer (TU/mL) were calculated with the formula: (2×10⁵×percentages of positive cells×1000)/Volume of lentiviruses. (C) 1×10⁶ primary T cells were transduced with Mock, CAR, and C5/IL7-CAR lentiviruses, MOI=10. After 48 hours, cells were analyzed by flow cytometry for NKG2D expression. The percentages of positive cells are indicated in the histogram (left panel) and bar chart (right panel). (D) Mock-T, CAR-T, and C5/IL7-CAR-T were collected 48 hours post-transduction and were subjected to RT-PCR for CXCR5 and IL-7 gene expression analysis. HEK293T cells were used as a negative control. β-actin was used as a reference housekeeping gene. (E) The Chemotaxis index of CAR-T cells was determined using a transwell assay. In each experimental group, 3×10⁵ cells were placed in the upper chamber of a 24-well transwell plate. After a 4-hour co-culture period, their migratory response towards the lower chamber containing either DMEM or supernatant from U-2 OS cells was evaluated. The number of migrated T cells was quantified using a hemocytometer. Data are presented based on three technical repeats with T cells cultured without cancer cell supernatant indicated in blue and those exposed to cancer cell supernatant in red. (F) Mock-T, CAR-T, and C5/IL7-CAR-T cohorts were cultured with or without U-2 OS cells for 24 hours, and the medium was collected and subjected to ELISA for IL-7 protein expression. Experiments were performed independently at least 3 times. For (C), One-way ANOVA was used in Tukey’s multiple comparison test, and for (D–F), Two-way ANOVA was used in Šídák’s multiple comparison test. Data represent Mean ± SD. **P < 0.01, ****P < 0.0001, ns, not significant.
Figure 2
Figure 2
In vitro effector function of C5/IL7-CAR-T cells. (A) U-2 OS, 143B, and Mg63 cells were analyzed by flow cytometry for NKG2D Ligands (MICA/B) expression. U-2 OS is shown in red, 143B in blue and Mg63 in the yellow color histogram. Data are presented as Mean Fluorescence Intensity (MFI) normalized to unstained cells. (B) Cytotoxic analysis against U-2 OS, 143B, and Mg63 target cells. Experimental cohorts were cocultured with luciferase-transduced U-2 OS, 143B, and Mg63 target cells at varying effector-to-target (E: T) ratios for 16 hours. Percentage lysis was quantified using a luciferase-based cytotoxicity assay. (C–F) Flow cytometry analysis of CD69, CD107a, GzmB, and IFN-γ expression in Mock-T, CAR-T, and C5/IL7-CAR-T cohorts following a 16-hour co-culture with target cells at an E: T ratio of 3:1. Data is presented in a contour plot (left panel), and MFI is indicated by bar graphs (right panel). Experiments were performed independently at least 3 times. One-way ANOVA was used in Tukey’s multiple comparison test, and Data represent Mean ± SD. *P < 0.05, **P < 0.01, ***P < 0.001.
Figure 3
Figure 3
C5/IL7-CAR-T cells displayed reduced exhaustion and apoptosis in vitro. (A–C) Flow cytometry analysis of exhaustion markers PD-1, TIM-3, and TIGIT was performed after co-culturing Mock-T, CAR-T, and C5/IL7-CAR-T cells with U-2 OS for 3 days at an E: T ratio of 3:1. Representative FACS files are shown on the left, and MFI bar graph is presented on the right side. (D) Flow cytometry-based quantification of apoptotic cells in Mock-T, CAR-T, and C5/IL7-CAR-T cohorts. The cells were cultured for 5 days, harvested, and subsequently stained with Annexin V for 15 minutes in the dark at room temperature (RT). Flow cytometry analysis was conducted. The left and right panels displayed representative FACS files and absolute Annexin V+ cell counts, respectively. (E) Following a 5-day culture of Mock-T, CAR-T, and C5/IL7-CAR-T cells were collected, and Bcl-2 expression within CD3+, CD4+, and CD8+ T-cell populations was evaluated using flow cytometry. Representative histogram (left panel) and MFI (right panel) are shown. Experiments were performed independently at least 3 times. For (A–D), One-way ANOVA was used in Tukey’s multiple comparison test; for (E), Two-way ANOVA was used in Tukey’s multiple comparison test. Data represent Mean ± SD. ***P < 0.001, ****P < 0.0001.
Figure 4
Figure 4
C5/IL7-CAR-T cells exhibit enhanced proliferation and differentiation. (A) To assess proliferation in the absence of target cells, Mock-T, CAR-T, and C5/IL7-CAR-T cells were cultured for 5 days, and analysis of Ki67 expression was detected by flow cytometry. A representative histogram is shown on the left, and MFI is presented on the right side. (B) To further assess proliferation in the presence of target cells, 1×10⁶ cells from Mock-T, CAR-T, and C5/IL7-CAR-T groups were initially labeled with 1µl of CFSE, and 2×10⁵ cells underwent flow cytometry analysis for CFSE dilution designated as day 0 in FITC channel. The remaining cells were co-cultured with U-2 OS for 5 days. Subsequently, on the 5th day, the CFSE dilution rate was once again measured using the same template in flow cytometry. (C, D) Mock-T, CAR-T, and C5/IL7-CAR-T cells were cultured with or without U-2 OS for 5 days. Flow cytometry analysis determined T cell subsets, presented in the left panel, while the calculated CD8/CD4 ratio is shown in the right panel. (E) For T cell differentiation, cells from each experimental group, after 5 days of co-cultured with U-2OS, were analyzed by flow cytometry. Tscm: Stem cell memory T cell (CCR7+CD45RA+), Tcm: Central memory T cell (CCR7+CD45RA-), Tem: Effector memory T cell (CCR7-CD45RA-), Teff: Effector T cell (CCR7-CD45RA+). Experiments were performed independently at least 3 times. One-way ANOVA was used in Tukey’s multiple comparison test, and data represent Mean ± SD. *P < 0.05, **P < 0.01, ***P < 0.001, ****P < 0.0001.
Figure 5
Figure 5
C5/IL7-CAR-T cells express advanced and enhanced antitumor activity in vivo. (A) Schematic representation of in vivo experimental design. NSG mice were subcutaneously (s.c.) inoculated with 2×10⁶ 143B-luciferase cells/mouse; Mice were randomly divided into 6 experimental groups (n=6), receiving treatments of PBS, Mock-T (5×10⁶), CAR-T (5×10⁶), and C5/IL7-CAR-T with varying cell numbers (2×10⁶, 5×10⁶, 1×10⁷) cells/mice. (B) In vivo, bioluminescence imaging was employed to assess the progression of 143B-Luciferase+ tumors in each experimental group on days 3, 10, 17, and 24 (n=5). (C) On day 24, the total bioluminescence flux (photons per second) emitted by tumors was quantified through bioluminescence imaging. (D) Tumor volume was assessed at 3-day intervals using calipers. Each line on the graph represents the dynamic representation of tumor volume for an individual mouse (n=5). (E) Kaplan-Meier survival curve visually depicted the overall survival data for mice in each experimental group (n=6). Statistical significance was assessed using one-way ANOVA Tukey’s test. **p < 0.01 and ns is non-significant.
Figure 6
Figure 6
C5/IL7-CAR-T cells displayed better migration and survival in vivo. Mice were sacrificed on day 27 post-treatment; tumors were extracted, and single-cell suspensions were prepared for detailed immuno-profiling using flow cytometry analysis (n=3). The assessment encompassing: (A) CD3+ T cells were quantified through staining with BV421 anti-human CD3 antibody, (B) IFN-γ levels were assessed by staining with APC anti-human IFN-γ antibody, (C) TIGIT expression was examined by BV421 anti-human TIGIT antibody, (D) T cell differentiation status was characterized through staining with PE anti-human CD45RO, AF700 anti-human CD62L and BV421 anti-human CD3 antibodies. (E) Bcl-2 expression was analyzed after intracellular staining with PE anti-human Bcl-2 antibody. Each experiment was conducted independently. FACS analysis files are presented in the left panel, while the corresponding column chats on the right. Statistical significance was measured using way one-way ANOVA. *p < 0.05, **p < 0.01, ***p < 0.001, ****p < 0.0001 and ns is non-significant.
Figure 7
Figure 7
C5/IL7-CAR-T cells exhibit antitumor activity via pSTAT5 signaling. (A–D), Mock-T, CAR-T, and C5/IL7-CAR-T cells, treated with either DMSO or Stafia-1 (50µM), were co-incubated with 143B cells for 24 hours at an E: T ratio of 3:1. Cells were then stained with FACS antibodies to detect pSTAT5 (A), GzmB (B), IFN-γ (C) and Ki67 (D) expression using flow cytometry. Representative FACS files are indicated on the left, and MFI bar graphs are shown on the right. (E), Mock-T, CAR-T, C5/IL7-CAR-T and Stafia-1 treated C5/IL7-CAR-T cells were co-cultured with 143B-luciferase cells at various E: T ratios (1.25:1, 2.5:1 and 5:1) for 16-hours. Cytotoxicity was quantified using a luciferase assay. Experiments were performed independently at least 3 times. One-way ANOVA was used in Tukey’s multiple comparison test, and data represent Mean ± SD. *P < 0.05, **P < 0.01, ***P < 0.001, ****P < 0.0001, ns, ns, not significant.

Similar articles

Cited by

References

    1. Köksal H, Müller E, Inderberg EM, Bruland Ø, Wälchli S. Treating osteosarcoma with CAR T cells. Scand J Immunol. (2019) 89:e12741. doi: 10.1111/sji.12741 - DOI - PubMed
    1. Gill J, Gorlick R. Advancing therapy for osteosarcoma. Nat Rev Clin Oncol. (2021) 18:609–24. doi: 10.1038/s41571-021-00519-8 - DOI - PubMed
    1. Liu G, Rui W, Zhao X, Lin X. Enhancing CAR-T cell efficacy in solid tumors by targeting the tumor microenvironment. Cell Mol Immunol. (2021) 18:1085–95. doi: 10.1038/s41423-021-00655-2 - DOI - PMC - PubMed
    1. Zhang Q, Zhang Z, Liu G, Li D, Gu Z, Zhang L, et al. . B7-H3 targeted CAR-T cells show highly efficient anti-tumor function against osteosarcoma both. Vitro vivo. BMC cancer. (2022) 22:1124. doi: 10.1186/s12885-022-10229-8 - DOI - PMC - PubMed
    1. Wang Y, Yu W, Zhu J, Wang J, Xia K, Liang C, et al. . Anti-CD166/4-1BB chimeric antigen receptor T cell therapy for the treatment of osteosarcoma. J Exp Clin Cancer Res. (2019) 38:1–11. doi: 10.1186/s13046-019-1147-6 - DOI - PMC - PubMed

MeSH terms